This comprehensive guide compares LAVA and AAVE, two distinct protocols in the cryptocurrency landscape. LAVA, launched in 2024, operates as an emerging blockchain infrastructure protocol coordinating AI agents and cross-chain data aggregation, currently trading at 0.08968 USD with significant volatility. AAVE, established since 2020, functions as a leading decentralized lending protocol with proven market adoption, trading at 163 USD with substantial institutional recognition. The article analyzes historical price trends, current market status with real-time pricing from Gate, supply mechanisms, institutional adoption patterns, technological ecosystems, and multi-year price projections through 2031. It evaluates investment strategies across conservative and aggressive profiles, examines comparative risk factors including market, technical, and regulatory dimensions, and provides evidence-based recommendations for different investor types. Finally, it addresses critical investment considerations including liq
Introduction: LAVA vs AAVE Investment Comparison
In the cryptocurrency market, the comparison between LAVA vs AAVE has consistently been a topic of interest for investors. The two differ significantly in market cap ranking, application scenarios, and price performance, representing distinct positioning within the crypto asset landscape.
LAVA (LAVA): Since its launch in 2024, it has gained market recognition through its positioning as a protocol coordinating traffic from AI agents, applications, and wallets across blockchains, aggregating data providers based on speed and reliability.
AAVE (AAVE): Since its inception in 2020, it has been regarded as a leading decentralized lending protocol, offering deposit and lending services with algorithmically determined interest rates. As one of the prominent DeFi protocols, AAVE ranks significantly higher in market capitalization.
This article will provide a comprehensive analysis of the LAVA vs AAVE investment value comparison, focusing on historical price trends, supply mechanisms, institutional adoption, technological ecosystems, and future projections, while attempting to address the question investors care about most:
"Which is the better buy right now?"
I. Historical Price Comparison and Market Status
- 2020: AAVE converted from LEND token at a ratio of 100:1 on October 3, 2020, establishing its current token structure.
- 2021: AAVE reached its all-time high of 661.69 USD on May 19, 2021, reflecting strong market momentum during the bull cycle.
- 2024: LAVA launched on July 29, 2024, with an initial price of 0.1 USD, entering the market during a relatively mature phase of the crypto ecosystem.
- 2025: LAVA experienced significant price volatility, reaching an all-time high of 0.26114 USD on December 7, 2025, before declining to an all-time low of 0.008 USD on January 9, 2025.
- Comparative Analysis: During the recent market cycle, LAVA declined from its high of 0.26114 USD to 0.008 USD, representing substantial volatility for a newly launched asset. Meanwhile, AAVE has declined from its historical peak of 661.69 USD, currently trading significantly below its all-time high, reflecting broader market corrections affecting established DeFi protocols.
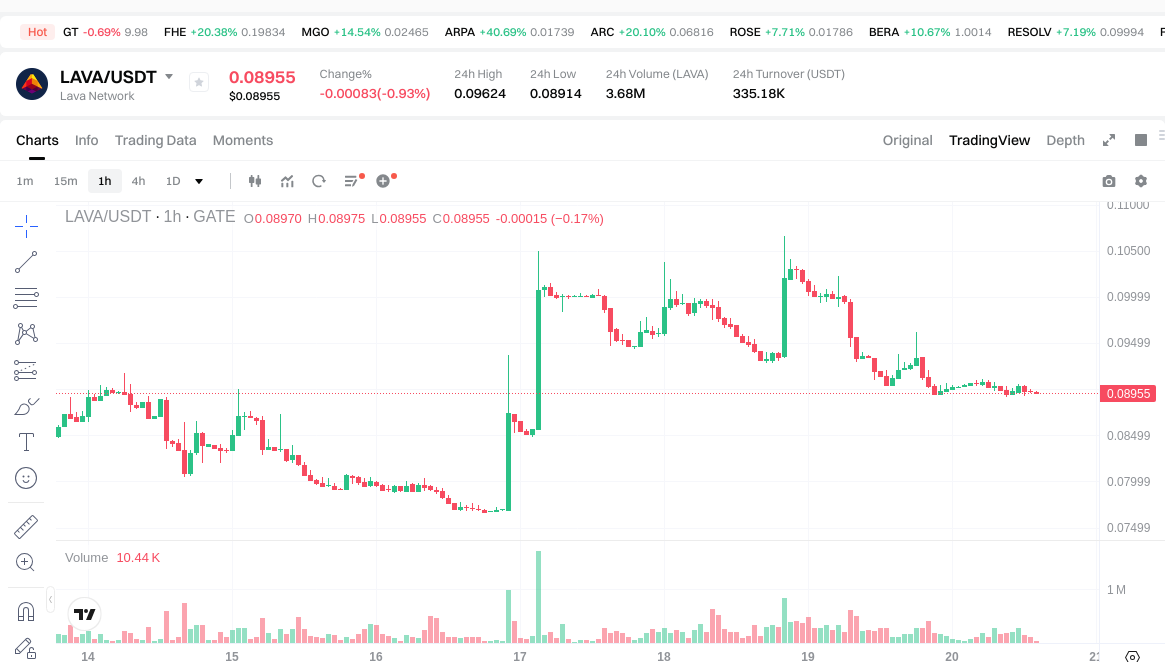
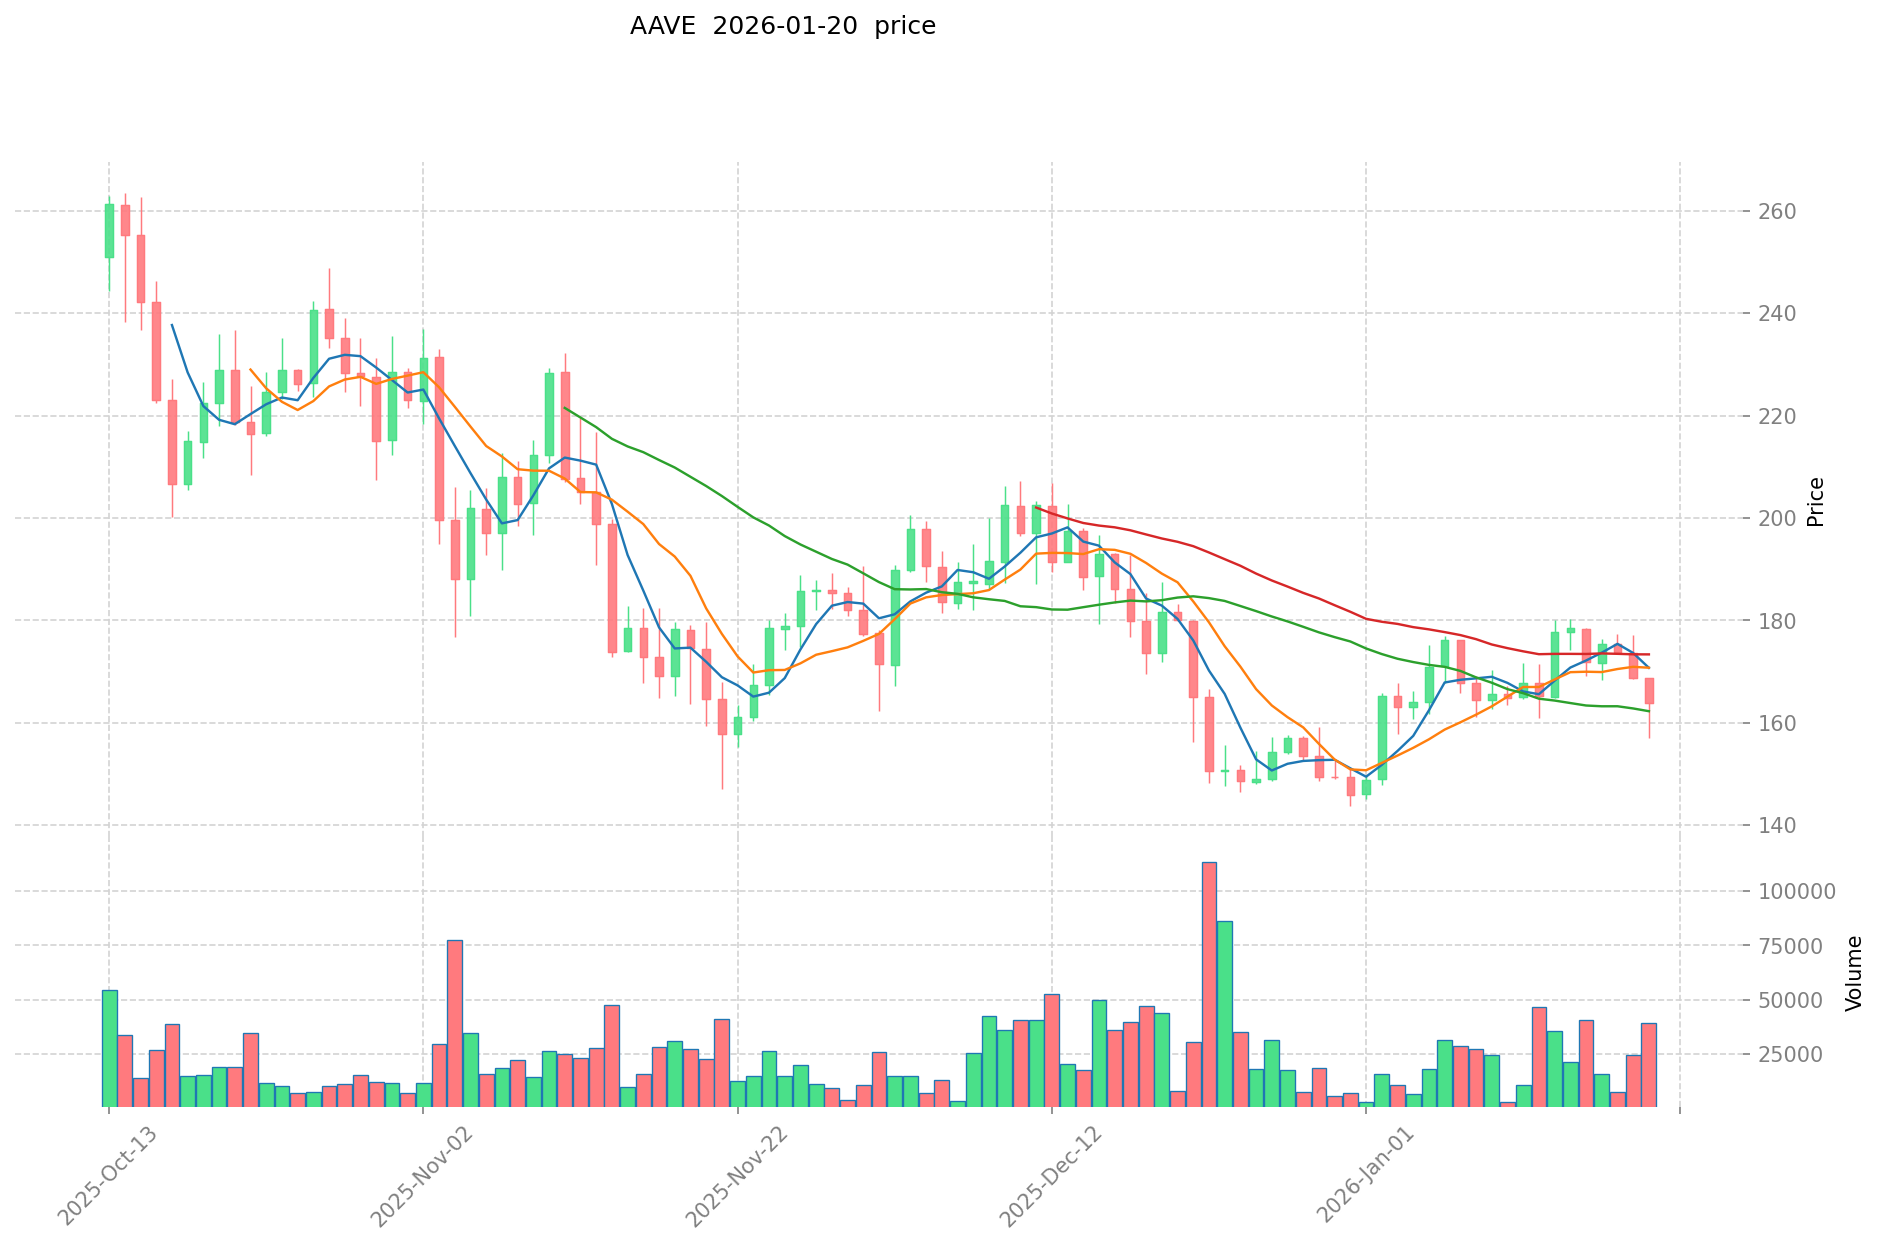
Current Market Status (2026-01-20)
- LAVA Current Price: 0.08968 USD
- AAVE Current Price: 163 USD
- 24-Hour Trading Volume: LAVA 335,385.02 USD vs AAVE 2,786,448.19 USD
- Market Sentiment Index (Fear & Greed Index): 32 (Fear)
View Real-Time Prices:
II. Core Factors Affecting LAVA vs AAVE Investment Value
Supply Mechanism Comparison (Tokenomics)
Based on available information, specific supply mechanism details for LAVA and AAVE cannot be determined from the provided materials. Generally, tokenomics structures influence price dynamics through emission schedules, circulation changes, and incentive mechanisms.
Institutional Adoption and Market Application
Institutional Holdings: Comparative data on institutional preference between LAVA and AAVE is not available in the reference materials.
Enterprise Adoption: Specific applications of LAVA or AAVE in cross-border payments, settlements, or investment portfolios are not documented in the provided sources.
National Policies: Information regarding different countries' regulatory stances toward LAVA and AAVE is not present in the reference materials.
Technology Development and Ecosystem Building
LAVA Technology Updates: Details about LAVA's technical upgrades and their potential impacts are not available in the provided materials.
AAVE Technology Development: Information regarding AAVE's technical developments and potential implications is not documented in the reference sources.
Ecosystem Comparison: Comparative data on DeFi integration, NFT applications, payment solutions, and smart contract implementations for both assets is not available in the provided materials.
Macroeconomic Factors and Market Cycles
Performance in Inflationary Environments: Comparative analysis of inflation-hedging properties between LAVA and AAVE is not available in the reference materials.
Macroeconomic Monetary Policy: Specific impacts of interest rates and dollar index movements on these two assets are not documented in the provided sources.
Geopolitical Factors: Information regarding cross-border transaction demand and international circumstances affecting LAVA and AAVE is not present in the reference materials.
III. 2026-2031 Price Prediction: LAVA vs AAVE
Short-term Forecast (2026)
- LAVA: Conservative $0.0627-$0.0896 | Optimistic $0.0896-$0.1192
- AAVE: Conservative $151.50-$162.90 | Optimistic $162.90-$203.63
Mid-term Forecast (2028-2029)
- LAVA may enter a consolidation phase, with projected price range of $0.0946-$0.1604 in 2028 and $0.0937-$0.1475 in 2029
- AAVE may enter a growth phase, with projected price range of $139.51-$193.45 in 2028 and $172.66-$204.91 in 2029
- Key drivers: institutional capital inflows, ETF developments, ecosystem expansion
Long-term Forecast (2030-2031)
- LAVA: Base scenario $0.0956-$0.1427 (2030), $0.0896-$0.1691 (2031) | Optimistic scenario $0.1427-$0.1955 (2030), $0.1691-$0.2502 (2031)
- AAVE: Base scenario $142.07-$197.32 (2030), $167.76-$215.08 (2031) | Optimistic scenario $197.32-$232.84 (2030), $215.08-$240.89 (2031)
View detailed price predictions for LAVA and AAVE
Disclaimer
LAVA:
| Year |
Predicted High Price |
Predicted Average Price |
Predicted Low Price |
Price Change |
| 2026 |
0.1191813 |
0.08961 |
0.062727 |
0 |
| 2027 |
0.1263187365 |
0.10439565 |
0.0908242155 |
16 |
| 2028 |
0.1603464986175 |
0.11535719325 |
0.094592898465 |
28 |
| 2029 |
0.147501475149112 |
0.13785184593375 |
0.09373925523495 |
53 |
| 2030 |
0.19546702494176 |
0.142676660541431 |
0.095593362562758 |
59 |
| 2031 |
0.250226327257562 |
0.169071842741596 |
0.089608076653045 |
88 |
AAVE:
| Year |
Predicted High Price |
Predicted Average Price |
Predicted Low Price |
Price Change |
| 2026 |
203.625 |
162.9 |
151.497 |
0 |
| 2027 |
188.760375 |
183.2625 |
100.794375 |
12 |
| 2028 |
193.451895 |
186.0114375 |
139.508578125 |
14 |
| 2029 |
204.91019955 |
189.73166625 |
172.6558162875 |
16 |
| 2030 |
232.838700822 |
197.3209329 |
142.071071688 |
21 |
| 2031 |
240.88939488432 |
215.079816861 |
167.76225715158 |
31 |
IV. Investment Strategy Comparison: LAVA vs AAVE
Long-term vs Short-term Investment Strategies
-
LAVA: May suit investors interested in emerging blockchain infrastructure protocols, particularly those focused on AI agent coordination and cross-chain data aggregation. Given its recent launch in 2024 and developing ecosystem, LAVA represents a higher-risk, higher-potential-return profile with significant price volatility.
-
AAVE: May appeal to investors seeking exposure to established DeFi protocols with proven track records. As a mature lending platform operational since 2020, AAVE offers relatively more market history and adoption metrics for evaluation, though still subject to broader crypto market dynamics.
Risk Management and Asset Allocation
-
Conservative Investors: LAVA 10-20% vs AAVE 80-90% - This allocation emphasizes exposure to more established protocols while maintaining limited exposure to emerging infrastructure projects.
-
Aggressive Investors: LAVA 40-50% vs AAVE 50-60% - This strategy balances established DeFi exposure with higher-risk infrastructure plays for potential asymmetric returns.
-
Hedging Tools: Stablecoin allocation for liquidity management, options strategies for downside protection, cross-asset portfolio diversification across different crypto sectors.
V. Potential Risk Comparison
Market Risk
-
LAVA: As a recently launched protocol (July 2024), LAVA exhibits substantial price volatility, having declined from 0.26114 USD to 0.008 USD within months. Limited trading volume (335,385.02 USD in 24 hours) may result in liquidity constraints and increased slippage during market stress.
-
AAVE: While more established, AAVE has experienced significant decline from its historical peak of 661.69 USD. As a DeFi protocol, AAVE remains subject to broader market sentiment shifts, regulatory developments affecting decentralized finance, and competition from emerging lending platforms.
Technical Risk
-
LAVA: As an infrastructure protocol coordinating AI agents and cross-chain data, LAVA faces scalability challenges inherent to multi-chain coordination systems and network stability concerns during ecosystem expansion phases.
-
AAVE: DeFi lending protocols face smart contract vulnerabilities, oracle manipulation risks, and potential liquidation cascade scenarios during extreme market volatility. Protocol upgrades and governance changes may introduce unforeseen technical complications.
Regulatory Risk
Global regulatory frameworks continue evolving with differing approaches to DeFi protocols and blockchain infrastructure. Jurisdictional variations in securities classification, lending regulations, and cross-border data coordination may impact both projects differently. Established protocols like AAVE may face increased scrutiny due to their lending functions, while emerging infrastructure projects like LAVA navigate uncertain regulatory categorization.
VI. Conclusion: Which Is the Better Buy?
📌 Investment Value Summary:
-
LAVA Strengths: Emerging infrastructure protocol positioned at the intersection of AI agents and blockchain coordination, potential for growth as the ecosystem develops, early-stage entry opportunity for risk-tolerant investors.
-
AAVE Strengths: Established DeFi lending protocol with operational history since 2020, recognized market position in decentralized finance, relatively higher liquidity and trading volume compared to newer projects.
✅ Investment Recommendations:
-
Novice Investors: Consider starting with more established protocols that offer greater market data and operational history for evaluation. Prioritize understanding fundamental mechanisms before exposure to highly volatile emerging assets.
-
Experienced Investors: Evaluate portfolio allocation based on risk tolerance and investment thesis. Diversification across different crypto sectors (infrastructure, DeFi, etc.) may provide balanced exposure to various growth narratives while managing sector-specific risks.
-
Institutional Investors: Conduct comprehensive due diligence on protocol mechanics, team credentials, audit reports, and regulatory compliance frameworks. Consider staged allocation strategies that allow for position adjustment as market conditions and project developments evolve.
⚠️ Risk Warning: Cryptocurrency markets exhibit extreme volatility. This content does not constitute investment advice. Conduct independent research and consult qualified financial advisors before making investment decisions.
VII. FAQ
Q1: What is the fundamental difference between LAVA and AAVE?
LAVA is an emerging blockchain infrastructure protocol launched in July 2024 that coordinates traffic from AI agents, applications, and wallets across multiple blockchains, aggregating data providers based on speed and reliability. AAVE, operational since 2020, is an established decentralized lending protocol offering deposit and lending services with algorithmically determined interest rates. The core distinction lies in their functionality: LAVA focuses on cross-chain data coordination and AI agent infrastructure, while AAVE specializes in DeFi lending markets.
Q2: Which asset exhibits higher price volatility?
LAVA demonstrates significantly higher price volatility. Since its launch in 2024, LAVA experienced extreme fluctuations, declining from its all-time high of 0.26114 USD (December 2025) to an all-time low of 0.008 USD (January 2025) within approximately one month—representing over 96% decline. AAVE, while having declined from its historical peak of 661.69 USD, exhibits relatively more stable price movements characteristic of established protocols with longer operational histories and higher liquidity.
Q3: How do the trading volumes compare between LAVA and AAVE?
AAVE demonstrates substantially higher trading volume, recording 2,786,448.19 USD in 24-hour volume compared to LAVA's 335,385.02 USD as of January 20, 2026. This approximately 8x difference in trading volume indicates AAVE's greater market liquidity, which typically results in reduced slippage during transactions and more efficient price discovery. Higher liquidity generally benefits investors by facilitating easier entry and exit positions without significant price impact.
Q4: What are the projected price ranges for 2030?
Based on predictive models, LAVA's base scenario projects a price range of 0.0956-0.1427 USD in 2030, with an optimistic scenario extending to 0.1427-0.1955 USD. AAVE's base scenario forecasts 142.07-197.32 USD in 2030, with an optimistic scenario reaching 197.32-232.84 USD. These projections suggest AAVE maintaining significantly higher absolute price levels, while LAVA potentially offers higher percentage returns from current levels, albeit with substantially greater uncertainty given its limited operational history.
Q5: What risk factors should investors consider when choosing between LAVA and AAVE?
LAVA's primary risks include extreme price volatility, limited operational history (launched in 2024), lower liquidity leading to potential slippage, scalability challenges inherent to multi-chain coordination systems, and uncertain regulatory classification for emerging infrastructure protocols. AAVE's risks encompass smart contract vulnerabilities common to DeFi protocols, oracle manipulation possibilities, liquidation cascade scenarios during market stress, and increasing regulatory scrutiny of decentralized lending platforms. Both assets face broader cryptocurrency market risks including macroeconomic conditions and evolving global regulatory frameworks.
Q6: Which asset is more suitable for conservative investors?
AAVE is generally more suitable for conservative cryptocurrency investors seeking exposure to established protocols. Its operational history since 2020 provides more extensive market data for analysis, higher trading volume offers better liquidity, and its position as a leading DeFi protocol indicates proven market acceptance. However, conservative investors should maintain that even established crypto assets carry substantial volatility compared to traditional financial instruments, and any crypto allocation should represent only a portion of diversified portfolios appropriate to individual risk tolerance.
Q7: How do institutional adoption levels differ between LAVA and AAVE?
Based on available information, specific comparative data on institutional holdings and enterprise adoption between LAVA and AAVE cannot be definitively established from the reference materials. Generally, AAVE's longer operational history and established position in DeFi lending suggests potentially broader institutional recognition, while LAVA's recent launch means institutional adoption patterns are still developing. Investors interested in institutional adoption metrics should conduct independent research into custody solutions, institutional trading desks, and protocol audit reports for both assets.
Q8: What allocation strategy balances exposure to both assets?
Conservative investors might consider a 10-20% LAVA and 80-90% AAVE allocation, emphasizing established protocol exposure while maintaining limited participation in emerging infrastructure projects. Aggressive investors seeking higher risk-return profiles might adopt a 40-50% LAVA and 50-60% AAVE allocation, balancing established DeFi exposure with higher-risk infrastructure opportunities. All allocation strategies should incorporate appropriate hedging tools including stablecoin reserves for liquidity management, consider options strategies for downside protection, and maintain diversification across different cryptocurrency sectors beyond just these two assets.
* The information is not intended to be and does not constitute financial advice or any other recommendation of any sort offered or endorsed by Gate.