This comprehensive analysis compares LEO and THETA blockchain tokens to help investors evaluate their 2024 investment potential. LEO, the iFinex exchange ecosystem token ranked 19th by market cap ($8.36B), demonstrates relative stability with prices projected between $6.07-$24.31 through 2031. THETA, a decentralized video streaming infrastructure token, exhibits higher volatility but shows elevated trading activity. The article examines historical price performance, tokenomics, institutional adoption, and risk factors for both tokens. Readers gain data-driven insights into price forecasting, portfolio allocation strategies ranging from conservative (60% LEO/40% THETA) to aggressive positions, and crucial risk considerations. Whether you're a new, experienced, or institutional investor, this guide provides actionable frameworks for informed decision-making on Gate and understanding which token aligns better with your risk tolerance and investment objectives.
Introduction: Investment Value, Price Prediction, and Risk Analysis of LEO
In the cryptocurrency market, platform tokens have emerged as a distinctive category of digital assets, with LEO (UNUS SED LEO) representing a notable example within the iFinex ecosystem. Since its launch in 2019, LEO has positioned itself as a utility token designed to provide immediate benefits to users of iFinex's trading platforms, products, and services.
LEO was issued by Unus Sed Leo Limited, a subsidiary of iFinex, which operates the Bitfinex exchange. The token was introduced through an Initial Exchange Offering (IEO) with an initial purchase price of 1 USDT per token, aiming to raise $1 billion. As of January 13, 2026, LEO ranks 19th by market capitalization, with a circulating supply of approximately 921.69 million tokens out of a total supply of 985.24 million tokens.
This article provides a comprehensive analysis of LEO, examining multiple dimensions that influence its investment potential:
Historical price performance and market trends
Supply mechanism and tokenomics structure
Ecosystem integration and utility functions
Market position and trading dynamics
Risk factors and considerations for investors
With LEO's current price at $9.075 and a market capitalization exceeding $8.36 billion, understanding its value proposition requires examining both its role within the iFinex ecosystem and its performance characteristics in the broader cryptocurrency market. This analysis aims to provide investors with objective insights into LEO's investment profile, helping them make informed decisions based on data and observable market patterns.
I. Historical Price Comparison and Current Market Status
- 2021: LEO demonstrated resilience during market volatility, while THETA reached its all-time high of $15.72 in April 2021, driven by strong momentum in the decentralized video streaming sector.
- 2020: THETA recorded its historical low of $0.04039979 on March 13, 2020, during the broader market downturn, whereas LEO maintained relative stability following its initial launch period.
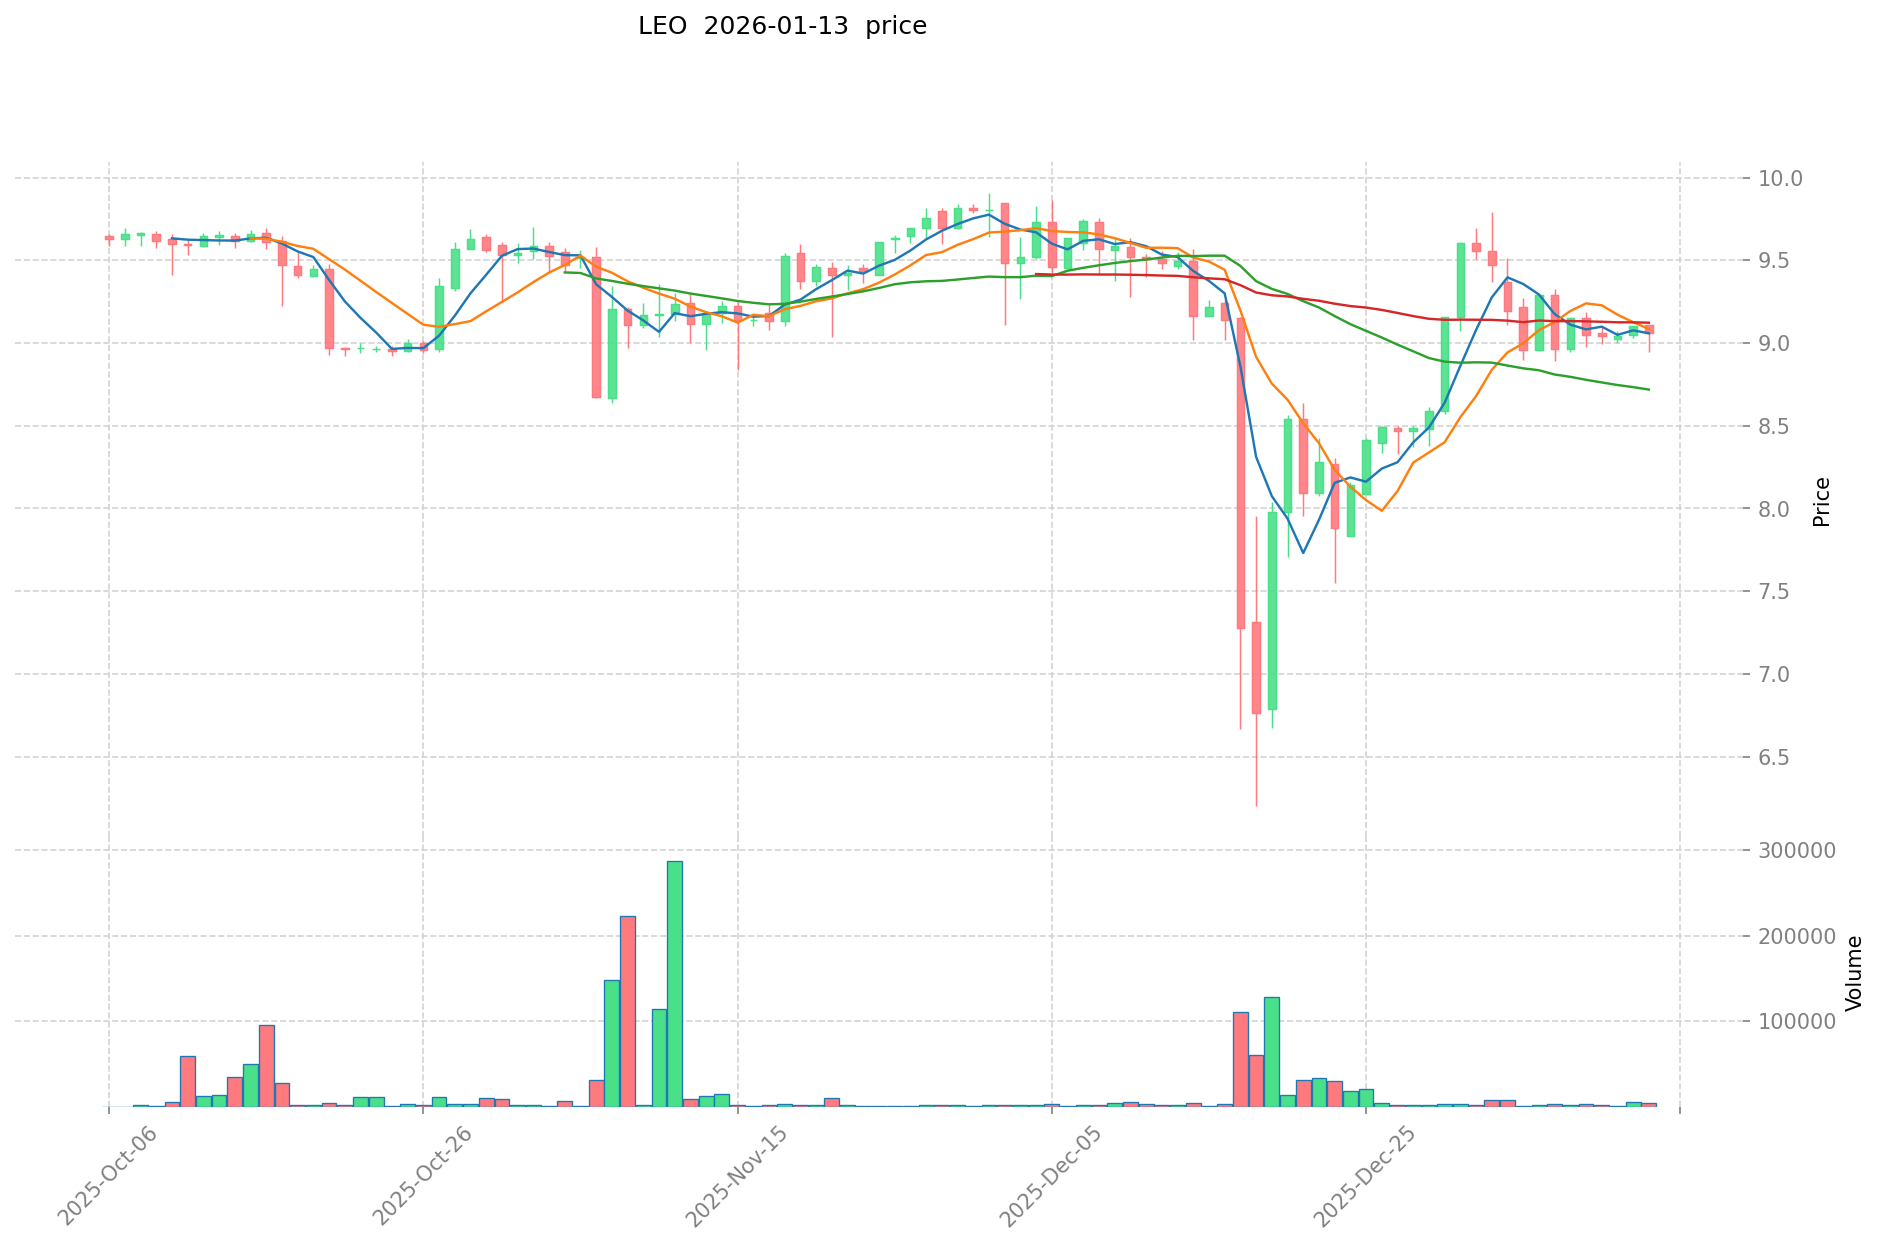
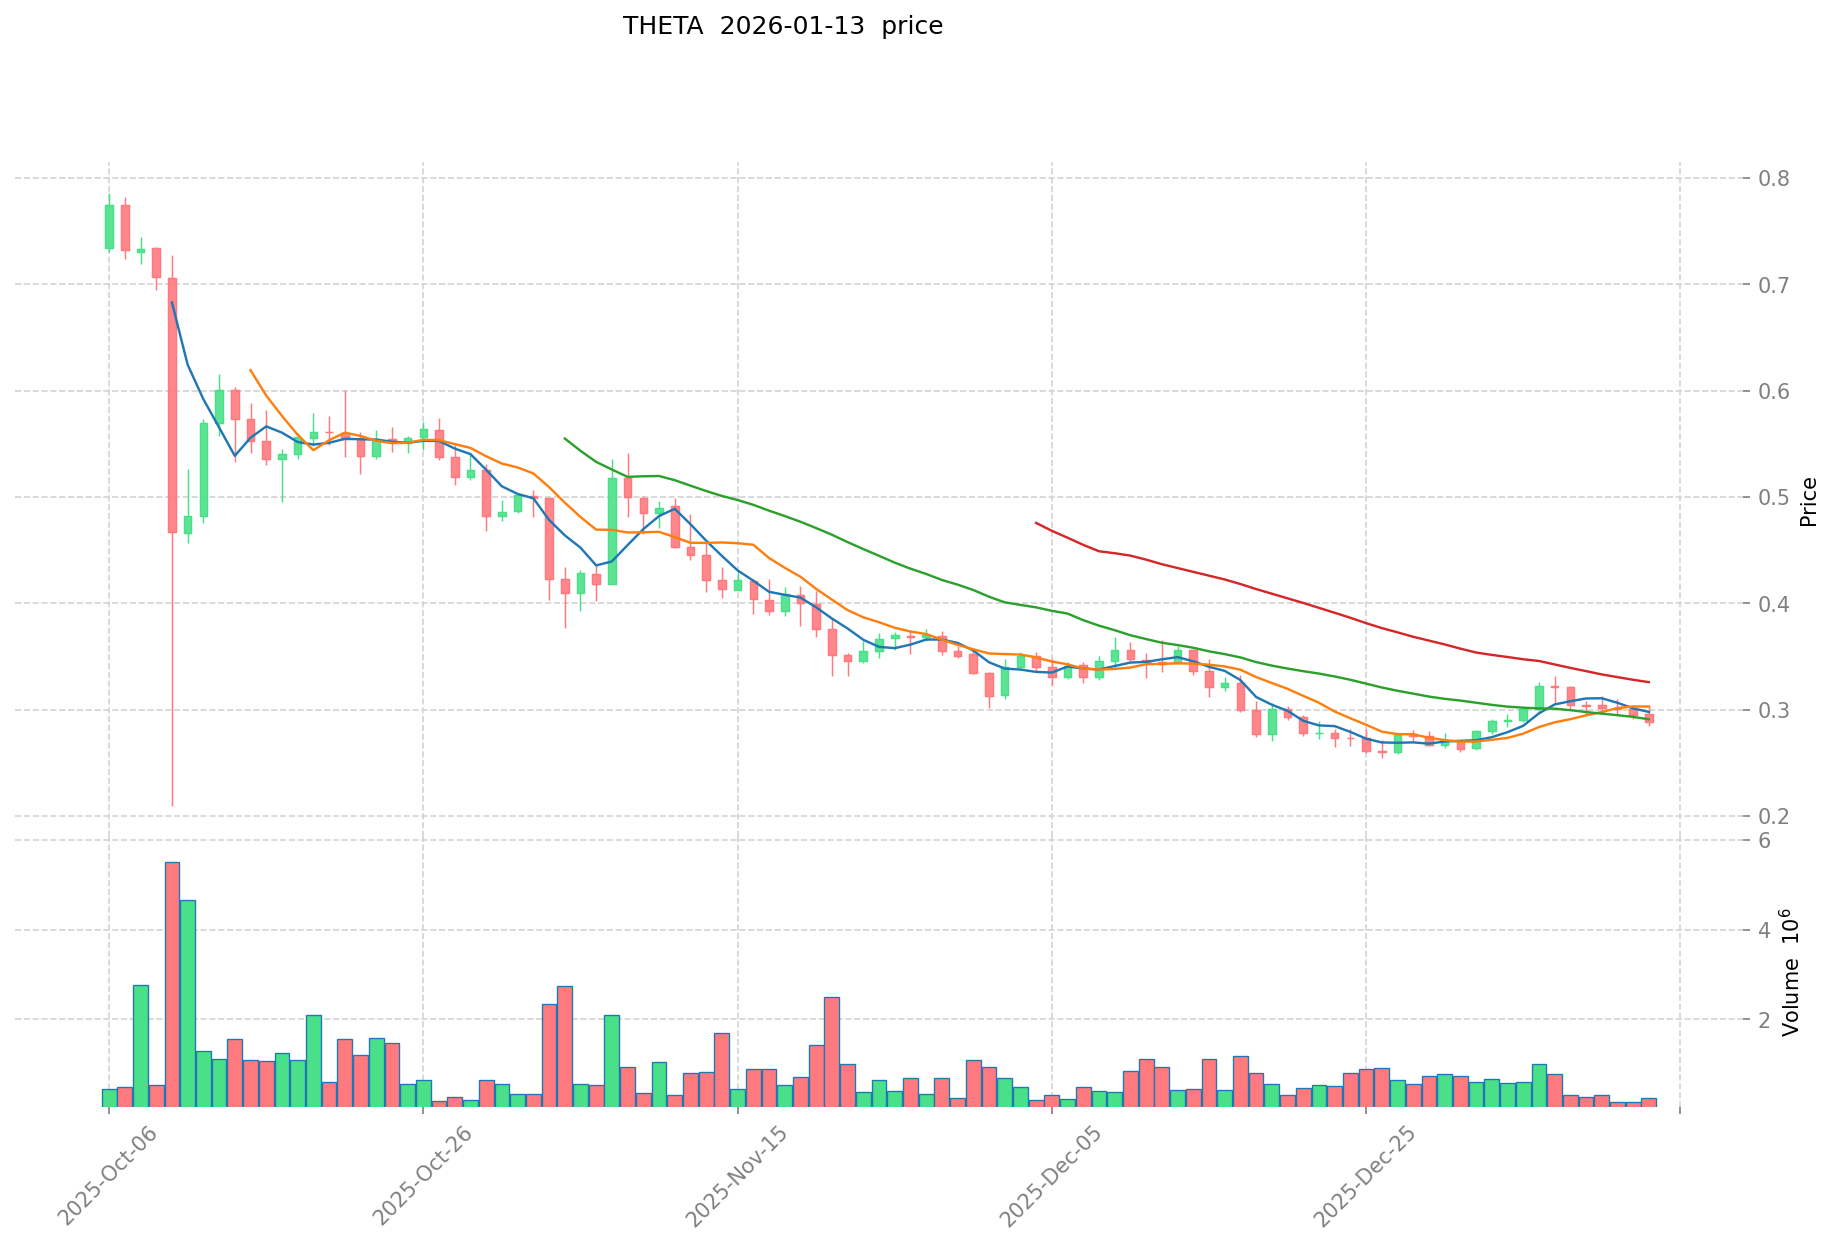
- Comparative Analysis: During the crypto market cycle from 2021 to 2026, LEO declined from its historical high of $10.14 to the current level, experiencing a relatively modest drawdown. In contrast, THETA experienced a more substantial correction, declining from its peak of $15.72 and showing an 85.96% decrease over the past year, reflecting heightened volatility in the video streaming blockchain segment.
Current Market Conditions (January 13, 2026)
- LEO Current Price: $9.075
- THETA Current Price: $0.2953
- 24-Hour Trading Volume: LEO recorded $19,459.19, while THETA registered $77,723.50, indicating notably higher trading activity for THETA despite its lower price point.
- Market Sentiment Index (Fear & Greed Index): 26 (Fear)
View Real-Time Prices:
II. Core Factors Influencing LEO vs THETA Investment Value
Supply Mechanism Comparison (Tokenomics)
- LEO: Information regarding LEO's specific supply mechanism is not available in the provided materials.
- THETA: Based on available data, Theta Network (THETA) shows projected annual growth rates, with 2027 estimates suggesting a price target of $0.3288 representing a cumulative return of approximately +5%. The materials reference calculation tools for investment returns but do not specify detailed supply mechanisms such as fixed supply, deflationary models, or halving schedules.
- 📌 Historical Pattern: Supply mechanisms may influence price cycles through scarcity dynamics, though specific historical data for these tokens is not provided in the reference materials.
Institutional Adoption and Market Application
- Institutional Holdings: The materials do not provide comparative data on institutional preference between LEO and THETA.
- Enterprise Adoption: Reference materials mention that LEO focuses on satellite data applications, while THETA operates as a blockchain network. However, specific information regarding cross-border payments, settlement systems, or institutional portfolio integration is not available for either token.
- National Policies: The materials do not contain specific information about regulatory attitudes toward LEO or THETA in different jurisdictions.
Technical Development and Ecosystem Construction
- LEO Technical Development: Materials indicate LEO centers on satellite data and imaging applications, though detailed technical upgrade information is not provided.
- THETA Technical Development: THETA is identified as a blockchain network with potential applications, though specific technical upgrade details are not available in the reference materials.
- Ecosystem Comparison: The materials do not provide detailed information about DeFi, NFT, payment systems, or smart contract implementation for either LEO or THETA.
Macroeconomic Environment and Market Cycles
- Performance in Inflationary Environment: The materials do not contain comparative analysis of anti-inflation properties for LEO versus THETA.
- Macroeconomic Monetary Policy: While materials reference market dynamics and options trading influenced by interest rates and volatility (using Greek letters like Delta and Theta in derivatives contexts), specific impacts of Federal Reserve policy, interest rates, or US Dollar Index movements on LEO and THETA tokens are not documented.
- Geopolitical Factors: Reference materials do not provide information about how cross-border transaction demand or international situations specifically affect LEO or THETA investment value.
III. 2026-2031 Price Forecasting: LEO vs THETA
Short-term Forecast (2026)
- LEO: Conservative $6.07-9.06 | Optimistic $9.06-13.05
- THETA: Conservative $0.18-0.30 | Optimistic $0.30-0.40
Mid-term Forecast (2028-2029)
- LEO may enter a consolidation phase with projected price range of $7.04-16.37
- THETA may enter an expansion phase with projected price range of $0.24-0.64
- Key drivers: institutional capital inflows, ETF developments, ecosystem expansion
Long-term Forecast (2030-2031)
- LEO: Baseline scenario $8.90-17.12 | Optimistic scenario $17.12-24.31
- THETA: Baseline scenario $0.51-0.63 | Optimistic scenario $0.63-0.71
View detailed price predictions for LEO and THETA
Disclaimer
LEO:
| Year |
Predicted High Price |
Predicted Average Price |
Predicted Low Price |
Price Change |
| 2026 |
13.0464 |
9.06 |
6.0702 |
0 |
| 2027 |
15.47448 |
11.0532 |
8.732028 |
21 |
| 2028 |
13.7943936 |
13.26384 |
11.937456 |
46 |
| 2029 |
16.370231328 |
13.5291168 |
7.035140736 |
49 |
| 2030 |
19.28507954256 |
14.949674064 |
13.30520991696 |
64 |
| 2031 |
24.3066750606576 |
17.11737680328 |
8.9010359377056 |
88 |
THETA:
| Year |
Predicted High Price |
Predicted Average Price |
Predicted Low Price |
Price Change |
| 2026 |
0.399195 |
0.2957 |
0.183334 |
0 |
| 2027 |
0.420411475 |
0.3474475 |
0.3335496 |
17 |
| 2028 |
0.52982269275 |
0.3839294875 |
0.23803628225 |
30 |
| 2029 |
0.63505776527375 |
0.456876090125 |
0.3929134375075 |
54 |
| 2030 |
0.715216675286181 |
0.545966927699375 |
0.529587919868393 |
84 |
| 2031 |
0.712568735686839 |
0.630591801492778 |
0.51077935920915 |
113 |
IV. Investment Strategy Comparison: LEO vs THETA
Long-term vs Short-term Investment Strategies
- LEO: May suit investors seeking exposure to exchange ecosystem tokens with relatively stable market positioning. The token shows moderate historical volatility compared to sector-specific tokens, with price movements from $6.07-$13.05 projected for 2026.
- THETA: May appeal to investors interested in blockchain infrastructure and video streaming applications, though the token exhibits higher volatility patterns. Short-term traders might consider THETA's elevated 24-hour trading volume of $77,723.50 compared to LEO's $19,459.19.
Risk Management and Asset Allocation
- Conservative Investors: A potential allocation framework could consider LEO 60% vs THETA 40%, given LEO's more established market position and lower historical volatility patterns.
- Aggressive Investors: A potential allocation framework could consider LEO 40% vs THETA 60%, reflecting higher risk tolerance for tokens with greater price movement potential.
- Hedging Tools: Portfolio diversification strategies may include stablecoin allocation for liquidity management, derivatives instruments where available, and cross-asset combinations to balance exposure.
V. Potential Risk Comparison
Market Risk
- LEO: Market sentiment currently reflects fear conditions (Fear & Greed Index: 26), which may impact price stability. The token's connection to the iFinex ecosystem means performance may correlate with exchange platform developments and trading activity patterns.
- THETA: The token demonstrated significant volatility, with an 85.96% decline over the past year. Market conditions in the decentralized video streaming sector may influence price movements, and the current fear sentiment environment could affect near-term performance.
Technical Risk
- LEO: Information regarding specific technical development risks, network scalability challenges, or infrastructure vulnerabilities is not available in the reference materials.
- THETA: As a blockchain network token, potential considerations may include network performance factors, though specific technical risk details are not provided in the available materials.
Regulatory Risk
- Global regulatory developments may affect both tokens differently based on their respective use cases. Exchange ecosystem tokens and blockchain infrastructure projects may face varying regulatory scrutiny across jurisdictions, though specific policy impacts are not detailed in the reference materials.
VI. Conclusion: Which Is the Better Buy?
📌 Investment Value Summary:
- LEO Characteristics: Demonstrates relatively stable market positioning within the exchange ecosystem segment, with a market capitalization exceeding $8.36 billion and ranking 19th overall. Price projections suggest moderate growth potential ranging from $6.07-$24.31 through 2031.
- THETA Characteristics: Operates in the blockchain infrastructure and video streaming sector with higher trading volume activity. Price forecasts indicate potential ranges from $0.18-$0.71 through 2031, though recent performance shows substantial volatility.
✅ Investment Considerations:
- New Investors: May consider starting with tokens showing more established market positions and lower volatility patterns. Understanding each token's ecosystem role and conducting thorough research before allocation decisions is advisable.
- Experienced Investors: Could evaluate portfolio diversification strategies incorporating both exchange ecosystem tokens and infrastructure projects, adjusting allocations based on risk tolerance and market outlook.
- Institutional Investors: May assess factors including liquidity profiles, market depth, regulatory clarity, and alignment with investment mandates when considering exposure to either token category.
⚠️ Risk Disclosure: Cryptocurrency markets exhibit high volatility and significant price fluctuation potential. This content does not constitute investment advice, financial guidance, or trading recommendations. Market conditions, regulatory environments, and token fundamentals may change materially. Investors should conduct independent research and consult qualified financial professionals before making investment decisions.
VII. FAQ
Q1: What is LEO and how does it differ from THETA in terms of use case?
LEO (UNUS SED LEO) is a utility token within the iFinex ecosystem, designed to provide benefits to users of Bitfinex exchange and related trading platforms. THETA, in contrast, operates as a blockchain network token focused on decentralized video streaming infrastructure. The fundamental difference lies in their operational domains: LEO functions primarily as an exchange ecosystem token with utility tied to trading platform services, while THETA serves blockchain infrastructure for video streaming applications. This distinction affects their market dynamics, adoption patterns, and price drivers.
Q2: Which token shows more price stability, LEO or THETA?
LEO demonstrates greater price stability compared to THETA. LEO maintained a relatively modest decline from its historical high of $10.14 to the current $9.075, while THETA experienced an 85.96% decrease over the past year from its peak of $15.72 to $0.2953. LEO's market positioning within the exchange ecosystem and higher market capitalization ($8.36 billion, ranked 19th) contribute to its relative stability. THETA's price volatility reflects the characteristics of sector-specific infrastructure tokens and market sentiment fluctuations in the decentralized video streaming segment.
Q3: What are the projected price ranges for LEO and THETA through 2031?
For LEO, conservative short-term projections (2026) range from $6.07-$9.06, while optimistic scenarios suggest $9.06-$13.05. Long-term forecasts (2030-2031) project a baseline scenario of $8.90-$17.12 and an optimistic scenario of $17.12-$24.31. For THETA, conservative 2026 projections range from $0.18-$0.30, with optimistic scenarios at $0.30-$0.40. Long-term forecasts (2030-2031) suggest a baseline of $0.51-$0.63 and optimistic scenarios of $0.63-$0.71. These projections reflect different growth trajectories based on each token's market position and ecosystem development potential.
Q4: How should investors approach portfolio allocation between LEO and THETA?
Portfolio allocation depends on risk tolerance levels. Conservative investors might consider a 60% LEO / 40% THETA allocation, reflecting LEO's more established market position and lower volatility patterns. Aggressive investors could opt for a 40% LEO / 60% THETA allocation, accepting higher risk for potentially greater returns from THETA's price movement potential. Both strategies should incorporate stablecoin allocation for liquidity management and consider derivatives instruments where available. The current market sentiment (Fear & Greed Index: 26) suggests cautious positioning regardless of allocation strategy.
Q5: What are the main risks associated with investing in LEO versus THETA?
LEO's primary risks include correlation with Bitfinex exchange performance and developments within the iFinex ecosystem. Market sentiment currently reflects fear conditions (Fear & Greed Index: 26), which may impact short-term price stability. THETA faces higher volatility risk, demonstrated by its 85.96% annual decline, and sector-specific challenges in the decentralized video streaming market. Both tokens face regulatory uncertainty as global policies toward exchange ecosystem tokens and blockchain infrastructure projects continue to evolve. Technical risks may exist for both tokens, though specific details regarding network scalability or infrastructure vulnerabilities are not fully documented.
Q6: Which token offers better trading liquidity?
Trading volume data indicates THETA demonstrates notably higher 24-hour trading activity at $77,723.50 compared to LEO's $19,459.19, suggesting better short-term liquidity for THETA despite its lower price point. However, LEO's significantly higher market capitalization ($8.36 billion versus THETA's lower valuation) and established exchange ecosystem positioning may provide different liquidity characteristics in various market conditions. Investors should consider both trading volume and market depth when assessing liquidity profiles for their specific trading or investment strategies.
* The information is not intended to be and does not constitute financial advice or any other recommendation of any sort offered or endorsed by Gate.