This comprehensive analysis compares LEVER and DOT as leading blockchain platforms for enterprise solutions. LEVER, launched in July 2022, operates as a DeFi leveraged trading platform across EVM Layer 1 networks including Avalanche and Arbitrum. DOT (Polkadot), established in May 2019, functions as cross-chain infrastructure connecting diverse blockchain ecosystems. The article examines historical price performance, current market status on Gate exchange, tokenomics, institutional adoption, and technological developments. Current market conditions show DOT with significantly higher liquidity ($4.6M daily volume) versus LEVER ($29K daily volume), with Fear & Greed Index at extreme fear levels. Investment recommendations differ by investor profile: conservative investors should favor DOT allocation (70-80%), while aggressive investors may consider balanced positioning (50-60% DOT, 40-50% LEVER). Long-term price projections through 2031 indicate potential growth of 55% for LEVER and 95% for DOT, though substant
Introduction: Investment Comparison Between LEVER and DOT
In the cryptocurrency market, the comparison between LEVER vs DOT has consistently been a topic that investors cannot avoid. Both exhibit significant differences in market cap ranking, application scenarios, and price performance, while representing distinct positioning within the crypto asset landscape.
LEVER (LEVER): Launched in July 2022, it positions itself as a DeFi leveraged trading platform, seamlessly integrating with other fundamental DeFi applications on high-speed, low-fee EVM Layer 1 networks such as Avalanche and Arbitrum.
DOT (DOT): Since its launch in May 2019, Polkadot has been recognized for its interoperability framework, connecting private chains, consortium chains, public chains, open networks, and oracles, making it one of the prominent cross-chain infrastructure projects in the global crypto space.
This article will comprehensively analyze the investment value comparison between LEVER vs DOT through historical price trends, supply mechanisms, institutional adoption, technological ecosystems, and future forecasts, attempting to answer investors' most pressing question:
"Which is the better buy right now?"
I. Historical Price Comparison and Current Market Status
LEVER and DOT Historical Price Trends
- 2022: LEVER experienced significant volatility following its token rebrand from RAMP to LeverFi at a 1:35 conversion ratio, with price reaching $0.00521513 in July 2022.
- 2021: DOT was influenced by parachain auction milestones and ecosystem expansion, with price reaching $54.98 in November 2021.
- Comparative Analysis: During the recent market cycle, LEVER declined from its peak of $0.00521513 to $0.00001124, while DOT decreased from $54.98 to $1.15.
Current Market Status (February 6, 2026)
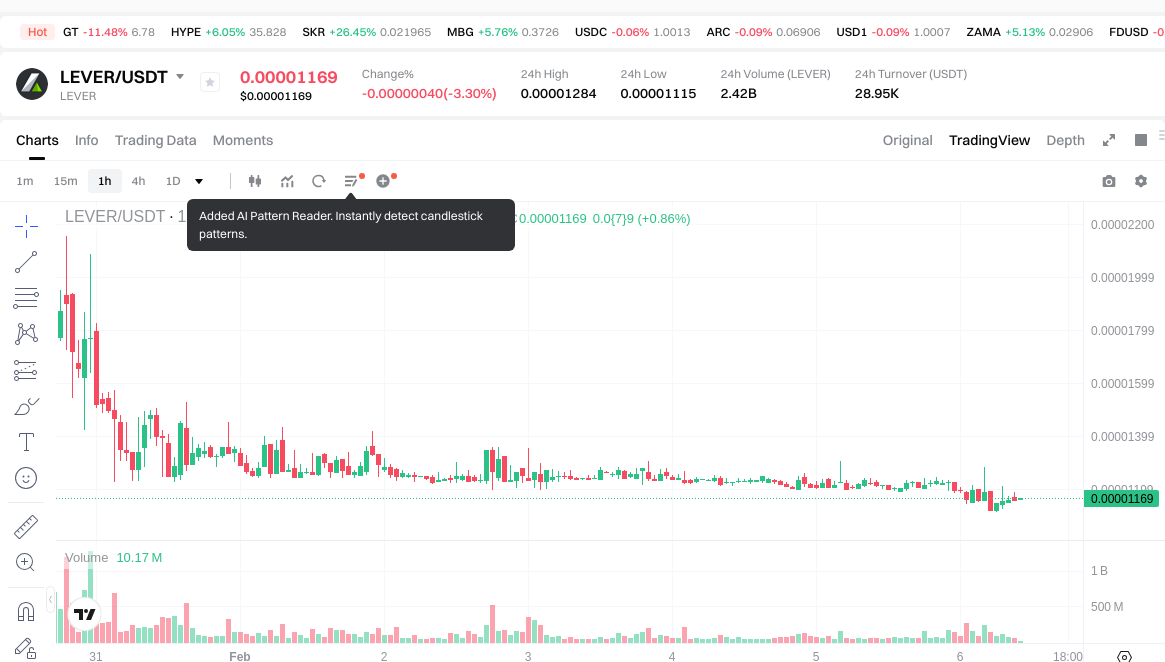
- LEVER Current Price: $0.00001159
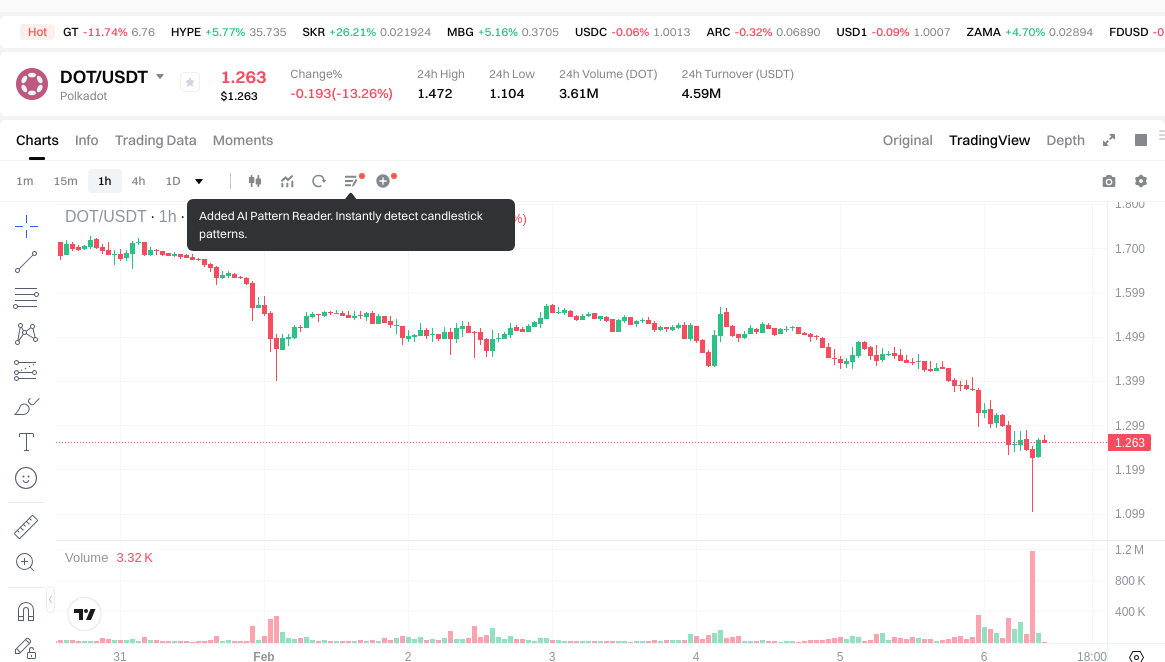
- DOT Current Price: $1.268
- 24-Hour Trading Volume: LEVER $29,024.39 vs DOT $4,597,692.01
- Market Sentiment Index (Fear & Greed Index): 9 (Extreme Fear)
View real-time prices:
- Check LEVER current price Market Price
- Check DOT current price Market Price
II. Core Factors Influencing LEVER vs DOT Investment Value
Supply Mechanism Comparison (Tokenomics)
- LEVER: Information regarding LEVER's supply mechanism is not available in the provided materials.
- DOT: Information regarding DOT's supply mechanism is not available in the provided materials.
- 📌 Historical Pattern: Supply mechanisms can influence price cycles through factors such as issuance schedules and token distribution models, though specific historical data for these assets is not provided.
Institutional Adoption and Market Application
- Institutional Holdings: Data on institutional preference between LEVER and DOT is not available in the provided materials.
- Enterprise Adoption: Information regarding LEVER/DOT applications in cross-border payments, settlement, or investment portfolios is not available in the provided materials.
- National Policy: Regulatory attitudes toward these assets across different jurisdictions are not covered in the provided materials.
Technological Development and Ecosystem Building
- LEVER Technical Upgrades: Specific technical development information is not available in the provided materials.
- DOT Technical Development: Specific technical development information is not available in the provided materials.
- Ecosystem Comparison: Information regarding DeFi, NFT, payment systems, and smart contract implementation for both assets is not available in the provided materials.
Macroeconomic Environment and Market Cycles
- Performance in Inflationary Environment: Analysis of anti-inflation properties for either asset is not available in the provided materials.
- Macroeconomic Monetary Policy: The impact of interest rates and US dollar index movements on both assets is not covered in the provided materials.
- Geopolitical Factors: Information regarding cross-border transaction demand and international situation impacts is not available in the provided materials.
According to available market data, both LEVER and DOT experience price volatility influenced by market sentiment, partnerships, regulatory developments, and technological advancements. The cryptocurrency market demonstrates high sensitivity to various factors including positive developments such as major collaborations, increased adoption rates, and favorable media coverage, which may drive demand. Conversely, negative news, security concerns, or regulatory actions may lead to price declines. Market participants should note that exchange rates for these assets fluctuate frequently due to continuous influence from global news, supply-demand dynamics, and market activity.
III. 2026-2031 Price Forecast: LEVER vs DOT
Short-term Forecast (2026)
- LEVER: Conservative 0.0000113393 - 0.00001169 | Optimistic 0.00001169 - 0.0000168336
- DOT: Conservative 1.11672 - 1.269 | Optimistic 1.269 - 1.72584
Mid-term Forecast (2028-2029)
- LEVER may enter a gradual accumulation phase, with estimated price range between 0.0000126074312 and 0.000016979984985
- DOT may enter a growth consolidation phase, with estimated price range between 1.318628052 and 2.48098086054
- Key drivers: institutional capital flows, ETF developments, ecosystem expansion
Long-term Forecast (2030-2031)
- LEVER: Base scenario 0.000012230620296 - 0.000017986206318 | Optimistic scenario 0.000017986206318 - 0.000019621315983
- DOT: Base scenario 1.654737441715449 - 2.4697573756947 | Optimistic scenario 2.4697573756947 - 2.766128260778064
View detailed price predictions for LEVER and DOT
Disclaimer
Price predictions are based on historical data analysis and market trends. Cryptocurrency markets are highly volatile and subject to various risks including regulatory changes, technological developments, and market sentiment shifts. These forecasts should not be considered as investment advice. Users should conduct independent research and consult with financial advisors before making investment decisions.
LEVER:
| Year |
Predicted High Price |
Predicted Average Price |
Predicted Low Price |
Price Change |
| 2026 |
0.0000168336 |
0.00001169 |
0.0000113393 |
0 |
| 2027 |
0.000015402744 |
0.0000142618 |
0.000007416136 |
23 |
| 2028 |
0.00001661214464 |
0.000014832272 |
0.0000126074312 |
27 |
| 2029 |
0.000016979984985 |
0.00001572220832 |
0.000014621653737 |
35 |
| 2030 |
0.000019621315983 |
0.000016351096652 |
0.000010464701857 |
41 |
| 2031 |
0.000019604964886 |
0.000017986206318 |
0.000012230620296 |
55 |
DOT:
| Year |
Predicted High Price |
Predicted Average Price |
Predicted Low Price |
Price Change |
| 2026 |
1.72584 |
1.269 |
1.11672 |
0 |
| 2027 |
2.0664396 |
1.49742 |
0.7936326 |
18 |
| 2028 |
2.156135058 |
1.7819298 |
1.318628052 |
40 |
| 2029 |
2.48098086054 |
1.969032429 |
1.1814194574 |
55 |
| 2030 |
2.7145081066194 |
2.22500664477 |
1.9580058473976 |
75 |
| 2031 |
2.766128260778064 |
2.4697573756947 |
1.654737441715449 |
95 |
IV. Investment Strategy Comparison: LEVER vs DOT
Long-term vs Short-term Investment Strategies
- LEVER: May be suitable for investors focusing on DeFi leveraged trading scenarios and seeking higher risk-reward opportunities in emerging platforms
- DOT: May be suitable for investors interested in cross-chain infrastructure development and ecosystem expansion potential
Risk Management and Asset Allocation
- Conservative Investors: LEVER 20-30% vs DOT 70-80%
- Aggressive Investors: LEVER 40-50% vs DOT 50-60%
- Hedging Tools: Stablecoin allocation, options strategies, cross-currency portfolio diversification
V. Potential Risk Comparison
Market Risk
- LEVER: The asset demonstrates considerable price volatility with 24-hour trading volume at $29,024.39, indicating relatively lower liquidity compared to more established cryptocurrencies. Market sentiment significantly influences price movements.
- DOT: While maintaining higher trading volume at $4,597,692.01, the asset remains subject to market sentiment fluctuations, with current Fear & Greed Index at 9 (Extreme Fear) indicating cautious market conditions.
Technical Risk
- LEVER: Scalability considerations and network stability factors associated with its integration across multiple EVM Layer 1 networks
- DOT: Infrastructure complexity related to cross-chain interoperability and consensus mechanism performance
Regulatory Risk
- Global regulatory developments may affect both assets differently, with DeFi platforms and cross-chain infrastructure potentially facing varying degrees of regulatory scrutiny across different jurisdictions
VI. Conclusion: Which Is the Better Buy?
📌 Investment Value Summary:
- LEVER Advantages: Positioned in the DeFi leveraged trading sector with integration capabilities across high-speed, low-fee EVM Layer 1 networks
- DOT Advantages: Established cross-chain infrastructure framework connecting various blockchain networks, with longer operational history since May 2019
✅ Investment Recommendations:
- Beginner Investors: Consider starting with DOT due to its more established market presence and higher liquidity, allocating smaller positions to manage exposure
- Experienced Investors: May evaluate portfolio diversification between both assets based on individual risk tolerance and market analysis, with careful attention to trading volume and price volatility patterns
- Institutional Investors: Conduct comprehensive due diligence on both assets' technological infrastructure, market positioning, and regulatory compliance before allocation decisions
⚠️ Risk Warning: Cryptocurrency markets exhibit significant volatility. This content does not constitute investment advice. Users should conduct independent research and consult with qualified financial advisors before making investment decisions.
VII. FAQ
Q1: What is the fundamental difference between LEVER and DOT in terms of their blockchain positioning?
LEVER is a DeFi leveraged trading platform that operates across multiple EVM Layer 1 networks like Avalanche and Arbitrum, focusing on decentralized margin trading services. DOT (Polkadot), on the other hand, is a cross-chain infrastructure protocol designed to connect various blockchain networks including private chains, consortium chains, public chains, and oracles. While LEVER serves a specific DeFi application niche launched in July 2022, DOT has been operating since May 2019 as a foundational interoperability framework enabling communication between different blockchain ecosystems.
Q2: How do the trading volumes and liquidity compare between LEVER and DOT?
As of February 6, 2026, DOT demonstrates significantly higher liquidity with a 24-hour trading volume of $4,597,692.01, while LEVER's 24-hour trading volume stands at $29,024.39. This represents approximately 158 times higher trading volume for DOT, indicating substantially greater market liquidity and potentially easier entry and exit points for investors. Higher trading volume generally correlates with reduced price slippage and more stable market conditions, which may be particularly relevant for investors executing larger trades.
Q3: What portfolio allocation strategy should conservative versus aggressive investors consider?
Conservative investors may consider a portfolio weighting of 70-80% DOT and 20-30% LEVER, prioritizing the more established asset with higher liquidity and longer operational history. Aggressive investors seeking higher risk-reward profiles may opt for a more balanced allocation of 50-60% DOT and 40-50% LEVER, acknowledging the higher volatility and growth potential associated with emerging DeFi platforms. Both strategies should incorporate hedging tools such as stablecoin allocations, options strategies, and cross-currency portfolio diversification to manage downside risk.
Q4: What are the projected price ranges for LEVER and DOT by 2031?
According to market analysis projections, LEVER's 2031 price range is forecasted between $0.000012230620296 (low scenario) and $0.000019604964886 (optimistic scenario), with an average prediction of $0.000017986206318. DOT's 2031 projections indicate a range between $1.654737441715449 (low scenario) and $2.766128260778064 (optimistic scenario), with an average forecast of $2.4697573756947. These projections represent potential cumulative growth of 55% for LEVER and 95% for DOT from 2026 baseline levels, though cryptocurrency price predictions remain subject to significant uncertainty.
Q5: What specific risks should investors evaluate before choosing between LEVER and DOT?
Investors should assess three primary risk categories: market risk, technical risk, and regulatory risk. Market risk differs significantly between the two assets, with LEVER exhibiting lower liquidity ($29,024.39 daily volume) and potentially higher price volatility compared to DOT's more established market presence. Technical risk involves LEVER's dependency on multiple EVM Layer 1 networks for scalability versus DOT's infrastructure complexity related to cross-chain interoperability. Regulatory risk may affect both assets differently, as DeFi platforms like LEVER and cross-chain infrastructure like DOT face varying degrees of regulatory scrutiny across different jurisdictions.
Q6: How did both assets perform during their respective historical peak periods?
LEVER reached its historical peak of $0.00521513 in July 2022 following its token rebrand from RAMP to LeverFi at a 1:35 conversion ratio, subsequently declining to $0.00001124 before recovering to current levels. DOT achieved its historical high of $54.98 in November 2021, driven by parachain auction milestones and ecosystem expansion, before decreasing to $1.15 and then recovering to $1.268. Both assets experienced significant retracements from their peaks, with LEVER declining approximately 99.78% and DOT declining approximately 97.69% from their respective historical highs, reflecting broader cryptocurrency market cycles.
Q7: What market conditions are currently influencing both LEVER and DOT prices?
As of February 6, 2026, the cryptocurrency market exhibits a Fear & Greed Index of 9, indicating "Extreme Fear" conditions affecting both assets. Market sentiment remains cautious due to various factors including regulatory developments, technological advancements, and macroeconomic conditions. Both LEVER and DOT demonstrate price sensitivity to positive developments such as major collaborations, increased adoption rates, and favorable media coverage, while negative news, security concerns, or regulatory actions may trigger price declines. Exchange rates for these assets fluctuate continuously based on global news, supply-demand dynamics, and overall market activity.
Q8: Which asset is more suitable for beginner investors entering the cryptocurrency market?
DOT may be more suitable for beginner investors due to its more established market presence since May 2019, significantly higher liquidity with $4.6 million in daily trading volume, and broader recognition within the cryptocurrency ecosystem as a cross-chain infrastructure project. Beginners should start with smaller position sizes to manage exposure and gain familiarity with cryptocurrency market dynamics. LEVER, while offering potential opportunities in the DeFi sector, presents higher volatility and lower liquidity that may be more challenging for investors without prior cryptocurrency trading experience to navigate effectively.
* The information is not intended to be and does not constitute financial advice or any other recommendation of any sort offered or endorsed by Gate.