This comprehensive analysis compares LINK and GMX, two distinct pillars of the DeFi ecosystem operating in different market segments. LINK, ranked #17 with a $9.34 billion market cap, serves as critical oracle infrastructure enabling smart contracts to access off-chain data across multiple protocols. GMX, ranked #396 with $82.08 million market cap, functions as a decentralized derivatives trading platform generating revenue through trading fees, with 30% distributed to staked token holders. The article examines historical price trends revealing LINK's decline from $52.7 to $13.194 and GMX's volatility from $91.07 to $7.914, analyzes tokenomics mechanisms and institutional adoption rates, presents technical ecosystem comparisons between oracle networks and derivatives DEX architecture, outlines risk assessments covering market, technical, and regulatory dimensions, and provides investment allocation strategies differentiated by investor risk profiles. Price predictions through 2031 suggest varied growth trajec
Introduction: Investment Comparison Between LINK and GMX
In the cryptocurrency market, the comparison of LINK vs GMX has consistently been a topic that investors cannot overlook. Both assets exhibit notable differences in market cap ranking, application scenarios, and price performance, representing distinct positioning within the crypto asset landscape.
LINK (LINK): Launched in 2017, it has gained market recognition through its positioning as an ERC20 standardized token that facilitates payments to Chainlink node operators for retrieving off-chain data, formatting data into blockchain-readable formats, off-chain computation, and ensuring uptime.
GMX (GMX): Emerging as a decentralized perpetual exchange platform, GMX token serves as both a utility and governance token, while also accruing 30% of platform-generated fees.
This article will comprehensively analyze the investment value comparison between LINK vs GMX through historical price trends, supply mechanisms, institutional adoption, technical ecosystems, and future predictions, attempting to address the question investors care about most:
"Which is the better buy right now?"
I. Historical Price Comparison and Current Market Status
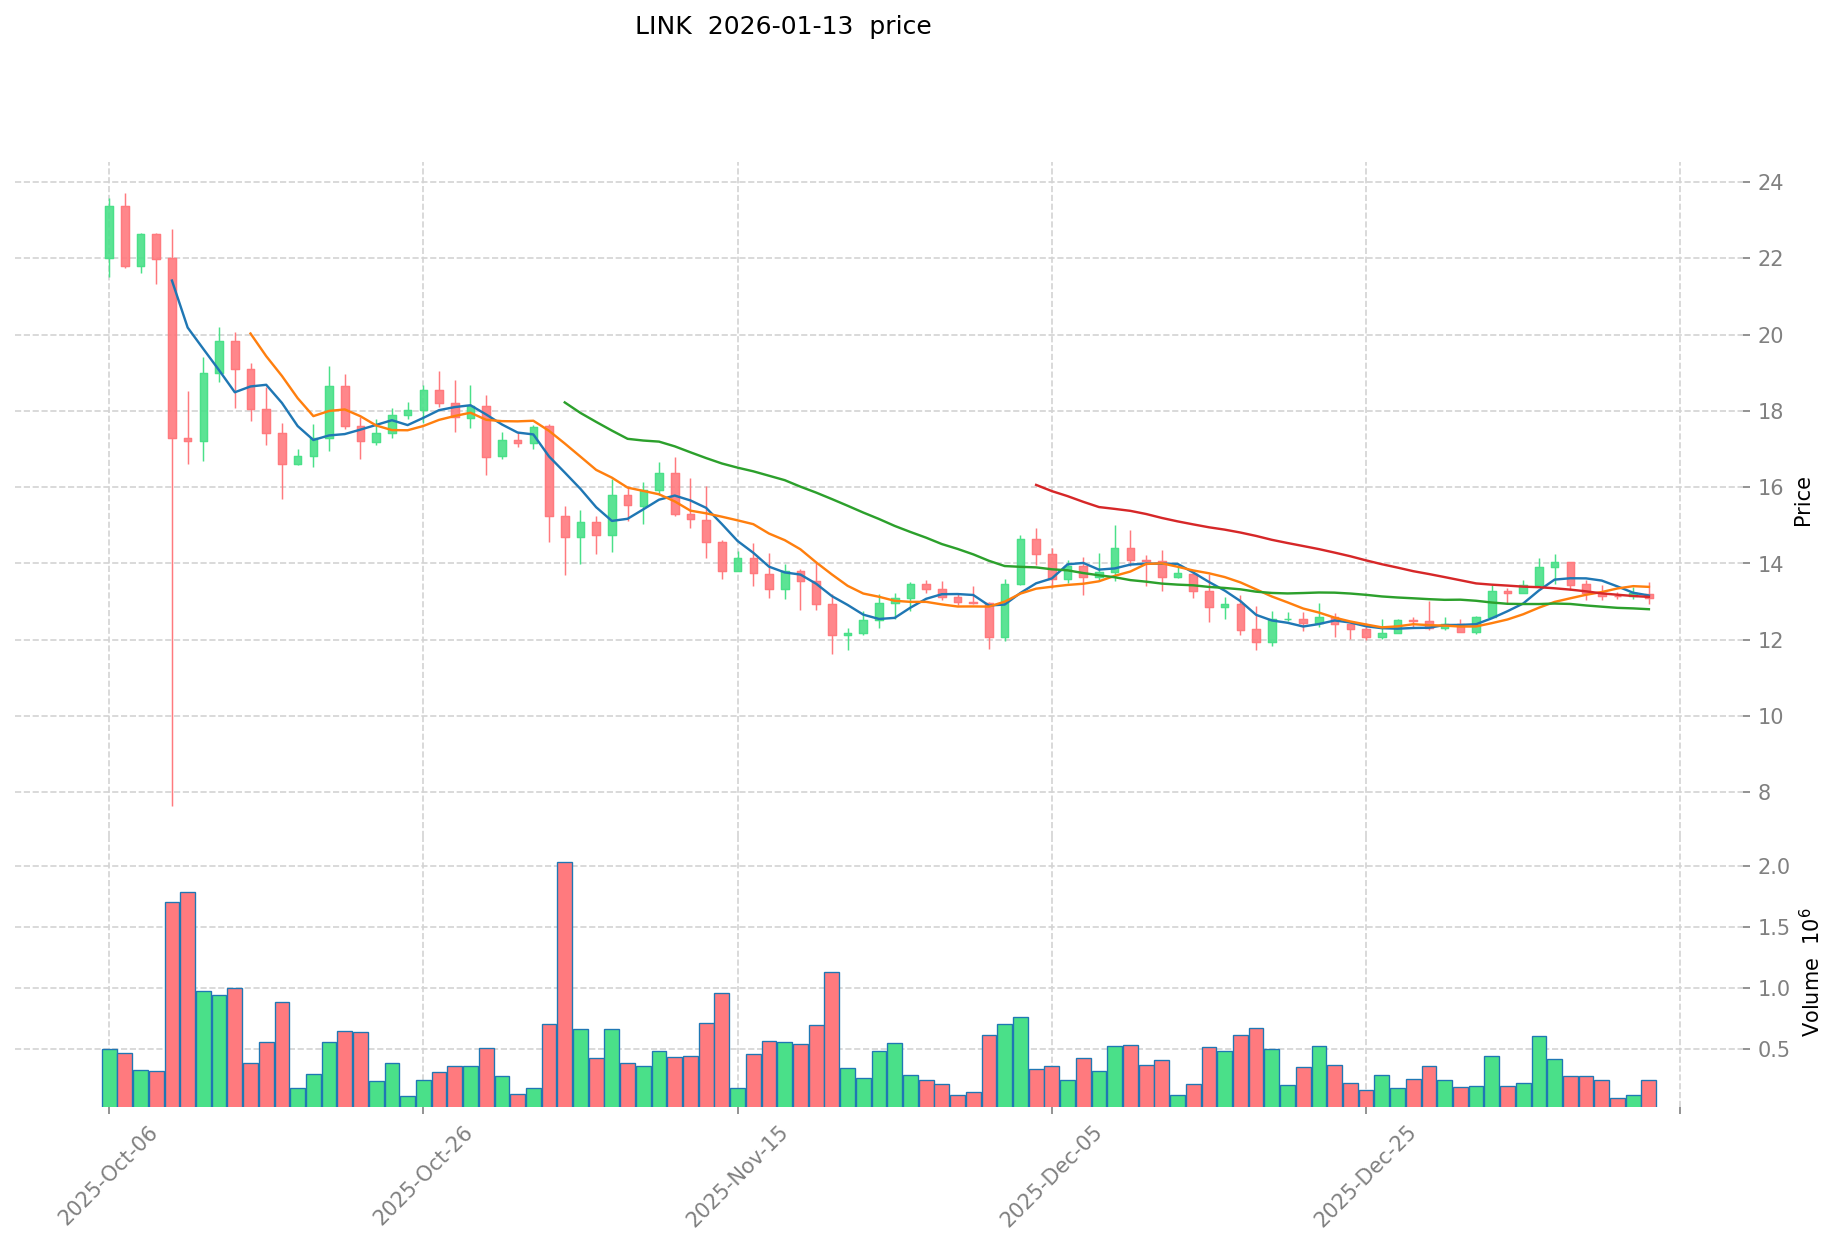
LINK (Coin A) and GMX (Coin B) Historical Price Trends
- 2021: LINK experienced notable price movements, with its price reaching $52.7 in May 2021, reflecting strong market momentum during that period.
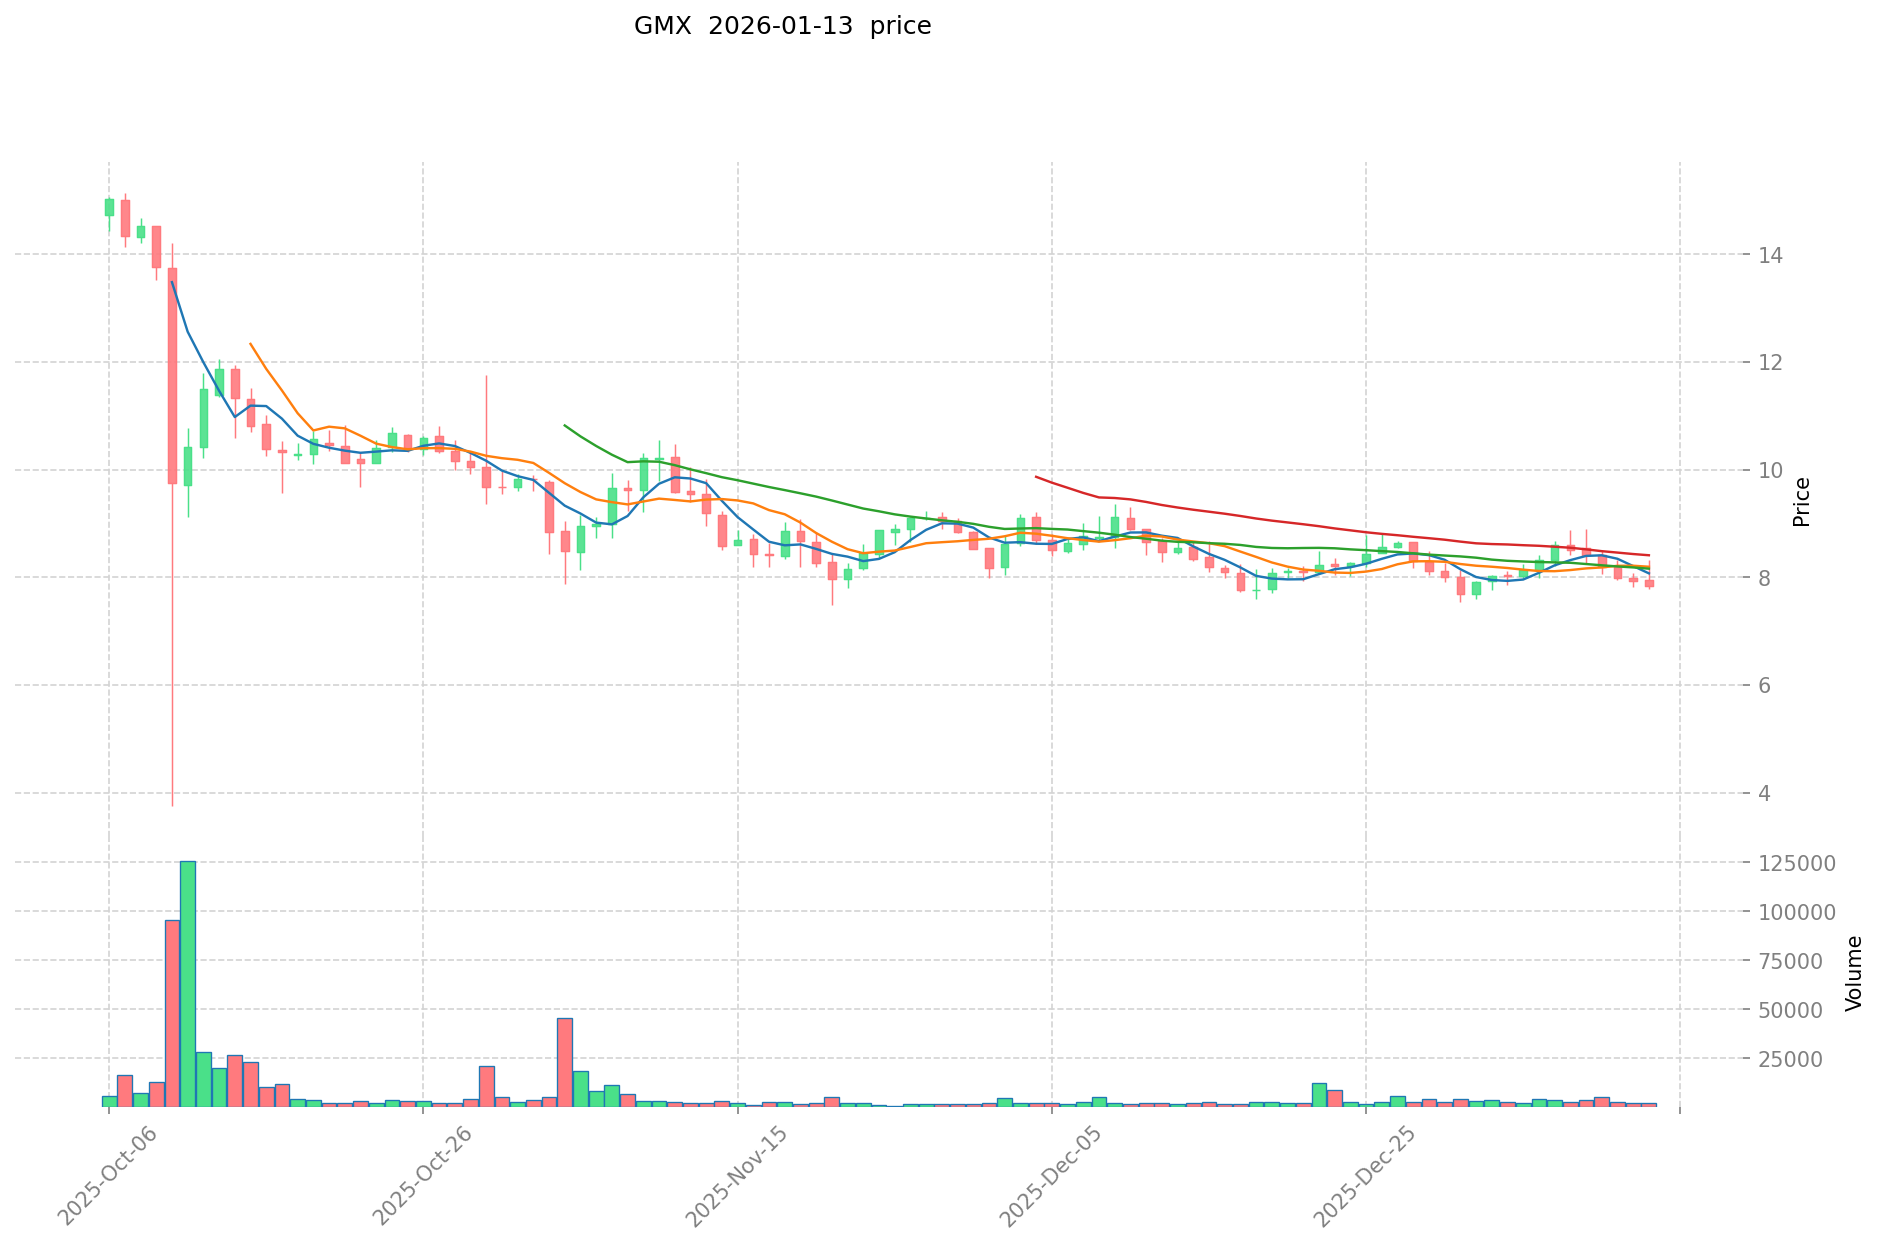
- 2023: GMX reached a peak price of $91.07 in April 2023, marking a significant milestone for the decentralized perpetual exchange token.
- 2025: GMX recorded its lowest price point at $6.92 in October 2025, demonstrating considerable volatility in the decentralized derivatives exchange sector.
- Comparative analysis: During the 2021-2026 market cycles, LINK declined from its peak of $52.7 to the current level of $13.194, representing a substantial correction. GMX experienced even greater volatility, declining from its high of $91.07 to approximately $7.914.
Current Market Status (2026-01-13)
- LINK current price: $13.194
- GMX current price: $7.914
- 24-hour trading volume: LINK $2.56 billion vs GMX $16,626.90
- Market capitalization: LINK $9.34 billion vs GMX $82.08 million
- LINK market ranking: #17
- GMX market ranking: #396
- Market Sentiment Index (Fear & Greed Index): 26 (Fear)
View real-time prices:
II. Core Factors Influencing LINK vs GMX Investment Value
Tokenomics Comparison
-
LINK: The token operates within Chainlink's decentralized oracle network, where supply dynamics are tied to node operator incentives and staking mechanisms. LINK tokens are used to compensate data providers and secure the network through collateral requirements.
-
GMX: The tokenomics include dual-token mechanisms (GMX and GLP). GMX has a fixed supply structure with specific allocations: 45.28% for XVIX and Gambit migration, 15.09% each for floor price fund, reserves, and liquidity, 7.55% for presale, and 1.89% for marketing. The protocol implements buyback and burn mechanisms when floor price conditions are met.
-
📌 Historical Pattern: GMX's fee distribution model (30% of trading fees converted to ETH/AVAX for staked GMX holders) creates a direct value accrual mechanism. The floor price fund mechanism provides downside protection through potential buybacks, establishing a minimum price floor in ETH and GLP terms.
Institutional Adoption and Market Application
-
Institutional Holdings: GMX has attracted attention from DeFi-focused investors due to its revenue-generating capabilities. The protocol ranks among top dApps by revenue, with semi-annual income reaching $18 million and competing closely with established platforms like dYdX.
-
Enterprise Adoption:
- LINK: Value derives from demand for decentralized oracle services across DeFi protocols. GMX itself utilizes Chainlink price feeds for accurate position pricing and liquidation calculations.
- GMX: Functions as a decentralized derivatives trading platform with low fees (0.1% position management fee) and leverage trading capabilities. The platform has generated trading volumes exceeding tens of billions of dollars.
-
Regulatory Environment: Both projects operate within the evolving DeFi regulatory landscape. GMX's anonymous team structure and protocol parameters require careful consideration of securities framework implications, particularly regarding synthetic asset expansion.
Technology Development and Ecosystem Building
-
LINK Technology: Powers Chainlink's oracle network, providing reliable price feeds with deviation thresholds. The technology enables precise position pricing and liquidation point calculations for protocols like GMX.
-
GMX Technology Evolution:
- V1 features: Trading fees, borrowing fees (hourly rate based on utilization), no funding rates
- V2 upgrades: Enhanced security and balance mechanisms, adjusted fee models including funding rates and price impact fees, isolated pool mode introduction, synthetic asset additions
- GLP pool mechanism: Multi-asset pool supporting leverage trading, where LP providers act as counterparties to traders
-
Ecosystem Comparison:
- GMX ecosystem: Built on Arbitrum and Avalanche, TVL reached $560M, significantly exceeding other derivative DEX protocols. The platform supports major cryptocurrencies including wBTC, ETH, LINK, UNI, and stablecoins.
- Integration capabilities: GMX V2 allows permissionless asset listings (though currently managed strategically), expanding tradable asset potential including stocks, commodities, and possibly fiat currencies.
Macroeconomic and Market Cycle Factors
-
Performance in Inflationary Environments: Both tokens exhibit volatility characteristics. GMX's revenue-generating mechanism through trading fees may provide some stability during market uncertainty, while LINK's value correlates with overall DeFi activity and oracle service demand.
-
Monetary Policy Impact: Interest rate changes and USD index fluctuations affect crypto market liquidity broadly. GMX's fee distribution in ETH/AVAX creates exposure to these base layer assets, while staking rewards of 43M+ annual fees for validators demonstrate income potential under current activity levels.
-
Geopolitical Factors: Increasing regulatory scrutiny on centralized exchanges (exemplified by FTX collapse, SEC investigations of major platforms) has driven demand toward decentralized alternatives. GMX benefits from this trend as derivative trading on DEXs represents only 3% of total derivatives volume, indicating significant growth potential despite CEX dominance of 97% market share.
III. 2026-2031 Price Prediction: LINK vs GMX
Short-term Forecast (2026)
- LINK: Conservative $12.43-$13.22 | Optimistic $13.22-$17.45
- GMX: Conservative $4.45-$7.94 | Optimistic $7.94-$10.80
Mid-term Forecast (2028-2029)
- LINK may enter a consolidation phase with estimated price range of $14.35-$21.71
- GMX may enter a growth phase with estimated price range of $9.92-$13.55
- Key drivers: institutional capital inflows, ETF developments, ecosystem expansion
Long-term Forecast (2030-2031)
- LINK: Baseline scenario $16.37-$25.16 | Optimistic scenario $20.47-$27.01
- GMX: Baseline scenario $10.64-$20.38 | Optimistic scenario $12.82-$17.82
View detailed price predictions for LINK and GMX
Disclaimer
LINK:
| Year |
Predicted High Price |
Predicted Average Price |
Predicted Low Price |
Price Change |
| 2026 |
17.44908 |
13.219 |
12.42586 |
0 |
| 2027 |
20.0875924 |
15.33404 |
13.4939552 |
16 |
| 2028 |
20.721654954 |
17.7108162 |
14.345761122 |
34 |
| 2029 |
21.71434620201 |
19.216235577 |
9.80028014427 |
45 |
| 2030 |
27.0141839741466 |
20.465290889505 |
16.372232711604 |
55 |
| 2031 |
25.164121677735348 |
23.7397374318258 |
19.703982068415414 |
79 |
GMX:
| Year |
Predicted High Price |
Predicted Average Price |
Predicted Low Price |
Price Change |
| 2026 |
10.79704 |
7.939 |
4.44584 |
0 |
| 2027 |
12.9278676 |
9.36802 |
6.1828932 |
18 |
| 2028 |
13.043094246 |
11.1479438 |
9.921669982 |
40 |
| 2029 |
13.54698130576 |
12.095519023 |
10.40214635978 |
52 |
| 2030 |
17.8215377284882 |
12.82125016438 |
10.6416376364354 |
62 |
| 2031 |
20.377453948757353 |
15.3213939464341 |
13.942468491255031 |
93 |
IV. Investment Strategy Comparison: LINK vs GMX
Long-term vs Short-term Investment Strategies
-
LINK: Suitable for investors focused on oracle infrastructure adoption and DeFi ecosystem growth. The token benefits from widespread integration across blockchain protocols requiring off-chain data feeds. Long-term holders may consider LINK's positioning as critical infrastructure for smart contract functionality, with value appreciation tied to expanding oracle service demand.
-
GMX: Suitable for investors seeking exposure to decentralized derivatives trading growth and revenue-generating mechanisms. The platform's fee distribution model (30% of trading fees to staked GMX holders) creates income potential. Short to mid-term traders may capitalize on volatility, while long-term holders can benefit from protocol revenue accrual and potential market share gains in the derivatives DEX sector.
Risk Management and Asset Allocation
-
Conservative Investors: LINK 60% vs GMX 40%. This allocation emphasizes LINK's established market position (#17 ranking) and broader institutional recognition, while maintaining measured exposure to GMX's higher-risk, higher-reward profile.
-
Aggressive Investors: LINK 40% vs GMX 60%. This strategy increases exposure to GMX's growth potential in the emerging derivatives DEX market, accepting higher volatility in exchange for revenue participation and possible market expansion gains.
-
Hedging Tools: Stablecoin allocation (20-30% of portfolio), options strategies for downside protection, cross-asset diversification including established cryptocurrencies. GMX's GLP pool mechanism itself functions as a multi-asset exposure vehicle, providing built-in diversification across wBTC, ETH, and stablecoins.
V. Potential Risk Comparison
Market Risks
-
LINK: Faces correlation risk with overall DeFi market sentiment. Declining DeFi protocol usage reduces oracle service demand, directly impacting LINK token utility. Competition from alternative oracle solutions (Band Protocol, API3) may pressure market share. The significant decline from $52.7 peak to current $13.194 demonstrates susceptibility to broader market corrections.
-
GMX: Exhibits heightened volatility evidenced by the decline from $91.07 to current $7.914 levels. Trading volume concentration risk exists, as platform sustainability depends on maintaining sufficient derivative trading activity. Competition from established centralized exchanges (controlling 97% of derivatives volume) and other DEX protocols (dYdX, Perpetual Protocol) presents market share challenges. Lower liquidity compared to LINK ($16,626.90 vs $2.56 billion 24h volume) increases price impact risk.
Technical Risks
-
LINK: Network scalability considerations as oracle request volumes increase. Node operator reliability and geographic distribution affect service uptime. Smart contract vulnerabilities in Chainlink protocol could impact data feed accuracy. Dependency on multiple blockchain networks creates cross-chain technical complexity.
-
GMX: Smart contract risk in V2 upgrade implementation, particularly regarding new synthetic asset additions and isolated pool mechanisms. GLP pool imbalance risks where excessive one-sided trading positions could create liquidity provider losses. Anonymous team structure raises governance and accountability considerations. Technical dependencies on underlying chains (Arbitrum, Avalanche) create infrastructure risk exposure. Price oracle dependency (ironically on Chainlink) creates systemic linkages.
Regulatory Risks
-
Divergent regulatory frameworks may affect LINK and GMX differently. LINK's oracle services face less direct regulatory scrutiny compared to GMX's derivatives trading platform.
-
GMX encounters potential classification challenges under securities regulations, particularly regarding synthetic asset offerings and revenue distribution mechanisms. Anonymous team structure may complicate regulatory compliance efforts.
-
Increasing scrutiny on decentralized finance protocols globally could impact operational parameters, geographic restrictions, or require KYC/AML implementations affecting user adoption.
-
LINK benefits from clearer utility classification as infrastructure service provider, though staking mechanisms may attract regulatory attention regarding securities characteristics.
VI. Conclusion: Which Is the Better Buy?
📌 Investment Value Summary:
-
LINK Advantages: Established market position with #17 ranking and $9.34 billion market capitalization. Critical infrastructure role in DeFi ecosystem with widespread protocol integration. Higher liquidity ($2.56 billion 24h volume) facilitates entry/exit flexibility. Clearer regulatory positioning as utility token for oracle services. More conservative risk profile suitable for portfolio core holdings.
-
GMX Advantages: Revenue-generating mechanism through fee distribution creates income potential for staked holders. Significant growth runway given derivatives DEX represent only 3% of total derivatives market. V2 technical upgrades expand tradable asset capabilities including synthetic products. Strong historical revenue performance ($18M semi-annually) demonstrates protocol viability. Floor price fund mechanism provides downside protection structure.
✅ Investment Recommendations:
-
New Investors: Consider prioritizing LINK for initial cryptocurrency derivatives exposure due to lower volatility, higher liquidity, and established market presence. Allocate smaller portion (10-20%) to GMX for growth exposure while developing understanding of derivatives DEX mechanics. Utilize dollar-cost averaging to mitigate entry timing risk.
-
Experienced Investors: Implement diversified allocation based on risk tolerance and market outlook. LINK provides stable infrastructure exposure, while GMX offers tactical opportunities in emerging derivatives DEX sector. Consider GMX staking for revenue generation during accumulation phases. Monitor protocol metrics (TVL, trading volume, fee generation) for position adjustment signals.
-
Institutional Investors: LINK offers more suitable profile for larger capital deployment given superior liquidity and established institutional recognition. GMX allocation should consider lock-up periods, staking mechanisms, and protocol governance participation opportunities. Due diligence should emphasize smart contract audits, team transparency, and regulatory compliance frameworks.
⚠️ Risk Warning: Cryptocurrency markets exhibit extreme volatility. This analysis does not constitute investment advice. Conduct independent research and consult qualified financial advisors before making investment decisions.
VII. FAQ
Q1: What is the primary difference between LINK and GMX in terms of utility and value proposition?
LINK serves as infrastructure for decentralized oracle services, while GMX functions as a revenue-generating derivatives trading platform. LINK tokens are used to compensate node operators for providing off-chain data feeds to smart contracts, making it essential infrastructure for the broader DeFi ecosystem. GMX, in contrast, operates as both a utility and governance token for a decentralized perpetual exchange, with holders receiving 30% of platform-generated trading fees when staked. This fundamental difference means LINK's value derives from oracle service demand across multiple protocols, whereas GMX's value is directly tied to derivatives trading volume and fee generation on its specific platform.
Q2: Why does GMX show higher volatility compared to LINK despite both being established projects?
GMX exhibits significantly higher volatility due to its lower market capitalization ($82.08 million vs LINK's $9.34 billion) and substantially lower trading volume ($16,626.90 vs $2.56 billion daily). The dramatic price swing from $91.07 peak to $6.92 low reflects the concentrated nature of derivatives DEX markets, where GMX competes for only 3% of total derivatives volume against centralized exchanges controlling 97%. Additionally, GMX's anonymous team structure, newer market presence (compared to LINK's 2017 launch), and dependency on maintaining consistent trading activity create greater price sensitivity to market sentiment shifts and competitive pressures.
Q3: How do the tokenomics mechanisms of LINK and GMX affect long-term holding strategies?
LINK's tokenomics focus on network security through node operator staking and service payment mechanisms, creating demand tied to oracle service adoption growth. GMX implements a direct revenue distribution model where 30% of trading fees are converted to ETH/AVAX and distributed to staked GMX holders, generating immediate yield for long-term holders. GMX also features a floor price fund mechanism that conducts buybacks when certain conditions are met, providing downside protection. For long-term strategies, LINK offers exposure to infrastructure growth with value appreciation through ecosystem expansion, while GMX provides dual benefits of potential price appreciation plus income generation through fee distribution, though with higher associated risk.
Q4: What are the key technical risks that differentiate LINK from GMX?
LINK faces technical risks primarily related to oracle network scalability, node operator reliability, and cross-chain integration complexity across multiple blockchain networks. Since GMX actually depends on Chainlink price feeds for position pricing, LINK's technical failures could cascade to affect GMX operations. GMX-specific technical risks include smart contract vulnerabilities in its V2 upgrade implementation, GLP pool imbalance risks where excessive one-sided trading could cause liquidity provider losses, and dependency on underlying Layer-2 infrastructure (Arbitrum and Avalanche). GMX's anonymous team structure also raises governance concerns regarding technical accountability and upgrade management compared to LINK's more transparent organizational structure.
Q5: How should investors interpret the significant market cap and ranking difference between these assets?
The substantial disparity—LINK ranked #17 with $9.34 billion market cap versus GMX ranked #396 with $82.08 million—reflects their different market maturity stages and adoption levels. LINK's higher ranking indicates established institutional recognition, broader protocol integration, and proven market demand for oracle services. GMX's lower ranking suggests it remains in early growth stages within the derivatives DEX sector, offering higher growth potential but accompanied by greater execution risk. This ranking difference implies LINK provides more stable, core portfolio exposure suitable for conservative investors, while GMX represents a speculative position on derivatives DEX market expansion, appropriate for smaller allocations in risk-tolerant portfolios.
Q6: What market conditions would favor LINK over GMX, and vice versa?
LINK tends to outperform during periods of general DeFi ecosystem expansion, increased smart contract adoption, and demand for reliable off-chain data integration, as these conditions drive oracle service utilization across multiple protocols. GMX would likely outperform during periods of increased derivatives trading activity, growing dissatisfaction with centralized exchanges (following events like regulatory actions or platform failures), and bull markets where leverage trading volumes surge. Additionally, GMX benefits when Layer-2 solutions gain traction since it operates on Arbitrum and Avalanche. Risk-off market environments generally favor LINK due to its infrastructure positioning and superior liquidity, while risk-on conditions with high trading volatility could benefit GMX through increased fee generation.
Q7: How do regulatory considerations differ between LINK and GMX investments?
LINK faces relatively lower regulatory risk as its primary function as an oracle service provider positions it more clearly as utility infrastructure rather than a financial instrument. However, staking mechanisms may attract regulatory scrutiny regarding potential securities characteristics. GMX encounters more complex regulatory challenges as a derivatives trading platform, particularly concerning synthetic asset offerings, revenue distribution mechanisms, and potential classification under securities frameworks. The anonymous team structure complicates regulatory compliance efforts and may limit GMX's ability to expand into certain jurisdictions. Increasing global scrutiny on DeFi protocols could require GMX to implement KYC/AML procedures or geographic restrictions, potentially affecting user adoption, while LINK's infrastructure role may provide more regulatory clarity and operational flexibility.
Q8: What portfolio allocation strategy balances exposure to both LINK and GMX effectively?
A balanced approach depends on risk tolerance and investment objectives. Conservative investors should consider 60% LINK and 40% GMX allocation, emphasizing LINK's established market position and infrastructure role while maintaining measured exposure to GMX's growth potential. Aggressive investors might reverse this to 40% LINK and 60% GMX, accepting higher volatility for revenue participation and derivatives DEX market expansion opportunities. Regardless of allocation, maintain 20-30% stablecoin reserves for hedging and opportunistic rebalancing. For both strategies, implement dollar-cost averaging for initial positions and regularly monitor key metrics: LINK's oracle service adoption rates and protocol integrations; GMX's trading volume, fee generation, and TVL trends. Rebalance quarterly based on performance divergence and fundamental metric changes.
* The information is not intended to be and does not constitute financial advice or any other recommendation of any sort offered or endorsed by Gate.