This comprehensive investment guide compares MAVIA and GMX, two distinct cryptocurrency assets serving different market segments. MAVIA is a Web3 mobile gaming token launched in 2024, enabling true blockchain asset ownership in strategy games, while GMX operates as an established decentralized perpetual exchange distributing 30% of platform fees to token holders. The analysis examines historical price trends, revealing MAVIA declined from $10.83 to $0.05257 and GMX from $91.07 to $7.657, alongside detailed 2026-2031 price projections. Investment recommendations vary by investor profile: conservative investors favor 70-80% GMX allocation for stability, while aggressive investors explore 40-50% MAVIA exposure for growth potential. The article addresses key risk factors, tokenomics comparison, and current market sentiment through Gate exchange, providing investors actionable strategies for portfolio diversification across gaming and DeFi infrastructure sectors during uncertain market conditions.
Introduction: Investment Comparison Between MAVIA and GMX
In the cryptocurrency market, the comparison between MAVIA vs GMX has consistently been a topic that investors cannot overlook. The two projects differ significantly in market cap ranking, application scenarios, and price performance, representing distinct positioning within the crypto asset landscape.
MAVIA (MAVIA): Since its launch in 2024, this Web3 mobile base-builder strategy game has gained market recognition by creatively integrating blockchain technology to enable true ownership of in-game assets. Inspired by popular mobile games, it aims to bridge the gap between Web2 and Web3 gaming experiences.
GMX (GMX): A decentralized perpetual exchange that has established itself as a notable player in the DeFi trading space. The GMX token serves as both a utility and governance token, accruing 30% of platform-generated fees to token holders.
This article will comprehensively analyze the investment value comparison of MAVIA vs GMX across multiple dimensions including historical price trends, supply mechanisms, technical ecosystems, and future projections, attempting to address investors' most pressing question:
"Which is the better buy right now?"
I. Historical Price Comparison and Current Market Status
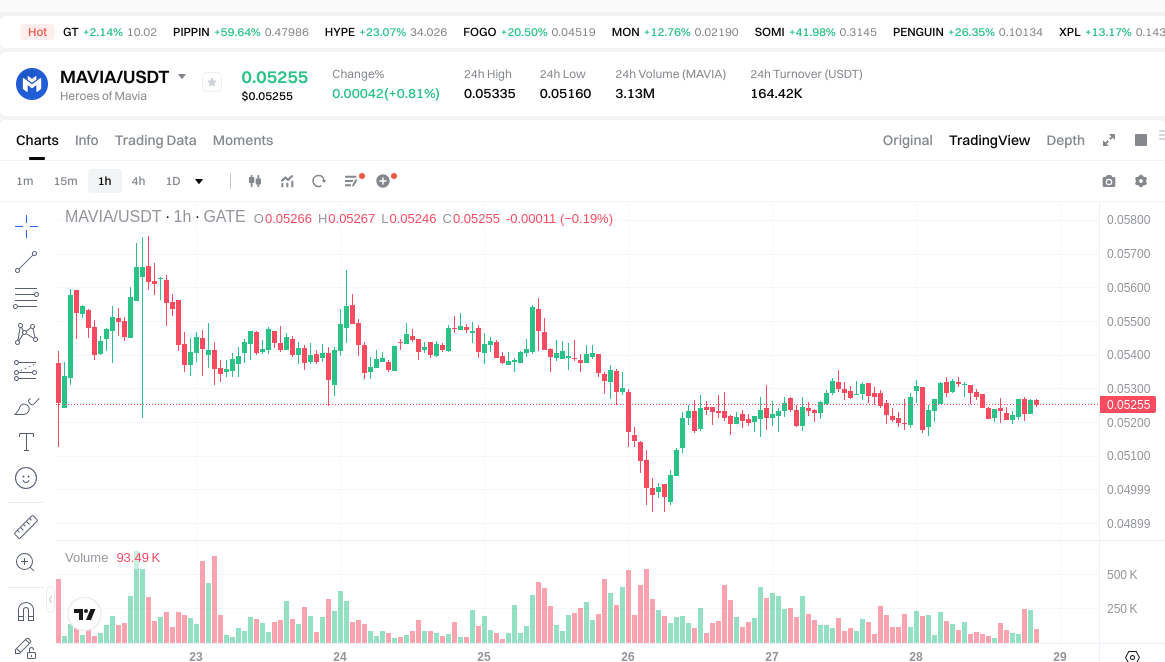
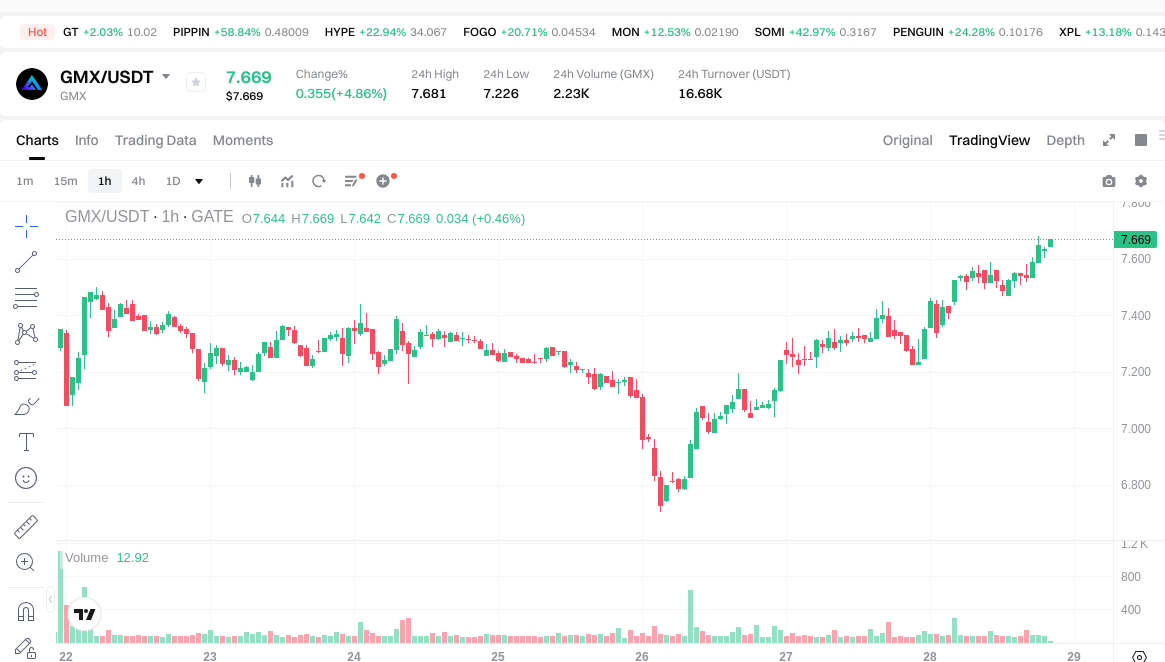
Heroes of Mavia (MAVIA) and GMX Historical Price Trends
- 2024: MAVIA reached a historical high of $10.83 in February 2024, reflecting strong market interest during its initial launch phase.
- 2023: GMX achieved its all-time high of $91.07 in April 2023, driven by significant adoption in decentralized perpetual trading.
- Comparative analysis: During the market cycle from 2024 to early 2026, MAVIA declined from $10.83 to $0.04581, while GMX experienced a decline from $91.07 to $6.74.
Current Market Status (2026-01-28)
- MAVIA current price: $0.05257
- GMX current price: $7.657
- 24-hour trading volume: MAVIA $160,321.18 vs GMX $16,691.96
- Market sentiment index (Fear & Greed Index): 29 (Fear)
View real-time prices:
II. Core Factors Influencing MAVIA vs GMX Investment Value
Supply Mechanism Comparison (Tokenomics)
- MAVIA: The supply mechanism details are not available in the provided materials, and specific information regarding fixed supply or deflationary models cannot be confirmed.
- GMX: The supply mechanism details are not available in the provided materials, and specific information regarding halving mechanisms or emission schedules cannot be confirmed.
- 📌 Historical Pattern: Supply mechanisms can influence price cycles through scarcity dynamics, emission schedules, and token distribution models, though specific historical data for these tokens is not available in the materials.
Institutional Adoption and Market Application
- Institutional Holdings: Information regarding which token receives greater institutional preference is not available in the provided materials.
- Enterprise Adoption: Specific applications of MAVIA or GMX in cross-border payments, settlements, or investment portfolios are not detailed in the available materials.
- National Policies: Regulatory attitudes toward these tokens in different jurisdictions are not covered in the provided materials.
Technology Development and Ecosystem Building
- MAVIA Technology Upgrades: Specific technical upgrades and their potential impacts are not detailed in the provided materials.
- GMX Technology Development: Specific technical developments and their potential impacts are not detailed in the provided materials.
- Ecosystem Comparison: Information regarding DeFi integration, NFT applications, payment solutions, and smart contract implementations for either token is not available in the provided materials.
Macroeconomic Environment and Market Cycles
- Performance in Inflationary Environment: Specific anti-inflation characteristics of either token cannot be determined from the provided materials.
- Macroeconomic Monetary Policy: The materials indicate that factors such as interest rates and geopolitical conditions can influence investment activity in the crypto sector, though specific impacts on MAVIA or GMX are not detailed.
- Geopolitical Factors: While cross-border transaction demand and international situations can affect crypto assets generally, specific impacts on these tokens are not covered in the available materials.
III. 2026-2031 Price Prediction: MAVIA vs GMX
Short-term Prediction (2026)
- MAVIA: Conservative $0.029-$0.053 | Optimistic $0.053-$0.065
- GMX: Conservative $6.37-$7.67 | Optimistic $7.67-$8.28
Medium-term Prediction (2028-2029)
- MAVIA may enter a gradual growth phase, with estimated price range of $0.052-$0.107
- GMX may enter a consolidation and expansion phase, with estimated price range of $6.65-$12.61
- Key drivers: institutional capital inflows, ETF developments, ecosystem growth
Long-term Prediction (2030-2031)
- MAVIA: Base scenario $0.061-$0.104 | Optimistic scenario $0.104-$0.146
- GMX: Base scenario $10.45-$13.56 | Optimistic scenario $13.56-$15.38
View detailed price predictions for MAVIA and GMX
Disclaimer
MAVIA:
| Year |
Predicted High Price |
Predicted Average Price |
Predicted Low Price |
Price Change |
| 2026 |
0.0646488 |
0.05256 |
0.028908 |
0 |
| 2027 |
0.07032528 |
0.0586044 |
0.050399784 |
11 |
| 2028 |
0.0825149952 |
0.06446484 |
0.051571872 |
22 |
| 2029 |
0.107295279696 |
0.0734899176 |
0.066875825016 |
39 |
| 2030 |
0.1175103782424 |
0.090392598648 |
0.06146696708064 |
71 |
| 2031 |
0.14553208382328 |
0.1039514884452 |
0.06237089306712 |
97 |
GMX:
| Year |
Predicted High Price |
Predicted Average Price |
Predicted Low Price |
Price Change |
| 2026 |
8.28252 |
7.669 |
6.36527 |
0 |
| 2027 |
11.8838824 |
7.97576 |
5.3437592 |
4 |
| 2028 |
11.816487228 |
9.9298212 |
6.652980204 |
29 |
| 2029 |
12.61285888824 |
10.873154214 |
8.1548656605 |
42 |
| 2030 |
15.3833385819672 |
11.74300655112 |
10.4512758304968 |
53 |
| 2031 |
14.105699469205344 |
13.5631725665436 |
11.799960132892932 |
77 |
IV. Investment Strategy Comparison: MAVIA vs GMX
Long-term vs Short-term Investment Strategies
- MAVIA: May be suitable for investors focused on Web3 gaming ecosystem growth and digital asset ownership innovation, with a horizon aligned to the maturation of blockchain gaming adoption
- GMX: May appeal to investors seeking exposure to decentralized perpetual exchange platforms and DeFi trading infrastructure development
Risk Management and Asset Allocation
- Conservative Investors: MAVIA 20-30% vs GMX 70-80%
- Aggressive Investors: MAVIA 40-50% vs GMX 50-60%
- Hedging Tools: stablecoin allocation, options strategies, cross-asset portfolio diversification
V. Potential Risk Comparison
Market Risk
- MAVIA: Exposure to Web3 gaming sector volatility, user adoption uncertainty, and competitive dynamics in the blockchain gaming space. Price declined from $10.83 to current levels around $0.05257, reflecting substantial market correction risk
- GMX: Exposure to DeFi sector cycles, trading volume fluctuations on decentralized exchanges, and competition from alternative perpetual trading platforms. Price movement from $91.07 to current levels around $7.657 indicates sensitivity to broader DeFi market conditions
Technical Risk
- MAVIA: Scalability considerations for gaming infrastructure, network stability during high transaction periods
- GMX: Platform security considerations, smart contract vulnerability exposure
Regulatory Risk
- Global regulatory frameworks may impact both tokens differently, with gaming tokens potentially facing content and virtual asset regulations, while DeFi trading platforms may encounter securities and derivatives oversight across various jurisdictions
VI. Conclusion: Which Is the Better Buy?
📌 Investment Value Summary:
- MAVIA Advantages: Positioned in the emerging Web3 gaming sector with blockchain-enabled asset ownership, targeting the convergence of traditional mobile gaming and decentralized technology
- GMX Advantages: Established presence in decentralized perpetual trading with revenue-sharing mechanism (30% of platform fees to token holders), serving the growing DeFi derivatives market
✅ Investment Recommendations:
- Beginner Investors: Consider starting with smaller position sizes in either asset, prioritizing understanding of the underlying technology and market dynamics before significant capital allocation
- Experienced Investors: May explore portfolio diversification across both gaming (MAVIA) and DeFi infrastructure (GMX) segments, with position sizing reflecting risk tolerance and sector outlook
- Institutional Investors: Consider strategic allocation based on thesis around Web3 gaming adoption trajectory versus DeFi trading infrastructure maturation, with appropriate due diligence on tokenomics and ecosystem developments
⚠️ Risk Disclosure: Cryptocurrency markets exhibit substantial volatility. This content does not constitute investment advice. Current market sentiment index indicates Fear (29), suggesting cautious market conditions. Both assets have experienced significant price declines from historical peaks. Investors should conduct independent research and consider their financial situation before making investment decisions.
VII. FAQ
Q1: What is the main difference between MAVIA and GMX in terms of use cases?
MAVIA is a Web3 mobile gaming token focused on blockchain-enabled asset ownership in a base-builder strategy game, while GMX is a decentralized perpetual exchange token that facilitates derivatives trading and distributes 30% of platform fees to token holders. MAVIA targets the convergence of traditional mobile gaming and blockchain technology, appealing to users interested in play-to-earn models and true digital asset ownership. GMX serves the DeFi derivatives market, providing infrastructure for decentralized perpetual contract trading with a revenue-sharing mechanism that rewards token holders based on trading volume.
Q2: Which token has experienced a greater price decline from its all-time high?
MAVIA has experienced a more severe decline, falling approximately 99.5% from its February 2024 peak of $10.83 to the current price around $0.05257. GMX, while also significantly down, has declined approximately 91.6% from its April 2023 all-time high of $91.07 to current levels around $7.657. Both tokens have experienced substantial corrections reflective of broader market cycles, though MAVIA's steeper decline may indicate higher volatility typical of newer gaming tokens compared to more established DeFi infrastructure projects.
Q3: What are the long-term price predictions for MAVIA and GMX through 2031?
According to the analysis, MAVIA's long-term outlook projects a base scenario range of $0.061-$0.104 by 2031, with an optimistic scenario reaching $0.104-$0.146, representing a potential 97% increase from current levels. GMX's long-term prediction estimates a base scenario of $10.45-$13.56 by 2031, with an optimistic scenario of $13.56-$15.38, representing a potential 77% increase. These predictions assume continued ecosystem development, institutional adoption, and favorable macroeconomic conditions, though actual outcomes may vary significantly based on market dynamics.
Q4: How should conservative versus aggressive investors approach allocation between MAVIA and GMX?
Conservative investors are recommended to consider a portfolio weighting of 20-30% MAVIA and 70-80% GMX, prioritizing the more established DeFi infrastructure with revenue-generating mechanisms. Aggressive investors may explore a more balanced allocation of 40-50% MAVIA and 50-60% GMX, taking higher exposure to the emerging Web3 gaming sector's growth potential. This allocation framework reflects risk tolerance differences, with GMX's established platform and fee distribution model offering relatively more predictable value accrual compared to MAVIA's dependence on gaming adoption trajectories.
Q5: What are the primary risks associated with investing in MAVIA versus GMX?
MAVIA faces market risks related to Web3 gaming sector volatility, user adoption uncertainty, and intense competition in blockchain gaming, along with technical risks involving gaming infrastructure scalability. GMX encounters risks tied to DeFi sector cycles, trading volume fluctuations, competition from alternative perpetual trading platforms, and smart contract security vulnerabilities. Both tokens face regulatory uncertainties, with MAVIA potentially subject to virtual asset and gaming content regulations, while GMX may face securities and derivatives oversight across multiple jurisdictions.
Q6: What role does the current market sentiment play in evaluating MAVIA vs GMX investments?
The current Fear & Greed Index reading of 29 (Fear) suggests cautious market conditions that may present both risks and opportunities for both tokens. In fearful market environments, established projects like GMX with revenue-generating mechanisms may demonstrate relative resilience, while emerging projects like MAVIA could experience heightened volatility. However, fear phases can also present accumulation opportunities for investors with longer time horizons and higher risk tolerance, particularly if fundamental developments in Web3 gaming or DeFi infrastructure continue regardless of short-term sentiment.
Q7: Which token offers better liquidity based on current trading metrics?
Based on 24-hour trading volume data, MAVIA demonstrates significantly higher liquidity with $160,321.18 in daily trading volume compared to GMX's $16,691.96. This suggests MAVIA currently experiences more active market participation and potentially easier entry/exit for position management. However, trading volume can fluctuate substantially based on market conditions, news events, and broader sector trends, so investors should monitor liquidity metrics continuously rather than relying on single-day snapshots.
Q8: What factors should investors consider when timing their entry into MAVIA or GMX positions?
Investors should evaluate multiple timing factors including: the broader cryptocurrency market cycle and correlation with Bitcoin/Ethereum price movements; sector-specific developments in Web3 gaming (for MAVIA) or DeFi trading platforms (for GMX); technical analysis indicators relative to historical support/resistance levels; macroeconomic conditions including interest rate policies and inflation trends; and regulatory announcements that may impact gaming tokens or DeFi protocols. Given both tokens have declined significantly from all-time highs, dollar-cost averaging strategies may help mitigate timing risk while building positions gradually during periods of market uncertainty.
* The information is not intended to be and does not constitute financial advice or any other recommendation of any sort offered or endorsed by Gate.