This comprehensive guide compares MLN (Enzyme) and AAVE, two prominent DeFi protocols, helping investors understand their distinct value propositions. MLN serves decentralized asset management through vault mechanisms, currently trading at $4.646 with $13.88M market cap. AAVE dominates lending markets at $156.43 with $2.37B market cap. The article analyzes historical price trends—MLN peaked at $258.26 in 2018; AAVE at $661.69 in 2021. It examines tokenomics, market risk (MLN's lower liquidity vs AAVE's higher volume), and technical dependencies. Investment forecasts project MLN reaching $2.56-$11.39 through 2031, while AAVE ranges from $145.45-$417.99. Recommended allocation strategies vary by risk tolerance: conservative investors favor AAVE 85-90%, aggressive investors allocate MLN 30-40%. Regulatory considerations and comprehensive risk management complete this DeFi investment analysis, available on Gate platform.
Introduction: MLN Investment Value, Price Forecast, and Risk Analysis
In the cryptocurrency market, MLN (Enzyme) represents a distinctive investment opportunity within the DeFi ecosystem. As an Ethereum-based token designed to facilitate on-chain asset management, MLN enables users to build, share, and explore DeFi investment strategies through vault mechanisms while filtering by historical performance and risk profiles.
MLN (Enzyme): Launched in February 2017, this utility token powers the Enzyme protocol (formerly known as Melon Protocol), providing functionality throughout the vault creation process and investment lifecycle. With a current market ranking of 1045, MLN serves dual purposes—users pay fees in MLN tokens while developers and external contributors can earn MLN through grant submissions.
This article will comprehensively analyze MLN's investment value, price dynamics, and associated risks by examining its historical price trends, supply mechanisms, technical ecosystem, and future outlook. Key topics include:
Understanding MLN's role in DeFi asset management infrastructure
Analyzing price volatility and market performance metrics
Evaluating tokenomics and circulation characteristics
Assessing investment risks and market positioning
As of January 25, 2026, MLN trades at $4.646 with a circulating supply of approximately 2.99 million tokens and a market capitalization of $13.88 million. The analysis aims to provide investors with data-driven insights into MLN's potential within the evolving DeFi landscape.
I. Historical Price Comparison and Market Status
Price History Trajectory of MLN (Coin A) and AAVE (Coin B)
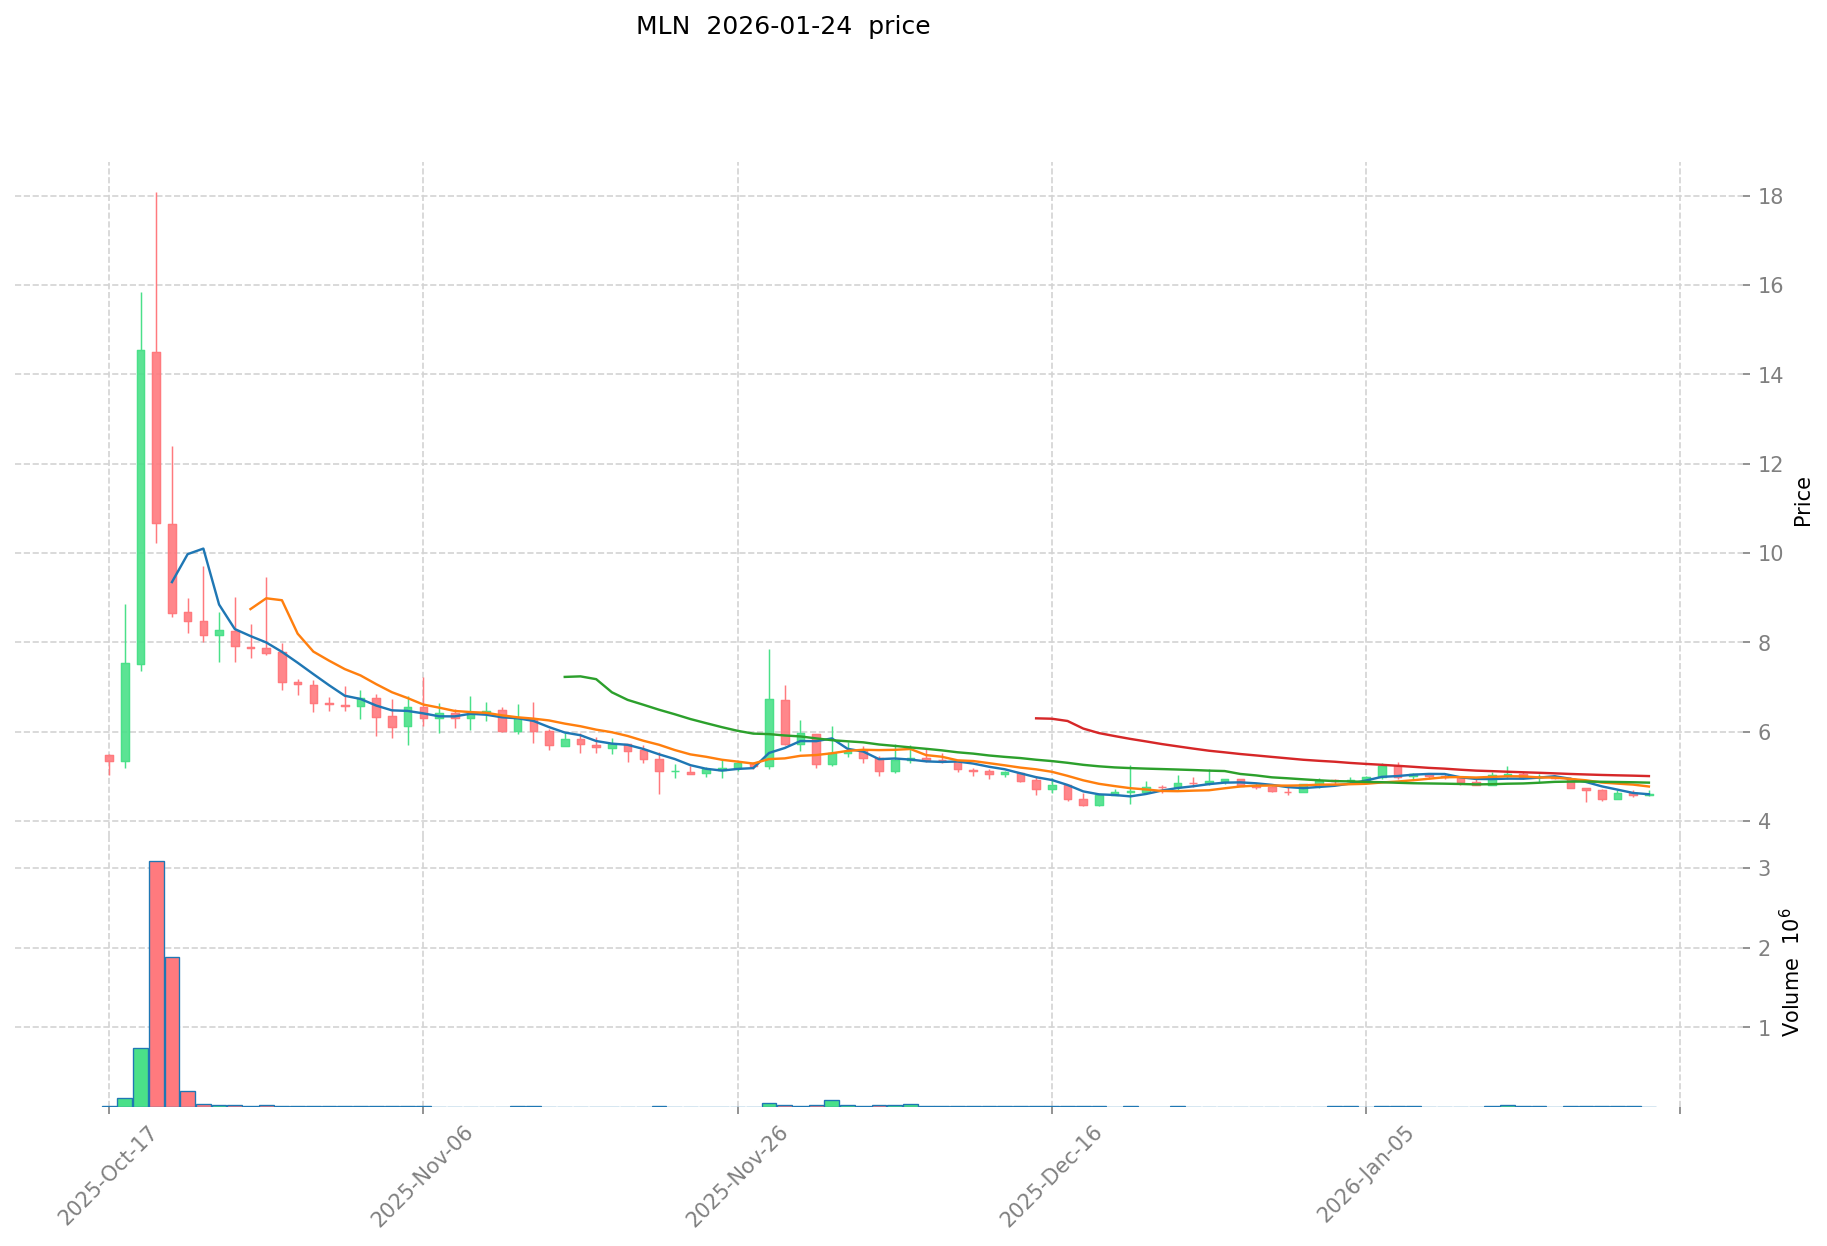
- 2018: MLN reached a notable price level of $258.26 on January 4, 2018, representing a period of significant market attention during the broader cryptocurrency market expansion.
- 2020: MLN experienced a price decline to $1.79 on March 13, 2020, coinciding with broader market volatility. During the same period, AAVE underwent token migration from LEND to AAVE at a 100:1 ratio on October 3, 2020, establishing its current tokenomics structure.
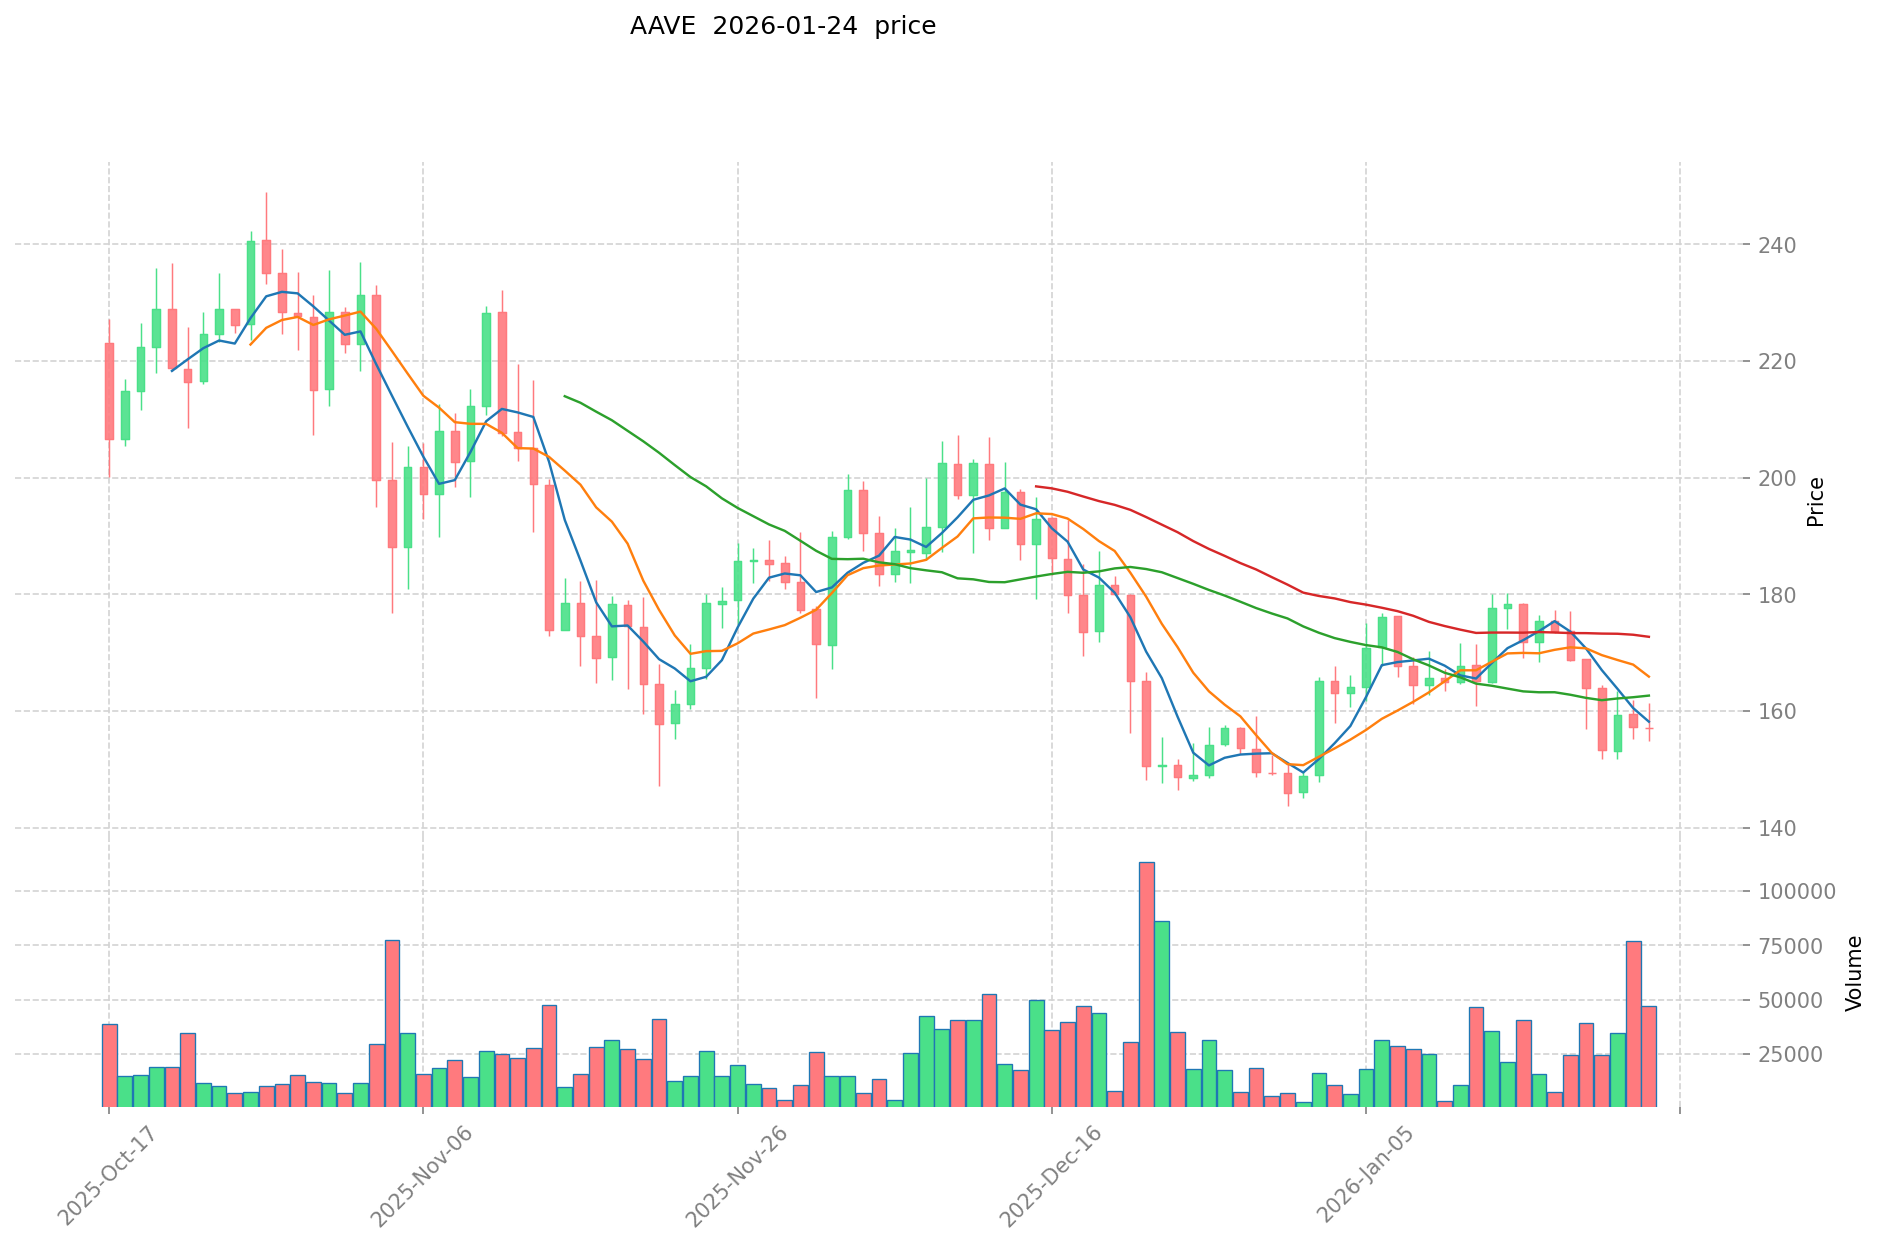
- 2021: AAVE recorded a price of $661.69 on May 19, 2021, reflecting increased adoption of decentralized lending protocols during that market cycle.
- Comparative Analysis: During different market cycles, MLN moved from its historical high of $258.26 to a low of $1.79, demonstrating significant price volatility. AAVE similarly experienced fluctuations, with its recorded high of $661.69 and low of $26.02 on November 5, 2020, showing comparable market sensitivity.
Current Market Conditions (January 25, 2026)
- MLN Current Price: $4.646
- AAVE Current Price: $156.43
- 24-Hour Trading Volume: MLN $18,381.67 vs AAVE $2,980,596.55
- Market Sentiment Index (Fear & Greed Index): 25 (Extreme Fear)
- MLN 24-Hour Price Change: -0.23%
- AAVE 24-Hour Price Change: -1.87%
- MLN Market Capitalization: $13,883,585.43
- AAVE Market Capitalization: $2,375,180,647.91
- MLN Circulating Supply: 2,988,287.87 tokens (99.996% of total supply)
- AAVE Circulating Supply: 15,183,664.57 tokens (94.898% of total supply)
View real-time prices:
II. Core Factors Affecting MLN vs AAVE Investment Value
Supply Mechanism Comparison (Tokenomics)
Due to limited reference materials, specific supply mechanism details for MLN and AAVE cannot be provided at this time.
Institutional Adoption and Market Applications
Without sufficient data from the provided materials, institutional holdings, enterprise adoption patterns, and country-specific regulatory attitudes toward MLN and AAVE cannot be accurately compared.
Technology Development and Ecosystem Building
The reference materials do not contain information regarding recent technology upgrades for either MLN or AAVE, nor their respective ecosystem developments in DeFi, NFT, payments, or smart contract implementations.
Macroeconomic Environment and Market Cycles
Insufficient data is available to analyze the performance characteristics of MLN and AAVE under inflationary conditions, their correlation with macroeconomic monetary policies, or their responses to geopolitical factors affecting cross-border transactions.
III. 2026-2031 Price Forecast: MLN vs AAVE
Short-term Forecast (2026)
- MLN: Conservative $2.56-$4.65 | Optimistic $4.65-$6.65
- AAVE: Conservative $145.45-$156.40 | Optimistic $156.40-$212.70
Medium-term Forecast (2028-2029)
- MLN may enter a consolidation phase, with estimated prices ranging from $2.97 to $9.11
- AAVE may enter an expansion phase, with estimated prices ranging from $123.44 to $274.83
- Key drivers: institutional capital inflows, ETF developments, ecosystem growth
Long-term Forecast (2030-2031)
- MLN: Base scenario $7.39-$9.55 | Optimistic scenario $9.55-$11.39
- AAVE: Base scenario $165.51-$280.53 | Optimistic scenario $280.53-$417.99
View detailed price predictions for MLN and AAVE
Disclaimer
MLN:
| Year |
Predicted High Price |
Predicted Average Price |
Predicted Low Price |
Price Change |
| 2026 |
6.6495 |
4.65 |
2.5575 |
0 |
| 2027 |
5.988735 |
5.64975 |
5.19777 |
21 |
| 2028 |
6.7503213 |
5.8192425 |
2.967813675 |
25 |
| 2029 |
9.112933755 |
6.2847819 |
5.404912434 |
35 |
| 2030 |
11.3943095847 |
7.6988578275 |
7.3909035144 |
65 |
| 2031 |
10.787639587893 |
9.5465837061 |
8.687391172551 |
105 |
AAVE:
| Year |
Predicted High Price |
Predicted Average Price |
Predicted Low Price |
Price Change |
| 2026 |
212.704 |
156.4 |
145.452 |
0 |
| 2027 |
252.83624 |
184.552 |
105.19464 |
17 |
| 2028 |
247.1243556 |
218.69412 |
131.216472 |
39 |
| 2029 |
274.832900604 |
232.9092378 |
123.441896034 |
48 |
| 2030 |
307.18399373442 |
253.871069202 |
185.32588051746 |
62 |
| 2031 |
417.9860218876329 |
280.52753146821 |
165.5112435662439 |
79 |
IV. Investment Strategy Comparison: MLN vs AAVE
Long-term vs Short-term Investment Strategies
- MLN: May appeal to investors interested in DeFi asset management infrastructure and niche protocol opportunities. The token's role in the Enzyme protocol ecosystem positions it for consideration by those exploring specialized DeFi utility tokens with vault-based investment mechanisms.
- AAVE: May attract investors seeking exposure to established decentralized lending protocols with broader market recognition. The token's integration within the DeFi lending ecosystem could appeal to those prioritizing protocols with demonstrated adoption across market cycles.
Risk Management and Asset Allocation
- Conservative Investors: MLN 10-15% vs AAVE 85-90%
- Aggressive Investors: MLN 30-40% vs AAVE 60-70%
- Hedging Tools: Stablecoin allocation, options strategies, cross-asset portfolio diversification
V. Potential Risk Comparison
Market Risk
- MLN: Trading volume of $18,381.67 indicates lower liquidity compared to larger-cap DeFi tokens, which may result in increased price volatility during market movements. The market capitalization of $13.88 million suggests sensitivity to broader market sentiment shifts.
- AAVE: With a 24-hour trading volume of $2,980,596.55 and market capitalization of $2.37 billion, AAVE demonstrates higher liquidity characteristics. However, the token remains subject to fluctuations in DeFi protocol adoption and competitive dynamics within the lending sector.
Technical Risk
- MLN: As an Ethereum-based protocol, MLN's functionality depends on Ethereum network performance, including scalability considerations and transaction cost fluctuations. The protocol's specialized focus on asset management vaults introduces dependency on user adoption within this specific use case.
- AAVE: Technical considerations include smart contract security, protocol governance mechanisms, and network stability. The token's historical price range from $26.02 to $661.69 reflects sensitivity to technical developments and protocol upgrades within the DeFi ecosystem.
Regulatory Risk
- Global regulatory approaches toward DeFi protocols continue to evolve, with varying frameworks across jurisdictions. MLN and AAVE, as tokens facilitating decentralized financial services, may experience different impacts based on regulatory classifications of asset management protocols versus lending platforms. Market participants should monitor developments in securities regulations, tax treatment, and compliance requirements across relevant jurisdictions.
VI. Conclusion: Which Is the Better Buy?
📌 Investment Value Summary:
- MLN Characteristics: Specialized positioning within DeFi asset management infrastructure, utility function in the Enzyme protocol ecosystem, circulating supply representing 99.996% of total supply
- AAVE Characteristics: Established presence in decentralized lending markets, higher liquidity metrics with $2.98 million in 24-hour trading volume, circulating supply at 94.898% of total supply
✅ Investment Considerations:
- New Investors: Consider starting with tokens demonstrating higher liquidity and broader market recognition while allocating limited exposure to specialized protocol tokens. Portfolio diversification across multiple DeFi sectors may help manage concentration risk.
- Experienced Investors: Evaluate allocation strategies based on risk tolerance, with potential for combining exposure to established DeFi protocols with selective positions in specialized infrastructure tokens. Monitor protocol development activities and adoption metrics.
- Institutional Participants: Assessment should incorporate liquidity requirements, regulatory considerations, and alignment with portfolio objectives. Due diligence on protocol governance, security audits, and ecosystem development roadmaps remains essential.
⚠️ Risk Disclosure: Cryptocurrency markets exhibit significant volatility characteristics. This analysis does not constitute investment advice. Market participants should conduct independent research and consider their financial circumstances before making investment decisions.
VII. FAQ
Q1: What is MLN (Enzyme) and how does it function in the DeFi ecosystem?
MLN is the utility token of the Enzyme protocol (formerly Melon Protocol), launched in February 2017 on Ethereum. It serves as the functional currency for on-chain asset management, enabling users to create investment vaults, pay protocol fees, and participate in DeFi strategy development. The token facilitates vault creation processes where users can build, share, and explore DeFi investment strategies while filtering opportunities by historical performance and risk profiles. Developers and contributors can also earn MLN through grant submissions, creating an incentive mechanism for ecosystem development.
Q2: How does MLN's market liquidity compare to AAVE?
MLN demonstrates significantly lower liquidity compared to AAVE. As of January 25, 2026, MLN records a 24-hour trading volume of $18,381.67 with a market capitalization of $13.88 million, while AAVE shows a trading volume of $2,980,596.55 and market capitalization of $2.37 billion. This liquidity differential means MLN may experience greater price volatility during market movements and could face challenges with order execution for larger transaction sizes. The lower liquidity profile positions MLN as a more specialized investment suitable for participants who understand the associated market depth limitations.
Q3: What is the difference between MLN and AAVE's primary use cases?
MLN focuses specifically on decentralized asset management infrastructure, providing utility for vault-based investment mechanisms where users can create and manage on-chain investment strategies. AAVE, conversely, operates as a decentralized lending protocol enabling users to supply liquidity and borrow crypto assets. While both operate within the DeFi ecosystem, MLN addresses the asset management vertical with specialized functionality for strategy construction, whereas AAVE serves the broader lending and borrowing market with established protocol mechanisms. This fundamental difference in use cases influences their respective adoption patterns and target user bases.
Q4: What are the tokenomics characteristics of MLN?
MLN maintains a circulating supply of approximately 2.99 million tokens, representing 99.996% of its total supply as of January 25, 2026. This high circulation percentage indicates minimal token unlock pressure from undistributed reserves. The token serves a dual function within the Enzyme ecosystem—users pay fees in MLN for protocol operations, while developers receive MLN through grants, creating both demand and distribution mechanisms. However, specific details regarding emission schedules, burn mechanisms, or treasury allocations are not available in current reference materials.
Q5: How has MLN's price performed historically compared to its peak?
MLN reached a historical high of $258.26 on January 4, 2018, during the broader cryptocurrency market expansion. Subsequently, the token experienced significant volatility, declining to $1.79 on March 13, 2020, during market-wide corrections. As of January 25, 2026, MLN trades at $4.646, representing approximately 1.8% of its all-time high. This price trajectory reflects both the token's sensitivity to market cycles and the specialized nature of its use case within the DeFi asset management sector, which may experience different adoption dynamics compared to broader DeFi categories like lending protocols.
Q6: What risk factors should investors consider before investing in MLN?
Investors should evaluate multiple risk dimensions: Market risk includes MLN's limited liquidity profile, which may amplify price volatility and impact execution for larger transactions. Technical risk encompasses dependency on Ethereum network performance and the specialized adoption of vault-based asset management functionality. Regulatory risk involves evolving frameworks for DeFi protocols, particularly regarding asset management services which may face different regulatory treatment than other DeFi categories. Additionally, MLN's concentrated focus on a specific DeFi vertical means its success depends heavily on adoption within this niche market segment rather than broader DeFi growth.
Q7: What is the price forecast range for MLN through 2031?
Based on analytical projections, MLN shows the following estimated ranges: For 2026, conservative estimates suggest $2.56-$4.65, while optimistic scenarios project $4.65-$6.65. Medium-term forecasts for 2028-2029 indicate a consolidation phase with prices ranging from $2.97 to $9.11. Long-term projections for 2030-2031 estimate base scenarios of $7.39-$9.55 and optimistic scenarios of $9.55-$11.39. These forecasts assume various factors including institutional capital flows, ecosystem development, and broader DeFi adoption trends. However, actual prices may vary significantly based on market conditions, protocol developments, and competitive dynamics within the asset management sector.
Q8: How should investors approach portfolio allocation between MLN and AAVE?
Portfolio allocation strategies should align with individual risk tolerance and investment objectives. Conservative investors might consider MLN allocation of 10-15% versus AAVE at 85-90%, reflecting MLN's specialized positioning and lower liquidity profile. Aggressive investors seeking higher risk-return profiles might allocate 30-40% to MLN versus 60-70% to AAVE, accepting increased volatility for potential specialized protocol growth. Both approaches benefit from incorporating risk management tools including stablecoin allocations for liquidity, options strategies for downside protection, and cross-asset diversification. Portfolio decisions should consider market conditions, the Fear & Greed Index (currently at 25, indicating Extreme Fear), and individual capacity to withstand cryptocurrency market volatility.
* The information is not intended to be and does not constitute financial advice or any other recommendation of any sort offered or endorsed by Gate.