This comprehensive guide compares MNT and KAVA, two leading DeFi lending platforms with distinct positioning in cryptocurrency markets. MNT, launched in 2023, positions itself as a Layer 2 infrastructure hub for next-generation banking solutions, currently trading at $0.9631 with strong liquidity. KAVA, operational since 2019, operates as a cross-chain DeFi platform providing collateralized lending and stablecoin services, trading at $0.08503. The article analyzes historical price trends, supply mechanisms, institutional adoption, and technological ecosystems to determine investment value. Short-term projections for MNT range $0.83-$1.17, while KAVA projects $0.05-$0.11. Investment strategies vary by profile: conservative investors balance both assets with established cryptocurrencies, while experienced investors leverage ecosystem diversification. Both platforms face distinct market, technical, and regulatory risks requiring comprehensive due diligence before investment decisions.
Introduction: Investment Comparison Between MNT and KAVA
In the cryptocurrency market, the comparison between MNT vs KAVA has consistently been a topic investors cannot avoid. Both exhibit notable differences in market cap ranking, application scenarios, and price performance, representing distinct positioning within the crypto asset landscape.
MNT (Mantle): Launched in 2023, it has gained market recognition by positioning itself as the largest sustainable hub for on-chain finance, leveraging blockchain's transformative power to build next-generation banking infrastructure.
KAVA: Since its launch in 2019, it has been recognized as a cross-chain decentralized financial platform, providing collateralized lending and stablecoin services for mainstream digital assets, combining DeFi applications with Layer 1 infrastructure.
This article will comprehensively analyze the investment value comparison of MNT vs KAVA around historical price trends, supply mechanisms, institutional adoption, technical ecosystems, and future predictions, attempting to answer the question investors care about most:
"Which is the better buy right now?"
I. Historical Price Comparison and Current Market Status
MNT and KAVA Historical Price Trends
- 2023: MNT experienced notable volatility following its mainnet launch in July 2023, with its price initially trading around $0.25 and later reaching a low of $0.3080 in October 2023.
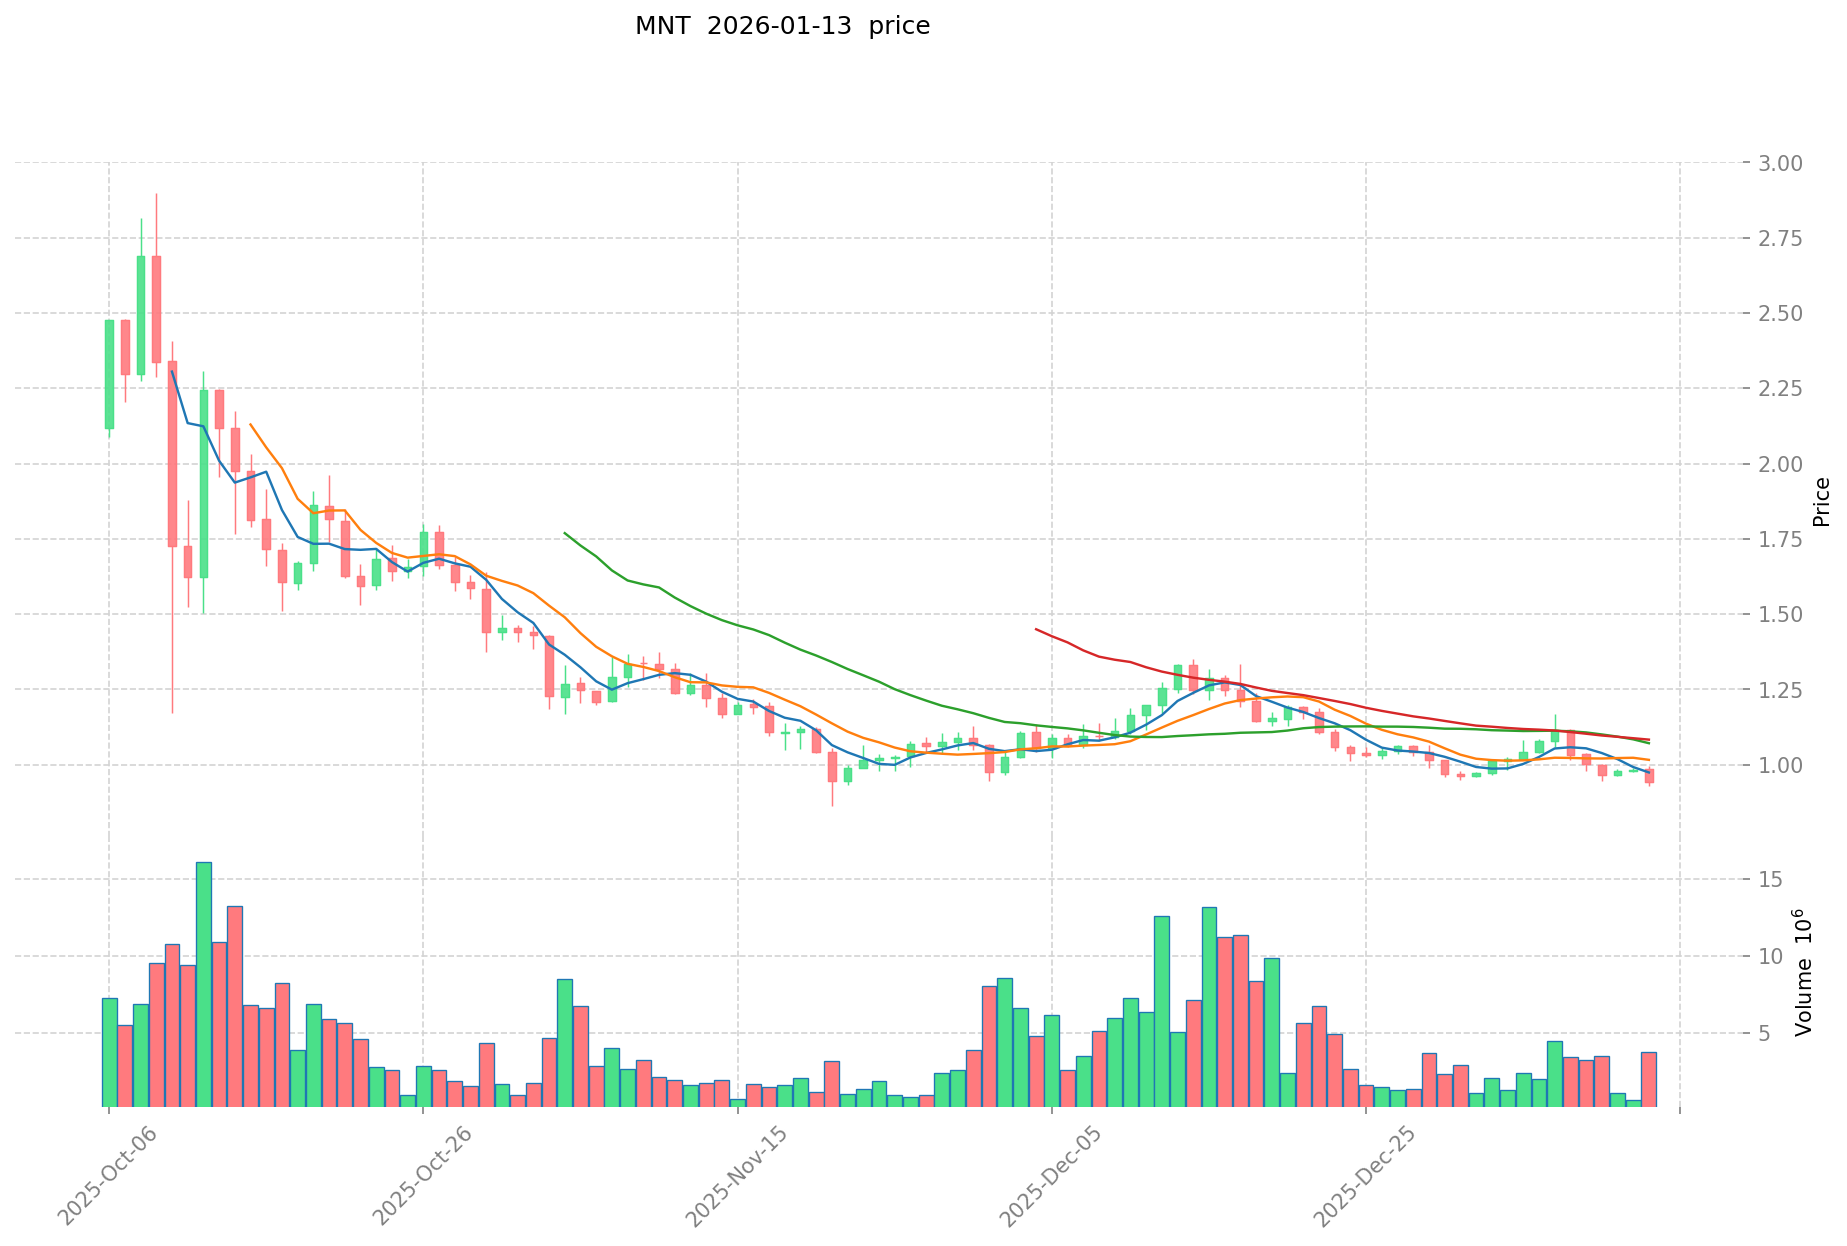
- 2025: MNT reached its peak price of $2.90 in October 2025, representing significant growth from its launch price.
- 2021: KAVA achieved its all-time high of $9.12 in August 2021, driven by increased adoption in the DeFi lending space.
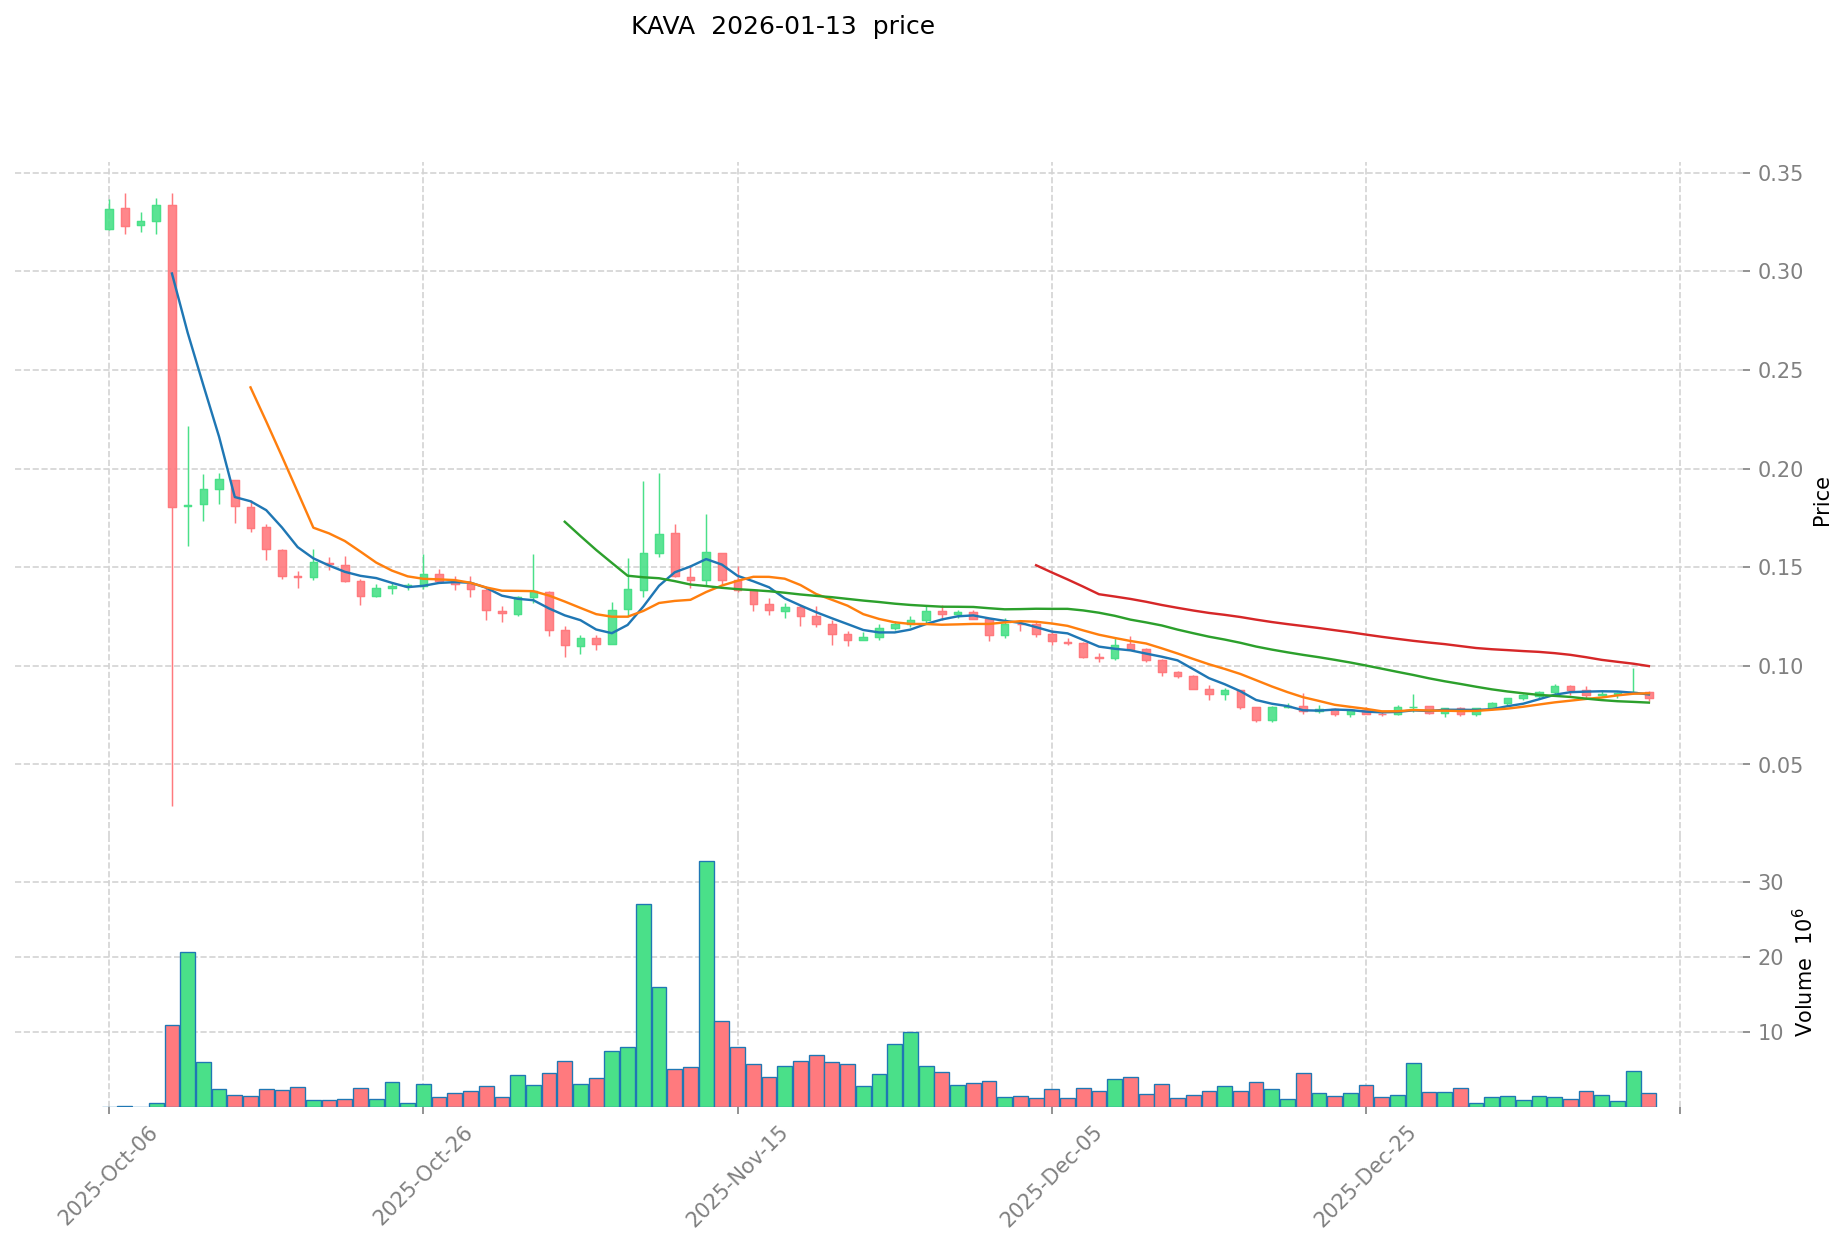
- 2025: KAVA recorded its historical low of $0.071579 in December 2025, reflecting substantial decline from previous levels.
- Comparative Analysis: During recent market cycles, MNT has shown recovery from its low of $0.3080 to current levels around $0.96, while KAVA has experienced a more significant decline from its peak of $9.12, currently trading near its historical lows at approximately $0.085.
Current Market Status (2026-01-13)
- MNT Current Price: $0.9631
- KAVA Current Price: $0.08503
- 24-Hour Trading Volume: MNT $3,688,491.99 vs KAVA $229,050.49
- Market Sentiment Index (Fear & Greed Index): 26 (Fear)
View Real-time Prices:
- Check MNT Current Price Market Price
- Check KAVA Current Price Market Price
II. Core Factors Influencing MNT vs KAVA Investment Value
Supply Mechanism Comparison (Tokenomics)
The supply mechanisms of MNT and KAVA represent different approaches to token economics. While specific supply details for these tokens are not extensively covered in available materials, supply mechanisms generally play a role in shaping price dynamics through inflation rates, distribution schedules, and token allocation strategies.
- MNT: Information regarding fixed supply or deflationary models requires further verification through official project documentation
- KAVA: Specific supply characteristics and emission schedules need to be confirmed through primary sources
- 📌 Historical Pattern: Supply mechanisms have historically influenced price cycles through scarcity effects and distribution phases, though specific correlations vary across different market conditions
Institutional Adoption and Market Applications
Institutional participation and real-world applications contribute to the utility and demand for crypto assets. The comparative institutional interest between MNT and KAVA depends on multiple factors including regulatory clarity, use case viability, and market positioning.
- Institutional Holdings: Comparative institutional preference between the two assets requires analysis of on-chain data and public disclosures
- Enterprise Adoption: Applications in cross-border payments, settlement systems, and investment portfolios vary based on each project's strategic focus and partnerships
- National Policies: Regulatory approaches toward these assets differ across jurisdictions, affecting accessibility and adoption rates
Technology Development and Ecosystem Building
Technological advancement and ecosystem expansion influence the long-term viability of blockchain projects. Both MNT and KAVA operate within evolving technical landscapes.
- MNT Technology Upgrades: Technical developments and their potential impacts on network performance and user adoption require ongoing monitoring
- KAVA Technology Development: Evolution of protocol features and infrastructure improvements contribute to ecosystem growth
- Ecosystem Comparison: The presence and maturity of DeFi protocols, NFT platforms, payment solutions, and smart contract implementations vary between the two ecosystems, reflecting different strategic priorities and development stages
Macroeconomic Factors and Market Cycles
Broader economic conditions and market cycles affect crypto asset performance through various transmission channels.
- Performance in Inflationary Environments: The relative inflation-hedging characteristics depend on market perception, adoption rates, and utility within economic systems
- Macroeconomic Monetary Policy: Interest rate adjustments and dollar index movements influence capital flows into and out of crypto assets, though the magnitude of impact varies
- Geopolitical Factors: Cross-border transaction demand and international developments may affect utility and adoption, particularly for assets with payment or settlement use cases
III. 2026-2031 Price Prediction: MNT vs KAVA
Short-term Forecast (2026)
- MNT: Conservative $0.83-$0.96 | Optimistic $0.96-$1.17
- KAVA: Conservative $0.05-$0.09 | Optimistic $0.09-$0.11
Mid-term Forecast (2028-2029)
- MNT may enter a consolidation phase, with projected price range of $0.74-$1.52 in 2028 and $0.82-$1.50 in 2029
- KAVA may enter a growth phase, with projected price range of $0.08-$0.18 in 2028 and $0.13-$0.18 in 2029
- Key drivers: institutional capital inflow, ETF developments, ecosystem expansion
Long-term Forecast (2030-2031)
- MNT: Baseline scenario $0.80-$1.40 | Optimistic scenario $1.40-$1.69
- KAVA: Baseline scenario $0.14-$0.16 | Optimistic scenario $0.16-$0.19
View detailed price predictions for MNT and KAVA
Disclaimer
MNT:
| Year |
Predicted High Price |
Predicted Average Price |
Predicted Low Price |
Price Change |
| 2026 |
1.165109 |
0.9629 |
0.828094 |
0 |
| 2027 |
1.117204725 |
1.0640045 |
0.68096288 |
10 |
| 2028 |
1.515940411375 |
1.0906046125 |
0.7416111365 |
13 |
| 2029 |
1.498763388728125 |
1.3032725119375 |
0.821061682520625 |
35 |
| 2030 |
1.597160463379406 |
1.401017950332812 |
0.798580231689703 |
45 |
| 2031 |
1.693970803747403 |
1.499089206856109 |
1.319198502033376 |
55 |
KAVA:
| Year |
Predicted High Price |
Predicted Average Price |
Predicted Low Price |
Price Change |
| 2026 |
0.1132362 |
0.08514 |
0.0536382 |
0 |
| 2027 |
0.146798388 |
0.0991881 |
0.071415432 |
16 |
| 2028 |
0.1783402038 |
0.122993244 |
0.08363540592 |
44 |
| 2029 |
0.176280066963 |
0.1506667239 |
0.129573382554 |
77 |
| 2030 |
0.17001233124876 |
0.1634733954315 |
0.14385658797972 |
92 |
| 2031 |
0.190086864207748 |
0.16674286334013 |
0.138396576572307 |
96 |
IV. Investment Strategy Comparison: MNT vs KAVA
Long-term vs Short-term Investment Strategies
- MNT: May suit investors focused on emerging DeFi infrastructure and next-generation banking solutions, with potential for ecosystem expansion in the Layer 2 space
- KAVA: May suit investors interested in established cross-chain DeFi platforms with lending and stablecoin functionality, though currently experiencing lower price levels
Risk Management and Asset Allocation
- Conservative Investors: MNT 30% vs KAVA 20% (with remaining allocation to established assets and stablecoins)
- Aggressive Investors: MNT 50% vs KAVA 30% (with higher exposure to growth-oriented assets)
- Hedging Tools: Stablecoin allocation for liquidity management, options strategies for downside protection, cross-asset portfolio diversification
V. Potential Risk Comparison
Market Risk
- MNT: Relatively newer project launched in 2023, subject to volatility associated with emerging blockchain infrastructure; 24-hour trading volume of $3.69 million indicates developing liquidity
- KAVA: Experienced substantial price decline from 2021 peak of $9.12 to current levels near $0.085; lower trading volume of $229,050 may present liquidity challenges
Technical Risk
- MNT: Scalability and network stability considerations as the ecosystem expands; dependencies on Layer 2 infrastructure development
- KAVA: Cross-chain protocol complexity and potential smart contract vulnerabilities; network performance under varying transaction loads
Regulatory Risk
- Global regulatory developments may affect both assets differently based on their classification and use cases; MNT's positioning in financial infrastructure and KAVA's DeFi lending services face distinct regulatory scrutiny across jurisdictions; evolving compliance requirements may impact accessibility and adoption trajectories
VI. Conclusion: Which Is the Better Buy?
📌 Investment Value Summary:
- MNT Advantages: Recent ecosystem development momentum; positioning in Layer 2 infrastructure space; recovery from October 2023 lows demonstrating resilience; higher current trading volume suggesting improved liquidity
- KAVA Advantages: Established presence since 2019 with operational cross-chain DeFi platform; proven lending and stablecoin functionality; current low price levels may present entry opportunities for risk-tolerant investors
✅ Investment Recommendations:
- Novice Investors: Consider dollar-cost averaging with small allocations to both assets while maintaining substantial holdings in established cryptocurrencies; prioritize learning about underlying technologies and use cases before increasing exposure
- Experienced Investors: Evaluate portfolio diversification benefits of including both Layer 2 infrastructure (MNT) and cross-chain DeFi platforms (KAVA); monitor ecosystem developments and adoption metrics; implement risk management through position sizing and stop-loss strategies
- Institutional Investors: Conduct thorough due diligence on regulatory compliance, liquidity depth, and custodial solutions; assess strategic fit within broader crypto allocation frameworks; consider pilot allocations while evaluating long-term viability and integration with existing financial infrastructure
⚠️ Risk Warning: The cryptocurrency market exhibits extreme volatility. This article does not constitute investment advice. Investors should conduct independent research and consult qualified financial advisors before making investment decisions.
VII. FAQ
Q1: What are the main differences between MNT and KAVA in terms of their blockchain positioning?
MNT positions itself as a Layer 2 infrastructure solution focused on building next-generation banking infrastructure and on-chain finance, while KAVA operates as a cross-chain DeFi platform providing collateralized lending and stablecoin services. MNT launched in 2023 with emphasis on scalability and financial services infrastructure, whereas KAVA has been operational since 2019, combining DeFi applications with Layer 1 blockchain functionality. Their fundamental architectural approaches reflect different strategic priorities: MNT targets institutional financial infrastructure, while KAVA focuses on cross-chain interoperability and decentralized lending protocols.
Q2: How do the current price levels and historical performance compare between MNT and KAVA?
As of January 13, 2026, MNT trades at $0.9631 while KAVA trades at $0.08503, representing significantly different price trajectories. MNT reached its peak of $2.90 in October 2025 and has recovered from its October 2023 low of $0.3080, demonstrating relative resilience. KAVA, however, experienced substantial decline from its all-time high of $9.12 in August 2021 to its December 2025 historical low of $0.071579. The current market conditions show MNT with notably higher 24-hour trading volume ($3.69 million) compared to KAVA ($229,050), indicating different levels of market liquidity and investor interest.
Q3: What are the projected price ranges for MNT and KAVA through 2031?
For MNT, short-term 2026 projections range from $0.83-$1.17, with long-term 2030-2031 forecasts suggesting $0.80-$1.69 depending on market scenarios. KAVA's short-term 2026 projections indicate $0.05-$0.11, with long-term 2030-2031 estimates ranging from $0.14-$0.19. These predictions reflect different growth trajectories: MNT shows more moderate price appreciation potential from current levels, while KAVA's projections suggest possible recovery from historical lows. Both forecasts depend heavily on ecosystem adoption, institutional capital inflow, regulatory developments, and broader macroeconomic conditions affecting cryptocurrency markets.
Q4: Which asset presents better opportunities for different investor profiles?
For novice investors, dollar-cost averaging with small allocations to both assets while maintaining substantial holdings in established cryptocurrencies is recommended, prioritizing education about underlying technologies. Experienced investors should evaluate portfolio diversification benefits, with MNT offering Layer 2 infrastructure exposure and KAVA providing cross-chain DeFi platform access; implementing position sizing and risk management strategies is essential. Institutional investors require thorough due diligence on regulatory compliance, liquidity depth, and custodial solutions, considering pilot allocations while assessing strategic fit within broader crypto allocation frameworks and integration with existing financial infrastructure.
Q5: What are the primary risks associated with investing in MNT versus KAVA?
MNT's primary risks include its relatively recent launch in 2023, volatility associated with emerging blockchain infrastructure, and dependencies on Layer 2 ecosystem development. KAVA faces challenges from substantial price decline since 2021, lower trading volume presenting potential liquidity issues, cross-chain protocol complexity, and smart contract vulnerabilities. Both assets face market risk from extreme cryptocurrency volatility, technical risks related to scalability and network stability, and regulatory uncertainty as global compliance frameworks evolve. The current Fear & Greed Index of 26 indicates broader market anxiety, affecting both assets' short-term performance prospects.
Q6: How do the trading volumes and liquidity compare between MNT and KAVA?
MNT demonstrates significantly higher liquidity with 24-hour trading volume of $3,688,491.99, while KAVA shows considerably lower volume at $229,050.49 as of January 13, 2026. This substantial difference indicates stronger market participation and easier position entry/exit for MNT investors. Higher trading volumes typically correlate with tighter bid-ask spreads, reduced slippage, and better price discovery. KAVA's lower liquidity may present challenges for larger position sizes and could result in greater price impact during significant buy or sell orders, requiring investors to implement more sophisticated execution strategies when trading this asset.
Q7: What portfolio allocation strategies are recommended for MNT and KAVA?
Conservative investors should consider allocating approximately 30% to MNT and 20% to KAVA, with remaining portfolio distribution across established cryptocurrencies and stablecoins for risk management. Aggressive investors may increase exposure to 50% MNT and 30% KAVA, accepting higher volatility in pursuit of growth potential. Hedging strategies should incorporate stablecoin allocation for liquidity management, options strategies for downside protection, and cross-asset portfolio diversification. These recommendations assume investors maintain appropriate risk tolerance levels and implement dollar-cost averaging to mitigate timing risk, while regularly rebalancing positions based on market conditions and individual financial objectives.
Q8: What factors should investors monitor when deciding between MNT and KAVA?
Investors should monitor ecosystem development progress, including DeFi protocol launches, partnership announcements, and developer activity for both platforms. Regulatory developments across major jurisdictions affecting Layer 2 infrastructure (MNT) and cross-chain DeFi platforms (KAVA) require continuous attention. Technical milestones such as network upgrades, scalability improvements, and security audits influence long-term viability. Macroeconomic indicators including interest rate policies, inflation trends, and institutional adoption patterns affect both assets differently. Additionally, tracking on-chain metrics like active addresses, transaction volumes, total value locked (TVL), and token distribution patterns provides insights into actual ecosystem usage and growth trajectories beyond price movements alone.
* The information is not intended to be and does not constitute financial advice or any other recommendation of any sort offered or endorsed by Gate.