This comprehensive guide compares MODE and KAVA as investment opportunities within the blockchain ecosystem. MODE, launched in 2024, operates as a Modular DeFi Layer 2 on Optimism, while KAVA, established since 2019, functions as a cross-chain decentralized lending platform. The article analyzes historical price trends, tokenomics, institutional adoption, technological ecosystems, and provides market forecasts through 2031. Both tokens have experienced 99% declines from peaks, with KAVA maintaining higher trading volume and liquidity. Investment strategies vary by risk tolerance: conservative investors favor KAVA's established track record (80-90% allocation), while aggressive investors may allocate 40-50% to MODE's early-stage opportunities. Critical considerations include extreme market volatility, limited MODE liquidity, regulatory evolution, and macroeconomic factors. The guide addresses key investment questions through detailed FAQ sections, helping investors make informed allocation decisions on Gate.
Introduction: Investment Comparison Between MODE and KAVA
In the cryptocurrency market, the comparison between MODE vs KAVA has become a topic that investors cannot avoid. The two not only show significant differences in market cap ranking, application scenarios, and price performance, but also represent distinct positioning within the crypto asset landscape.
MODE (MODE): Launched in 2024, it has gained market recognition by positioning itself as a Modular DeFi Layer 2 backed by Optimism, establishing new economic systems that reward contributions to network growth.
KAVA (KAVA): Since its launch in 2019, it has been recognized as a cross-chain decentralized financial platform, providing collateral lending and stablecoin services for mainstream digital assets, becoming a decentralized Layer 1 hub supporting cross-chain DeFi applications.
This article will provide a comprehensive analysis of the investment value comparison between MODE vs KAVA, focusing on historical price trends, supply mechanisms, institutional adoption, technological ecosystems, and future predictions, attempting to answer the question that investors care about most:
"Which is the better buy right now?"
I. Historical Price Comparison and Current Market Status
MODE (Coin A) and KAVA (Coin B) Historical Price Trends
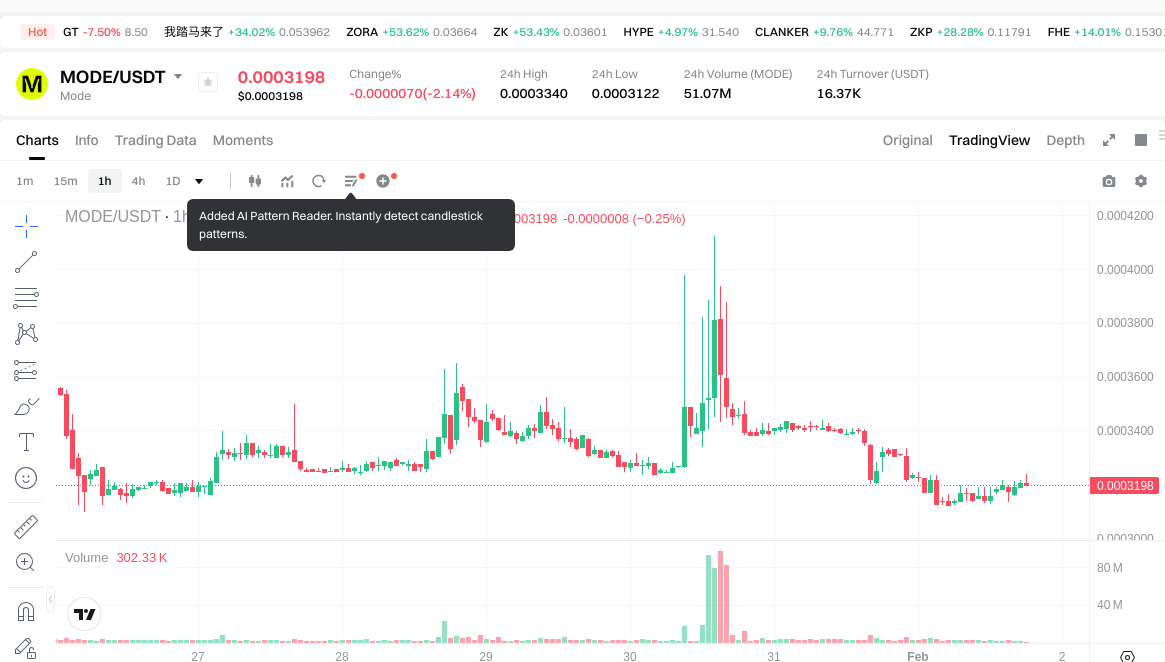
- 2024: MODE launched in May 2024 with an initial price of $0.1, reaching an all-time high of $0.15 on May 7, 2024. However, the token experienced significant downward pressure throughout the following months.
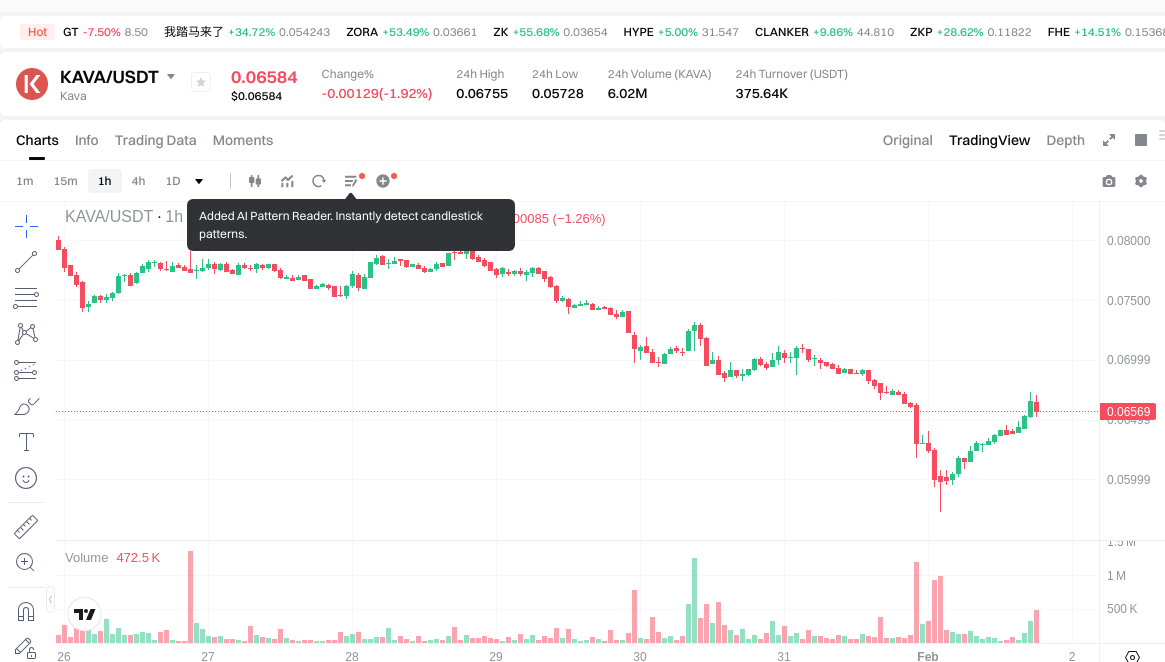
- 2021: KAVA reached its all-time high of $9.12 on August 30, 2021, during a period of strong DeFi growth. The token subsequently entered a prolonged decline phase.
- Comparative Analysis: During the market downturn, MODE declined from its peak of $0.15 to its all-time low of $0.0003097 (recorded on January 25, 2026), representing a decline of over 99%. KAVA demonstrated a similar pattern, falling from $9.12 to $0.059126 (recorded on February 1, 2026), also reflecting a decline exceeding 99%.
Current Market Conditions (February 1, 2026)
- MODE Current Price: $0.0003206
- KAVA Current Price: $0.06673
- 24-Hour Trading Volume: MODE at $16,354.73 vs KAVA at $371,598.18
- Market Sentiment Index (Fear & Greed Index): 14 (Extreme Fear)
View real-time prices:
- Check MODE current price Market Price
- Check KAVA current price Market Price
II. Core Factors Influencing MODE vs KAVA Investment Value
Supply Mechanism Comparison (Tokenomics)
- MODE: The token operates within a decentralized finance ecosystem built on Optimism Layer-2, with initial distribution through an airdrop mechanism to early users.
- KAVA: Functions as part of a cross-chain lending platform designed to provide financial leverage opportunities for cryptocurrency investors.
- 📌 Historical Pattern: Supply mechanisms and distribution strategies can influence market participation and early adoption rates.
Institutional Adoption and Market Application
- Institutional Holdings: Market data suggests varying levels of institutional interest, with institutional investors demonstrating distinct investment logic focused on risk control, liquidity sufficiency, and regulatory compliance.
- Enterprise Adoption: MODE operates within the DeFi ecosystem with a reported market capitalization, while KAVA's primary use case centers on cross-chain borrowing tools that enable users to access financing leverage.
- Regulatory Environment: The crypto asset market continues to experience evolving regulatory frameworks across different jurisdictions.
Technology Development and Ecosystem Building
- MODE Technology: Built on Optimism Layer-2 infrastructure, focusing on decentralized finance ecosystem development.
- KAVA Technology: Provides cross-chain money market functionality with lending tools designed to facilitate increased cryptocurrency purchasing power.
- Ecosystem Comparison: MODE demonstrates presence in DeFi applications, while KAVA's ecosystem emphasizes cross-chain asset interoperability and lending protocols.
Macroeconomic Environment and Market Cycles
- Market Context: The crypto market has shown growth driven by institutional capital flows, with investors prioritizing controllable risk, adequate liquidity, and regulatory compliance.
- Economic Factors: Market participants consider various macroeconomic variables when evaluating crypto assets.
- Market Dynamics: Technology innovation and market attention remain key considerations for assessing potential value in these projects.
III. 2026-2031 Price Forecast: MODE vs KAVA
Short-term Forecast (2026)
- MODE: Conservative $0.000248 - $0.000322 | Optimistic $0.000322 - $0.000389
- KAVA: Conservative $0.0604 - $0.0657 | Optimistic $0.0657 - $0.0874
Mid-term Forecast (2028-2029)
- MODE may enter a consolidation phase, with projected prices ranging from $0.000257 to $0.000629
- KAVA may enter an expansion phase, with projected prices ranging from $0.0634 to $0.124
- Key drivers: institutional capital inflows, ETF developments, ecosystem growth
Long-term Forecast (2030-2031)
- MODE: Baseline scenario $0.000331 - $0.000653 | Optimistic scenario $0.000653 - $0.000770
- KAVA: Baseline scenario $0.0846 - $0.129 | Optimistic scenario $0.129 - $0.146
View detailed price predictions for MODE and KAVA
Disclaimer
MODE:
| Year |
Predicted High Price |
Predicted Average Price |
Predicted Low Price |
Price Change |
| 2026 |
0.000389136 |
0.0003216 |
0.000247632 |
0 |
| 2027 |
0.00047263944 |
0.000355368 |
0.00027363336 |
10 |
| 2028 |
0.0006085854684 |
0.00041400372 |
0.0002566823064 |
29 |
| 2029 |
0.000628892350866 |
0.0005112945942 |
0.000352793269998 |
59 |
| 2030 |
0.000735420579567 |
0.000570093472533 |
0.000330654214069 |
77 |
| 2031 |
0.000770253290739 |
0.00065275702605 |
0.000443874777714 |
103 |
KAVA:
| Year |
Predicted High Price |
Predicted Average Price |
Predicted Low Price |
Price Change |
| 2026 |
0.0873677 |
0.06569 |
0.0604348 |
-1 |
| 2027 |
0.099487505 |
0.07652885 |
0.0650495225 |
14 |
| 2028 |
0.11441063075 |
0.0880081775 |
0.0633658878 |
31 |
| 2029 |
0.12448756707375 |
0.101209404125 |
0.0789433352175 |
51 |
| 2030 |
0.145574546423193 |
0.112848485599375 |
0.084636364199531 |
69 |
| 2031 |
0.138256322132074 |
0.129211516011284 |
0.102077097648914 |
93 |
IV. Investment Strategy Comparison: MODE vs KAVA
Long-term vs Short-term Investment Strategies
-
MODE: May appeal to investors focused on early-stage DeFi Layer 2 ecosystem development and willing to accept higher volatility exposure. The project's positioning within the Optimism ecosystem could attract those interested in modular DeFi infrastructure.
-
KAVA: May appeal to investors seeking exposure to cross-chain DeFi protocols with established market presence since 2019. The platform's focus on collateral lending and stablecoin services could attract those interested in mature DeFi infrastructure.
Risk Management and Asset Allocation
-
Conservative Investors: MODE 10-20% vs KAVA 80-90% - Conservative allocations may favor the more established project with longer operational history
-
Aggressive Investors: MODE 40-50% vs KAVA 50-60% - Higher risk tolerance investors might consider increased exposure to early-stage opportunities while maintaining diversification
-
Hedging Tools: Stablecoin allocation, options strategies, cross-asset portfolio combinations to manage volatility exposure
V. Potential Risk Comparison
Market Risks
-
MODE: The token has experienced significant price decline exceeding 99% from its peak, reflecting high volatility characteristics. Limited trading volume of $16,354.73 may present liquidity considerations.
-
KAVA: Despite longer market presence, the token has also experienced substantial decline exceeding 99% from historical peaks. Trading volume of $371,598.18 indicates relatively higher market activity compared to MODE.
Technical Risks
-
MODE: Scalability and network stability considerations related to Layer 2 infrastructure dependency on Optimism protocol
-
KAVA: Cross-chain protocol complexity, smart contract security considerations, and network stability factors
Regulatory Risks
- Evolving regulatory frameworks across different jurisdictions may impact both projects differently. DeFi protocols face ongoing scrutiny regarding compliance requirements, while cross-chain lending platforms encounter additional considerations related to financial services regulations.
VI. Conclusion: Which Is the Better Buy?
📌 Investment Value Summary:
-
MODE Characteristics: Newer project launched in 2024, focused on modular DeFi Layer 2 infrastructure, lower market capitalization, higher volatility profile
-
KAVA Characteristics: Established project since 2019, cross-chain DeFi platform with lending focus, longer operational track record, relatively higher trading volume
✅ Investment Considerations:
-
New Investors: Consider starting with smaller position sizes, prioritize understanding project fundamentals, and maintain diversification across multiple assets
-
Experienced Investors: Evaluate risk-adjusted return profiles, assess technical development progress, monitor ecosystem growth metrics, and consider portfolio allocation strategies
-
Institutional Investors: Conduct comprehensive due diligence on liquidity depth, regulatory compliance frameworks, custody solutions, and risk management protocols
⚠️ Risk Disclosure: Cryptocurrency markets exhibit high volatility. This content does not constitute investment advice.
VII. FAQ
Q1: What are the main differences between MODE and KAVA in terms of their core technology?
MODE is a Modular DeFi Layer 2 built on Optimism infrastructure, focusing on creating economic systems that reward network growth contributions, while KAVA operates as a cross-chain decentralized Layer 1 platform providing collateral lending and stablecoin services. MODE represents newer Layer 2 scalability solutions launched in 2024, whereas KAVA has been operating since 2019 as an established cross-chain DeFi hub enabling interoperability between different blockchain networks for lending and borrowing applications.
Q2: How do the current market conditions differ between MODE and KAVA?
As of February 1, 2026, KAVA demonstrates significantly higher trading volume at $371,598.18 compared to MODE's $16,354.73, indicating greater market liquidity and activity. KAVA's current price of $0.06673 is substantially higher than MODE's $0.0003206, reflecting different market capitalizations and investor interest levels. Both tokens have experienced severe declines exceeding 99% from their respective all-time highs, but KAVA maintains a longer operational track record and broader market participation.
Q3: What investment strategies are recommended for MODE vs KAVA allocation?
Conservative investors may consider allocating 10-20% to MODE and 80-90% to KAVA, favoring the more established project with longer operational history and higher liquidity. Aggressive investors with higher risk tolerance might consider 40-50% MODE and 50-60% KAVA allocation to balance early-stage opportunity exposure with diversification benefits. All investors should implement risk management strategies including stablecoin allocation, portfolio diversification, and position sizing appropriate to their risk tolerance and investment timeframe.
Q4: What are the key risk factors investors should consider for each project?
MODE faces risks including extreme price volatility (99% decline from peak), limited trading volume affecting liquidity, dependency on Optimism Layer 2 infrastructure, and shorter operational history since 2024. KAVA's primary risks include substantial historical price decline despite longer market presence, cross-chain protocol complexity, smart contract security considerations, and exposure to evolving DeFi regulatory frameworks. Both projects operate in an environment characterized by an Extreme Fear market sentiment index of 14, indicating challenging market conditions.
Q5: How do the price predictions for 2026-2031 compare between MODE and KAVA?
MODE's conservative price range for 2026 is projected at $0.000248 - $0.000322, potentially reaching $0.000653 - $0.000770 by 2031 in optimistic scenarios, representing approximately 103% growth from current levels. KAVA's conservative 2026 forecast ranges from $0.0604 - $0.0657, potentially expanding to $0.129 - $0.146 by 2031, representing approximately 93% growth. KAVA demonstrates higher absolute price targets but similar percentage growth projections, with both forecasts depending on factors including institutional adoption, ecosystem development, and broader market conditions.
Q6: Which project is better suited for institutional investors?
KAVA may present more favorable characteristics for institutional investors due to higher trading volume ($371,598.18 vs $16,354.73), longer operational track record since 2019, and greater market liquidity facilitating larger position management. Institutional investors typically prioritize risk control, liquidity sufficiency, and regulatory compliance frameworks. However, institutional investors should conduct comprehensive due diligence on both projects, evaluating custody solutions, compliance frameworks, technical audit reports, and risk management protocols before making allocation decisions.
Q7: What role do macroeconomic factors play in MODE vs KAVA investment decisions?
Macroeconomic factors significantly influence both projects through institutional capital flows, regulatory developments, and broader crypto market cycles. The current Extreme Fear market sentiment (index of 14) reflects challenging conditions affecting all crypto assets. Investors should monitor factors including potential ETF developments, regulatory framework evolution across jurisdictions, institutional adoption trends, and technological innovation cycles. Both MODE and KAVA operate within ecosystems where market attention, technology advancement, and capital allocation patterns driven by macroeconomic conditions substantially impact potential value trajectories.
Q8: What are the primary use cases and ecosystem applications for each project?
MODE focuses on building decentralized finance applications within the Optimism Layer 2 ecosystem, rewarding users who contribute to network growth through its economic model. KAVA provides cross-chain money market functionality, enabling users to leverage cryptocurrency holdings for borrowing and lending across different blockchain networks, with emphasis on collateral management and stablecoin services. MODE targets users seeking Layer 2 DeFi infrastructure benefits, while KAVA serves users requiring cross-chain asset interoperability and financial leverage tools for portfolio management strategies.
* The information is not intended to be and does not constitute financial advice or any other recommendation of any sort offered or endorsed by Gate.