This comprehensive analysis compares MPH and SNX, two leading decentralized synthetic asset protocols in the crypto market. As of January 2026, SNX dominates with a $142 million market cap and #280 ranking, while MPH holds a smaller $5.67 million position at #1464. The article examines historical price trends, supply mechanisms, institutional adoption, and technological ecosystems to determine superior investment value. MPH offers emerging zero-fee platform potential for risk-tolerant investors, whereas SNX provides established DeFi derivatives presence with greater liquidity and stability. Through detailed price forecasts, risk assessments, and tailored investment strategies for conservative to aggressive investors, this guide addresses critical investment decisions. Both assets face regulatory uncertainties, yet SNX demonstrates better market resilience while MPH presents higher-risk growth opportunities in synthetic asset trading innovation.
Introduction: MPH vs SNX Investment Comparison
In the cryptocurrency market, the comparison between MPH and SNX has consistently been a topic that investors cannot overlook. The two not only exhibit notable differences in market cap ranking, application scenarios, and price performance, but also represent distinct positioning within the crypto asset landscape.
MPH (Morpher): Launched in 2018, this platform has gained market recognition through its unique approach to trading synthetic assets with zero fees and infinite liquidity on Ethereum. As an ERC20 token, MPH powers a distinctive trading platform where all transactions are created and settled in MPH rather than USD or Bitcoin.
SNX (Synthetix): Since its launch in 2018 (formerly known as Havven), it has been positioned as a decentralized protocol for synthetic assets. The Synthetix Network Token supports various synthetic assets including fiat currencies pegged to the US dollar, precious metals, indices, and other cryptocurrencies, making it one of the established players in the DeFi synthetic asset space.
This article will comprehensively analyze the investment value comparison between MPH and SNX, focusing on historical price trends, supply mechanisms, institutional adoption, technological ecosystems, and future outlook, attempting to address the question investors care about most:
"Which is the better buy right now?"
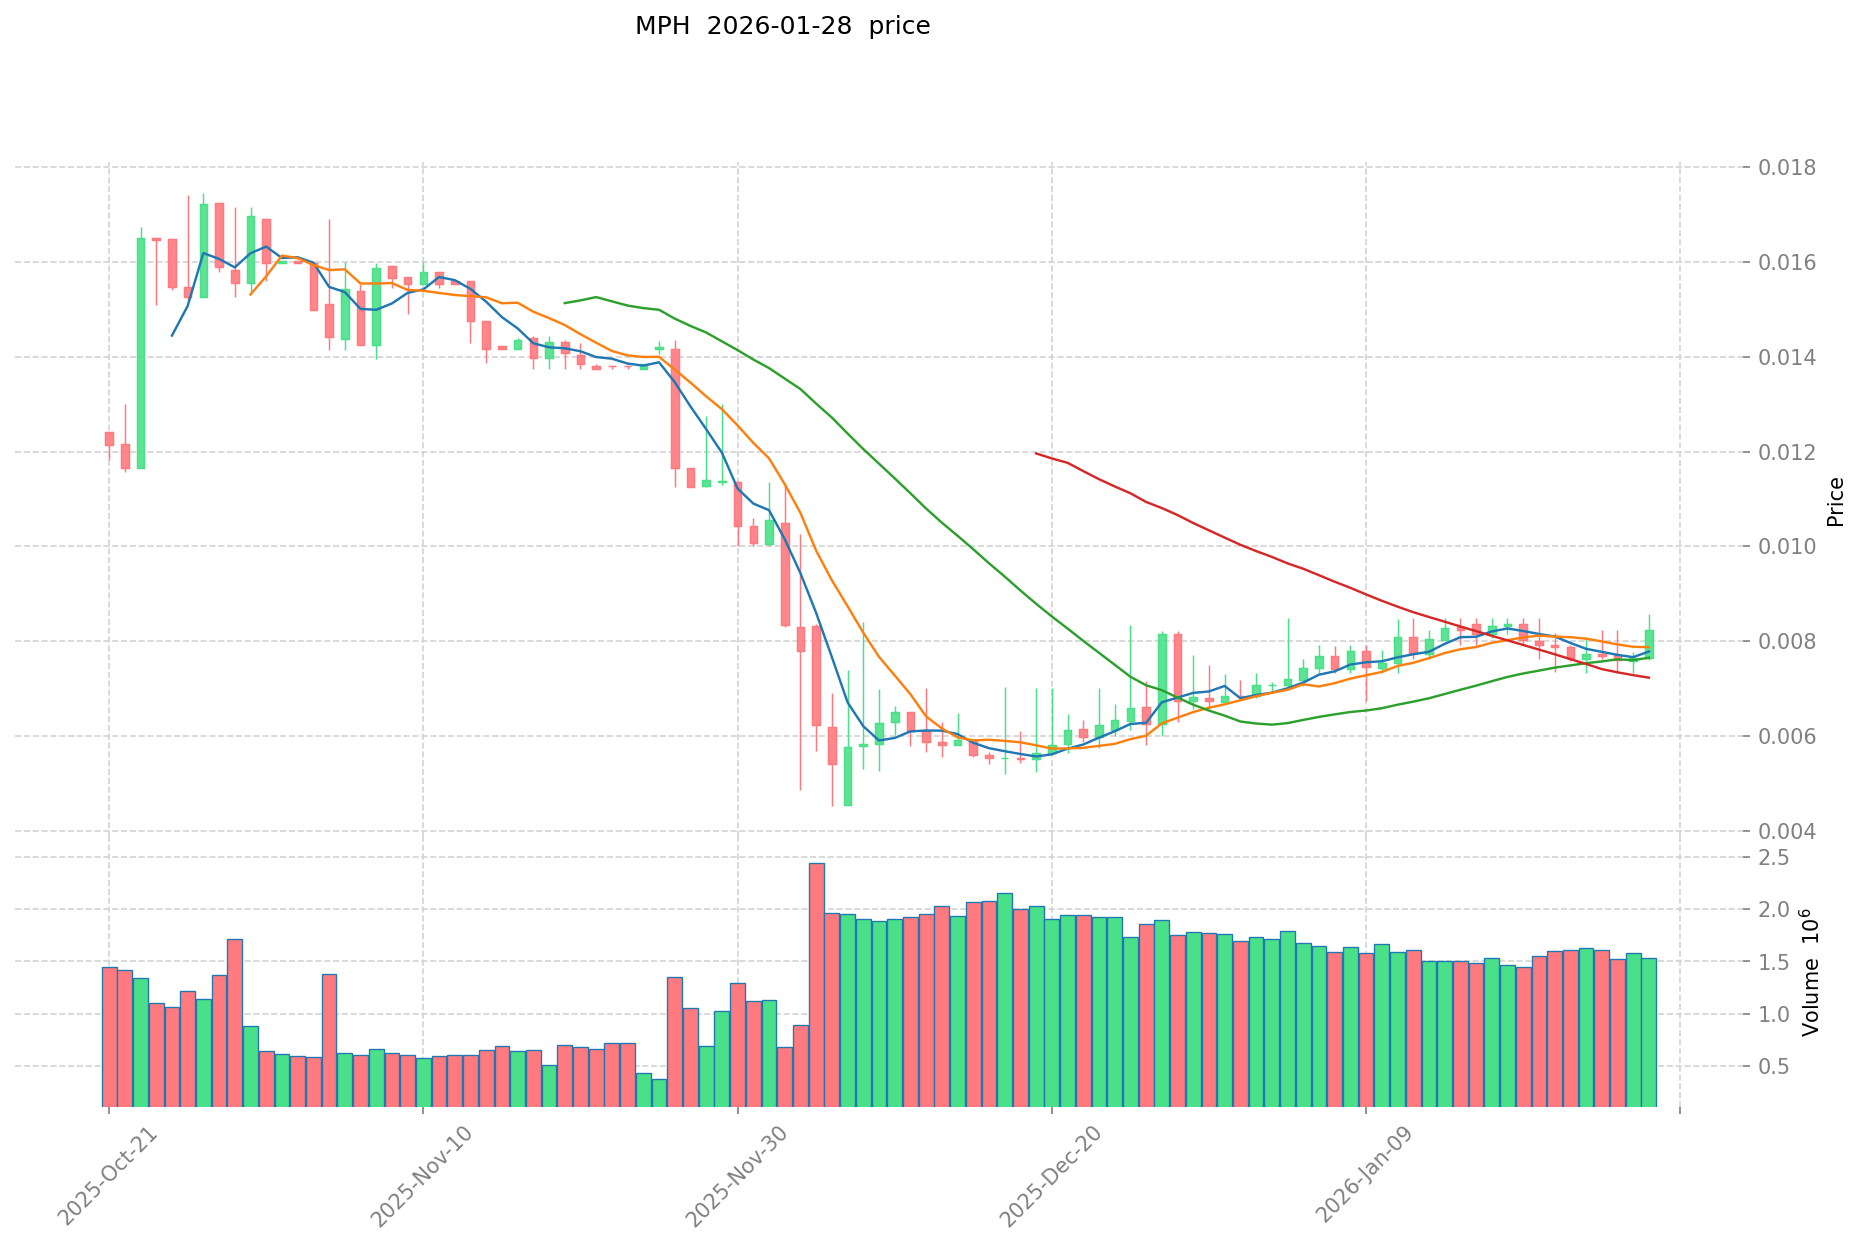
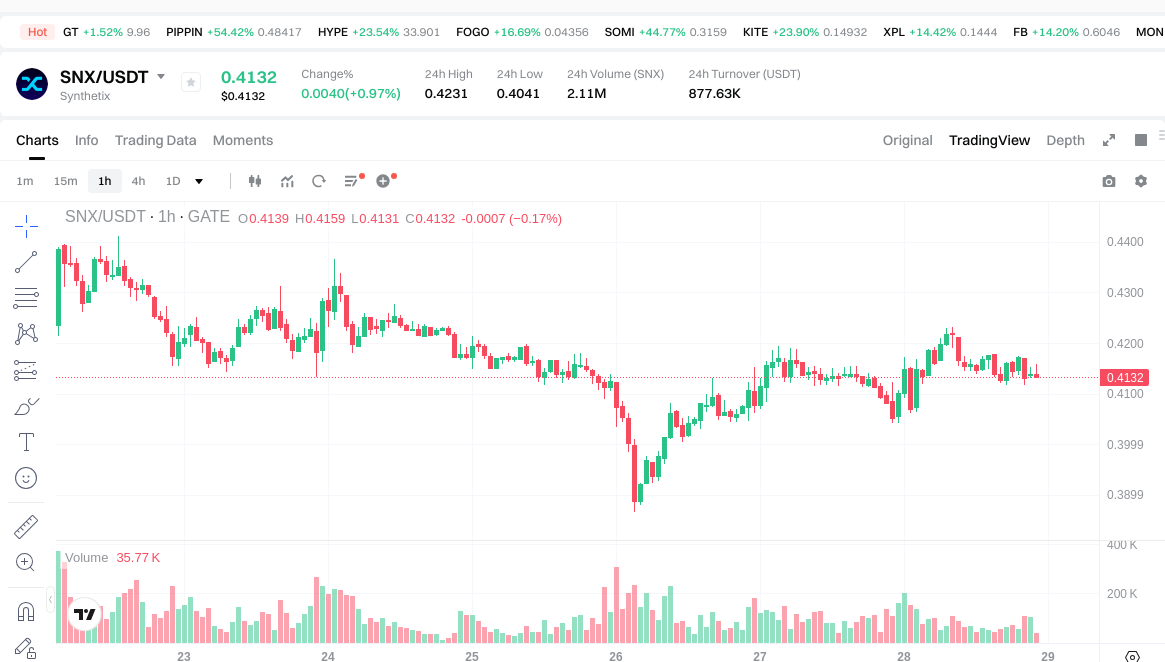
As of January 28, 2026, MPH is ranked #1464 with a price of $0.008086 and a market cap of approximately $5.67 million, while SNX holds the #280 position with a price of $0.4136 and a market cap of around $142 million. These substantial differences in scale and market positioning form the foundation for understanding their respective investment characteristics and potential trajectories.
I. Historical Price Comparison and Current Market Overview
Price History of MPH (Coin A) and SNX (Coin B)
- 2021: MPH recorded a notable price peak at $3.45 on March 20, 2021, representing a significant milestone in its early trading history.
- 2021: SNX experienced substantial market activity with its price reaching $28.53 on February 14, 2021, driven by growing interest in decentralized finance protocols.
- Comparative analysis: Throughout the 2021-2025 market cycle, MPH declined from its peak of $3.45 to a low of $0.00457138 recorded on December 7, 2025, while SNX decreased from $28.53 to $0.0347864 observed on January 6, 2019.
Current Market Status (January 28, 2026)
- MPH current price: $0.008086
- SNX current price: $0.4136
- 24-hour trading volume: MPH $12,350.37 vs SNX $863,597.77
- Market sentiment index (Fear & Greed Index): 29 (Fear)
View real-time prices:
II. Core Factors Influencing MPH vs SNX Investment Value
Supply Mechanism Comparison (Tokenomics)
- MPH: Supply mechanism details are not available in the reference materials.
- SNX: Supply mechanism details are not available in the reference materials.
- 📌 Historical patterns: The relationship between supply mechanisms and price cycle dynamics requires further data analysis.
Institutional Adoption and Market Application
- Institutional holdings: Current data does not provide clear evidence of institutional preference between the two assets.
- Enterprise adoption: Application comparisons in cross-border payments, settlements, and investment portfolios are not detailed in available sources.
- National policies: Regulatory attitudes toward both assets vary across jurisdictions, though specific comparative analysis is limited in the reference materials.
Technology Development and Ecosystem Building
- MPH technology upgrades: Technical innovation and market demand appear to be relevant factors, though specific upgrade details are not provided.
- SNX technology development: Cost management and business growth have been noted as value drivers, particularly in the derivatives sector, where SNX has been referenced as a leading project in the DeFi space.
- Ecosystem comparison: SNX has been mentioned in the context of DeFi derivatives applications. The reference materials note that derivatives represent a significant sector within decentralized finance, with SNX positioned as a prominent project in this category. Specific comparisons regarding DeFi, NFT, payment systems, and smart contract implementations require additional detailed analysis.
Macroeconomic and Market Cycles
- Performance in inflationary environments: The anti-inflation properties of both assets remain under evaluation based on available data.
- Macroeconomic monetary policy: Interest rates and dollar index movements may influence both assets, though specific comparative impacts are not detailed in the reference materials.
- Geopolitical factors: Cross-border transaction demand and international situations may affect valuations, but detailed analysis requires further investigation.
III. 2026-2031 Price Forecast: MPH vs SNX
Short-term Forecast (2026)
- MPH: Conservative $0.00510489 - $0.008103 | Optimistic $0.008103 - $0.01029081
- SNX: Conservative $0.293301 - $0.4131 | Optimistic $0.4131 - $0.528768
Mid-term Forecast (2028-2029)
- MPH may enter a gradual growth phase, with projected price range of $0.009185868714 - $0.017166092159287
- SNX may enter a moderate expansion phase, with projected price range of $0.36261918 - $0.76683596022
- Key drivers: institutional capital inflows, ETF developments, ecosystem growth
Long-term Forecast (2030-2031)
- MPH: Baseline scenario $0.007884746256568 - $0.014585176205268 | Optimistic scenario $0.014585176205268 - $0.019789167075308
- SNX: Baseline scenario $0.38335066244937 - $0.67610346111 | Optimistic scenario $0.67610346111 - $0.92288122441515
View detailed price predictions for MPH and SNX
Disclaimer
MPH:
| Year |
Predicted High Price |
Predicted Average Price |
Predicted Low Price |
Price Change |
| 2026 |
0.01029081 |
0.008103 |
0.00510489 |
0 |
| 2027 |
0.01168006935 |
0.009196905 |
0.00892099785 |
13 |
| 2028 |
0.0135700333275 |
0.010438487175 |
0.009185868714 |
29 |
| 2029 |
0.017166092159287 |
0.01200426025125 |
0.009963536008537 |
48 |
| 2030 |
0.016335397349901 |
0.014585176205268 |
0.010501326867793 |
80 |
| 2031 |
0.019789167075308 |
0.015460286777584 |
0.007884746256568 |
91 |
SNX:
| Year |
Predicted High Price |
Predicted Average Price |
Predicted Low Price |
Price Change |
| 2026 |
0.528768 |
0.4131 |
0.293301 |
0 |
| 2027 |
0.5651208 |
0.470934 |
0.45680598 |
13 |
| 2028 |
0.652714524 |
0.5180274 |
0.36261918 |
25 |
| 2029 |
0.76683596022 |
0.585370962 |
0.55024870428 |
41 |
| 2030 |
0.743713807221 |
0.67610346111 |
0.5544048381102 |
63 |
| 2031 |
0.92288122441515 |
0.7099086341655 |
0.38335066244937 |
71 |
IV. Investment Strategy Comparison: MPH vs SNX
Long-term vs Short-term Investment Strategies
- MPH: May be suitable for investors focused on emerging synthetic asset trading platforms with higher risk tolerance, seeking potential growth opportunities in niche DeFi applications
- SNX: May be suitable for investors interested in established DeFi protocols with broader synthetic asset ecosystems, particularly those focusing on decentralized derivatives markets
Risk Management and Asset Allocation
- Conservative investors: MPH 10-15% vs SNX 85-90%
- Aggressive investors: MPH 30-40% vs SNX 60-70%
- Hedging tools: stablecoin allocation, options strategies, cross-asset portfolio diversification
V. Potential Risk Comparison
Market Risks
- MPH: Lower liquidity with 24-hour trading volume of approximately $12,350, ranked #1464 by market capitalization, potentially facing higher volatility and limited market depth
- SNX: Moderate liquidity with 24-hour trading volume of approximately $863,598, ranked #280 by market capitalization, subject to broader DeFi market sentiment fluctuations
Technical Risks
- MPH: Platform scalability considerations, network stability factors requiring ongoing monitoring
- SNX: Protocol complexity, smart contract security considerations, ecosystem dependency risks
Regulatory Risks
- Global regulatory frameworks continue to evolve for synthetic asset platforms and DeFi protocols, with potential differential impacts on both projects depending on jurisdictional approaches to decentralized derivatives and tokenized assets
VI. Conclusion: Which Is the Better Buy?
📌 Investment Value Summary:
- MPH advantages: Early-stage synthetic asset trading platform with zero-fee model, potential for growth in niche market segments, ERC20 token standard compatibility
- SNX advantages: Established position in DeFi derivatives sector, broader synthetic asset coverage including fiat currencies and commodities, relatively higher market capitalization and liquidity
✅ Investment Recommendations:
- Novice investors: Consider SNX for relatively established market position and broader ecosystem participation, with smaller experimental allocation to MPH
- Experienced investors: Evaluate portfolio diversification between established DeFi protocols (SNX) and emerging platforms (MPH) based on individual risk profiles and market cycle positioning
- Institutional investors: Conduct comprehensive due diligence on liquidity requirements, regulatory compliance frameworks, and ecosystem maturity before allocation decisions
⚠️ Risk Disclaimer: Cryptocurrency markets exhibit extreme volatility. This article does not constitute investment advice.
VII. FAQ
Q1: What is the main difference between MPH and SNX in terms of their synthetic asset approach?
MPH operates as a zero-fee synthetic asset trading platform where all transactions are created and settled directly in MPH tokens on Ethereum, focusing on a unique infinite liquidity model. SNX, on the other hand, functions as a decentralized protocol supporting a broader range of synthetic assets including fiat currencies, precious metals, indices, and cryptocurrencies, with SNX tokens serving as collateral for minting these synthetic assets within a more established DeFi derivatives ecosystem.
Q2: How do the current market positions of MPH and SNX differ significantly?
As of January 28, 2026, MPH ranks #1464 with a market cap of approximately $5.67 million and a price of $0.008086, while SNX holds the #280 position with a market cap around $142 million and a price of $0.4136. The substantial disparity extends to liquidity, with MPH's 24-hour trading volume at $12,350.37 compared to SNX's $863,597.77, indicating SNX has established significantly greater market presence and institutional participation.
Q3: Which asset has shown better historical price resilience?
Both assets have experienced substantial declines from their historical peaks. MPH dropped from $3.45 (March 2021) to a low of $0.00457138 (December 2025), representing approximately a 99.87% decline. SNX decreased from $28.53 (February 2021) to $0.0347864 (January 2019), though the current price of $0.4136 shows better recovery positioning. The data suggests SNX has demonstrated relatively better price stability and market recovery capacity compared to MPH.
Q4: What are the projected price ranges for both assets by 2031?
According to forecasts, MPH's baseline scenario for 2031 ranges from $0.007884746256568 to $0.014585176205268, with an optimistic scenario reaching $0.019789167075308, representing a potential 91% increase from current levels. SNX's baseline scenario for 2031 projects a range of $0.38335066244937 to $0.67610346111, with an optimistic scenario extending to $0.92288122441515, indicating a potential 71% increase. Both projections assume continued ecosystem development and favorable market conditions.
Q5: How should portfolio allocation differ between conservative and aggressive investors?
Conservative investors may consider allocating 10-15% to MPH and 85-90% to SNX, prioritizing the established market position and higher liquidity of SNX while maintaining limited exposure to MPH's higher-risk growth potential. Aggressive investors might increase MPH allocation to 30-40% versus 60-70% for SNX, accepting greater volatility in pursuit of potentially higher returns from MPH's emerging platform status. Both strategies should incorporate hedging tools including stablecoin allocations and cross-asset diversification.
Q6: What are the primary risks associated with investing in MPH versus SNX?
MPH faces significant liquidity risk with limited trading volume ($12,350 daily), higher volatility due to lower market capitalization, and platform scalability uncertainties as an emerging project. SNX, while more established, carries risks related to smart contract complexity, protocol security considerations, and dependency on broader DeFi market sentiment. Both assets face evolving regulatory frameworks affecting synthetic assets and decentralized derivatives, though SNX's larger ecosystem may provide better regulatory engagement capacity.
Q7: Which asset is more suitable for institutional investors?
SNX appears more suitable for institutional investors due to its relatively higher market capitalization ($142 million), substantially greater liquidity (70x higher trading volume), established position in DeFi derivatives (#280 ranking), and broader synthetic asset ecosystem. MPH's limited liquidity, lower market cap ($5.67 million), and #1464 ranking present challenges for institutional position building without significant price impact. However, institutional investors conducting comprehensive due diligence may allocate smaller experimental positions to MPH as part of diversified early-stage DeFi exposure strategies.
* The information is not intended to be and does not constitute financial advice or any other recommendation of any sort offered or endorsed by Gate.