This comprehensive analysis compares NEO and TRX, two leading smart contract platforms with distinct positioning in the cryptocurrency market. NEO, launched in 2014, emphasizes regulatory compliance and enterprise-grade applications through its fixed supply tokenomics and dual-token model generating passive GAS rewards. TRX, introduced in 2017, positions itself as a high-throughput DeFi infrastructure platform with active ecosystem development on Gate. The article examines historical price trends, tokenomics mechanisms, institutional adoption, and technological ecosystems to help investors understand which asset better suits their investment objectives. Through 2026-2031 price forecasts, investment strategies, and risk analysis, this guide addresses whether NEO's governance-focused infrastructure or TRX's DeFi-driven utility offers superior investment value.
Introduction: Investment Comparison Between NEO and TRX
In the cryptocurrency market, the comparison between NEO and TRX has been a recurring topic among investors. These two assets exhibit notable differences in market capitalization rankings, application scenarios, and price performance, representing distinct positioning within the crypto asset landscape.
NEO (NEO): Launched in 2014, it has gained market recognition through its focus on building next-generation internet infrastructure via distributed networks, enabling developers to digitalize and automate asset management through smart contracts.
TRON (TRX): Since its introduction in 2017, it has been positioning itself as a blockchain infrastructure platform. In 2022, TRON entered into a partnership with Dominica as its officially designated national-level blockchain infrastructure, becoming a large-scale public chain collaborating with a sovereign state.
This article will comprehensively analyze the investment value comparison between NEO and TRX, covering historical price trends, supply mechanisms, institutional adoption, technological ecosystems, and future projections, attempting to address investors' most pressing question:
"Which is the better buy right now?"
I. Historical Price Comparison and Current Market Status
Historical Price Trends of NEO (Coin A) and TRX (Coin B)
- 2018: NEO reached a price peak of $198.38 on January 15, 2018, during the broader cryptocurrency bull market, representing one of its most significant valuation periods.
- 2024: TRX achieved its all-time high of $0.431288 on December 4, 2024, marking a notable milestone in its price trajectory.
- Comparative analysis: During market cycles, NEO experienced substantial volatility, declining from its historical high of $198.38 to a low of $0.078349 on October 21, 2016, while TRX fluctuated between its historical low of $0.00180434 on November 12, 2017, and its peak in late 2024.
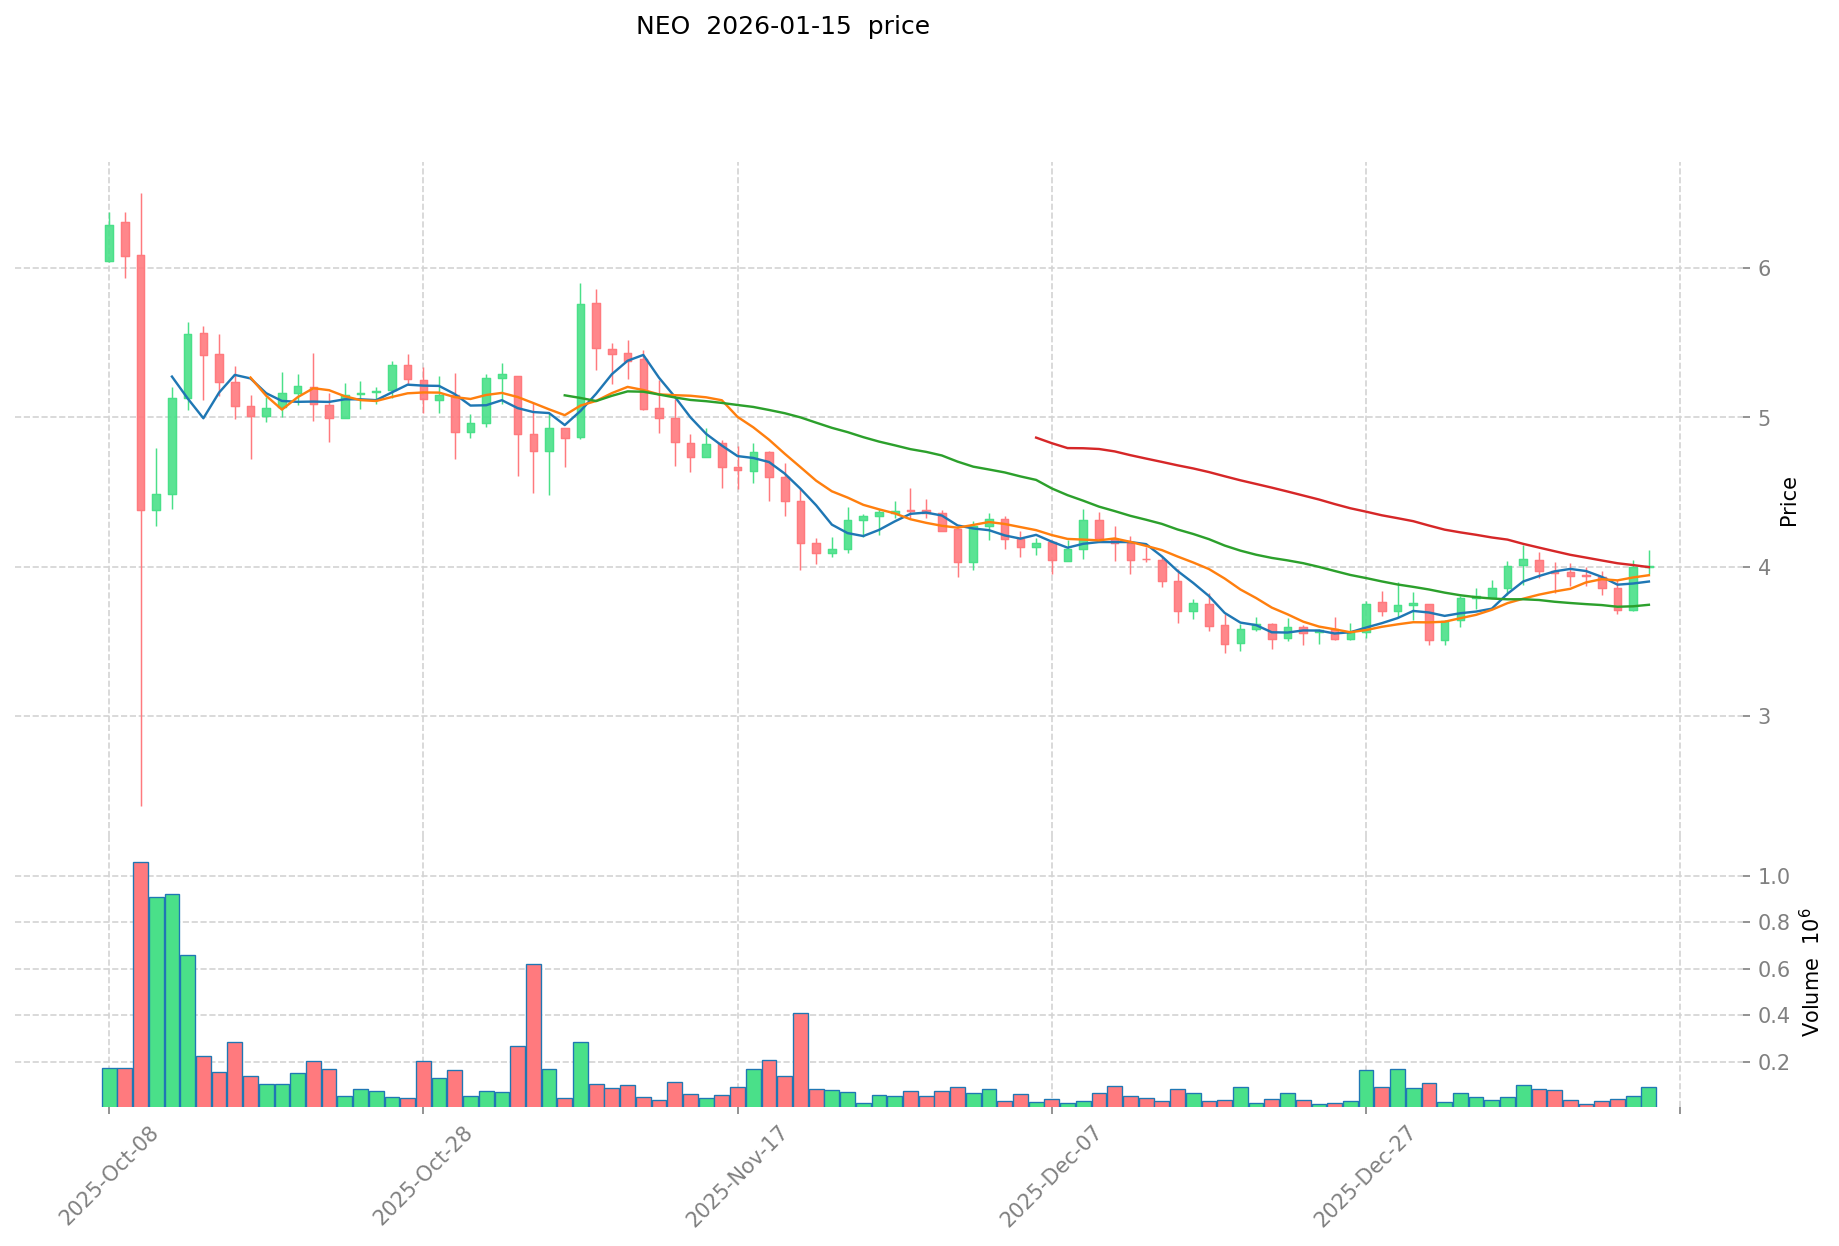
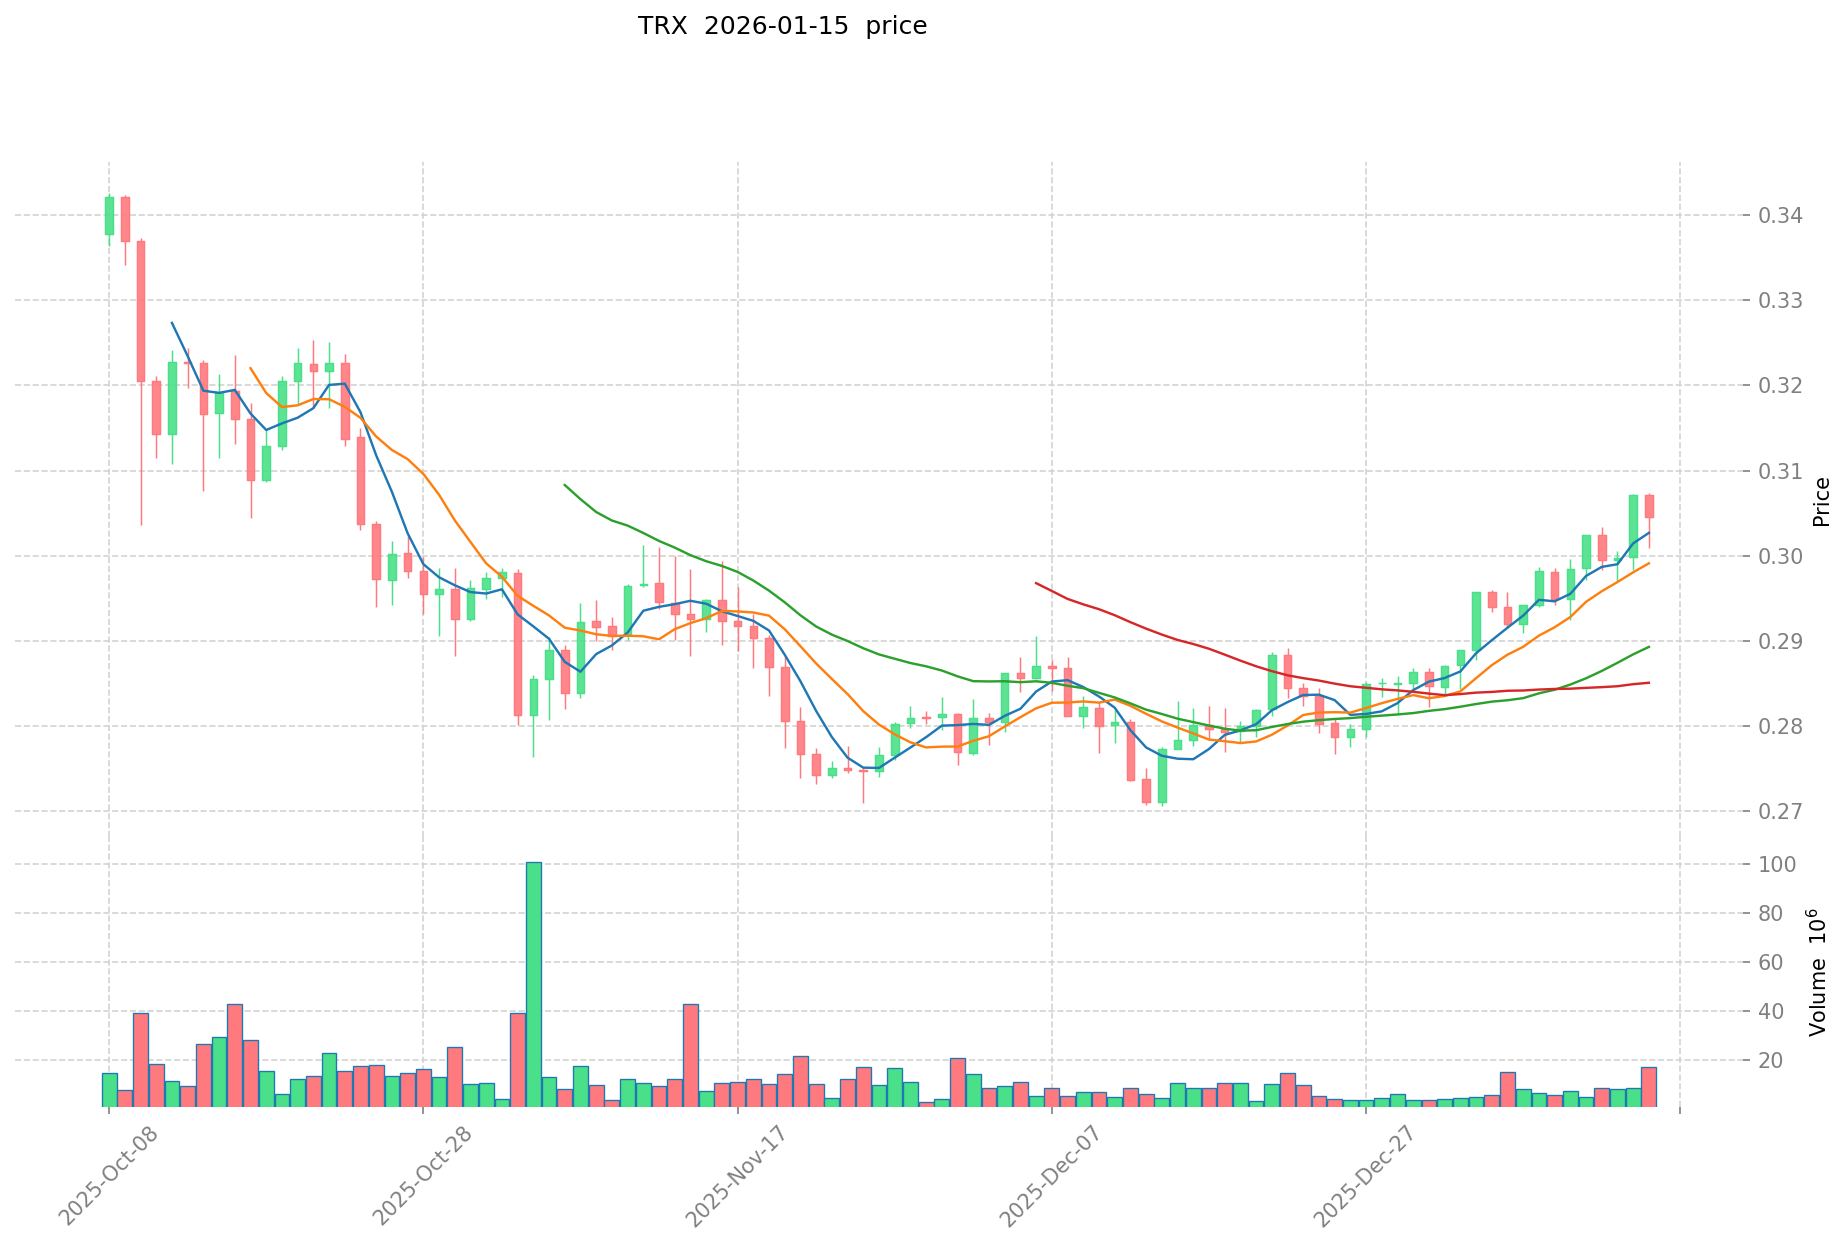
Current Market Status (January 15, 2026)
- NEO current price: $4.001
- TRX current price: $0.30497
- 24-hour trading volume: NEO $281,178.16 vs TRX $7,079,993.70
- Market sentiment index (Fear & Greed Index): 61 (Greed)
Click to view real-time prices:
II. Core Factors Influencing NEO vs TRX Investment Value
Supply Mechanism Comparison (Tokenomics)
- NEO: Features a fixed maximum supply of 100 million tokens with a dual-token model (NEO and GAS). NEO tokens generate GAS through staking, creating a passive income mechanism. The supply is non-inflationary, with all tokens pre-mined during genesis.
- TRX: Operates with a different economic model that includes token burning mechanisms and staking rewards. The network uses a DPoS consensus that allows token holders to participate in governance and earn rewards through delegation to Super Representatives.
- 📌 Historical Pattern: NEO's fixed supply model has historically supported price stability during market downturns, while TRX's utility-driven tokenomics has been influenced by network usage and DeFi activity growth.
Institutional Adoption and Market Applications
- Institutional Holdings: Both projects have received backing from blockchain investment funds, with NEO Foundation support including institutions like Fengshui Capital and Linear Capital, while TRX has attracted attention through its DeFi ecosystem expansion.
- Enterprise Adoption: NEO positions itself with a strong governance model and ecosystem development focus, particularly in smart contract applications. TRX has established significant presence in decentralized finance through platforms like JustLend and SunSwap, demonstrating practical application in lending and exchange services.
- Regulatory Environment: Both projects face varying regulatory attitudes across jurisdictions. TRX has encountered regulatory scrutiny from the U.S. SEC regarding securities classification, which has impacted market sentiment. NEO's compliance-focused approach has generally received more favorable regulatory consideration.
Technology Development and Ecosystem Building
- NEO Technical Development: Supports smart contract development with a focus on regulatory compliance and digital identity. The platform utilizes a DPoS consensus mechanism similar to EOS, emphasizing transaction speed and developer accessibility through Java support.
- TRX Technical Progress: The TRON network has achieved high transaction throughput and low fees through its DPoS architecture. The ecosystem includes significant DeFi infrastructure with SunSwap (decentralized exchange), JustLend (lending protocol), and growing GameFi applications.
- Ecosystem Comparison: TRX demonstrates stronger DeFi ecosystem development with substantial total value locked in protocols. NEO maintains focus on enterprise-grade applications and governance frameworks. Both support smart contracts, though TRX shows higher transaction volume and network activity. NFT marketplaces exist on both chains, with TRON's APENFT Marketplace providing infrastructure for digital collectibles.
Macroeconomic Environment and Market Cycles
- Performance Under Inflation: Both assets demonstrate sensitivity to broader cryptocurrency market dynamics and Bitcoin price movements, which typically serve as benchmark indicators for the sector.
- Macroeconomic Monetary Policy: Interest rate changes and U.S. dollar strength influence both assets through their impact on risk appetite and capital flows into cryptocurrency markets. Higher interest rates generally reduce speculative demand for crypto assets.
- Geopolitical Factors: Cross-border payment utility and international regulatory developments affect both projects. TRX's focus on content distribution and financial services positions it for potential growth in regions with emerging digital payment needs. NEO's emphasis on regulatory compliance may provide advantages in jurisdictions requiring stricter oversight frameworks.
III. 2026-2031 Price Forecast: NEO vs TRX
Short-term Forecast (2026)
- NEO: Conservative $2.59-$3.99 | Optimistic $3.99-$4.23
- TRX: Conservative $0.24-$0.31 | Optimistic $0.31-$0.37
Mid-term Forecast (2028-2029)
- NEO may enter a growth phase, with estimated prices ranging from $3.79 to $8.05
- TRX may enter a consolidation phase, with estimated prices ranging from $0.20 to $0.62
- Key drivers: institutional capital inflows, ETF developments, ecosystem expansion
Long-term Forecast (2030-2031)
- NEO: Baseline scenario $5.05-$6.92 | Optimistic scenario $6.92-$8.30
- TRX: Baseline scenario $0.37-$0.57 | Optimistic scenario $0.57-$0.90
View detailed price predictions for NEO and TRX
Disclaimer
NEO:
| Year |
Predicted High Price |
Predicted Average Price |
Predicted Low Price |
Price Change |
| 2026 |
4.22516 |
3.986 |
2.5909 |
0 |
| 2027 |
5.6246446 |
4.10558 |
2.9970734 |
2 |
| 2028 |
6.713854974 |
4.8651123 |
3.794787594 |
21 |
| 2029 |
8.04738225543 |
5.789483637 |
4.97895592782 |
44 |
| 2030 |
8.302119535458 |
6.918432946215 |
5.05045605073695 |
72 |
| 2031 |
8.142995577695055 |
7.6102762408365 |
5.707707180627375 |
90 |
TRX:
| Year |
Predicted High Price |
Predicted Average Price |
Predicted Low Price |
Price Change |
| 2026 |
0.3690863 |
0.30503 |
0.244024 |
0 |
| 2027 |
0.5022166435 |
0.33705815 |
0.1988643085 |
10 |
| 2028 |
0.6084742252875 |
0.41963739675 |
0.3482990393025 |
37 |
| 2029 |
0.6168669732225 |
0.51405581101875 |
0.313574044721437 |
68 |
| 2030 |
0.701172126229575 |
0.565461392120625 |
0.373204518799612 |
85 |
| 2031 |
0.899309798028642 |
0.6333167591751 |
0.398989558280313 |
107 |
IV. Investment Strategy Comparison: NEO vs TRX
Long-term vs Short-term Investment Strategies
- NEO: Suitable for investors focused on governance-oriented blockchain infrastructure and enterprise-grade smart contract platforms with compliance considerations. The fixed supply model and dual-token mechanism may appeal to those seeking passive income generation through GAS rewards.
- TRX: Suitable for investors interested in DeFi ecosystem growth, high-throughput networks, and content distribution platforms. The active development in decentralized finance protocols and gaming applications positions it for utility-driven value appreciation.
Risk Management and Asset Allocation
- Conservative investors: NEO 40% vs TRX 60% - This allocation reflects TRX's broader ecosystem activity while maintaining exposure to NEO's compliance-focused positioning.
- Aggressive investors: NEO 30% vs TRX 70% - Higher TRX allocation captures potential upside from DeFi expansion and network utilization growth.
- Hedging tools: Stablecoin allocation for liquidity management, options strategies for downside protection, cross-asset portfolio diversification with Bitcoin and Ethereum as benchmark correlations.
V. Potential Risk Comparison
Market Risks
- NEO: Price volatility influenced by broader cryptocurrency market cycles, with historical price fluctuations demonstrating sensitivity to Bitcoin movements and overall market sentiment shifts. Lower trading volume compared to major assets may result in liquidity constraints during market stress.
- TRX: Market perception affected by regulatory developments and competitive pressures from other Layer-1 networks. Price sensitivity to DeFi sector performance and changes in total value locked within ecosystem protocols.
Technical Risks
- NEO: Network scalability considerations as transaction demand grows, dependency on ecosystem development pace for sustained utility value. Smart contract platform competition from established networks may impact developer adoption.
- TRX: Network centralization concerns related to Super Representative structure and voting mechanisms. Security considerations for rapidly expanding DeFi protocols and smart contract vulnerabilities in ecosystem applications.
Regulatory Risks
- Global regulatory frameworks present differential impacts on both assets. TRX has faced securities classification scrutiny from regulatory authorities, particularly regarding token distribution and platform operations. NEO's compliance-oriented approach may provide advantages in jurisdictions implementing stricter oversight requirements. Cross-border payment applications and financial service offerings face evolving regulatory standards that affect both projects' operational flexibility and market access.
VI. Conclusion: Which Is the Better Buy?
📌 Investment Value Summary:
- NEO Advantages: Fixed supply tokenomics with non-inflationary characteristics, dual-token model enabling passive income generation, compliance-focused positioning for enterprise adoption, established governance framework supporting long-term sustainability.
- TRX Advantages: Active DeFi ecosystem with substantial protocol development, high transaction throughput supporting scalability requirements, lower transaction costs facilitating network usage, diverse application scenarios spanning decentralized finance and content distribution.
✅ Investment Recommendations:
- Beginning investors: Consider balanced exposure to both assets within a diversified cryptocurrency portfolio, starting with smaller position sizes to understand volatility patterns. Utilize dollar-cost averaging to mitigate timing risks and maintain stablecoin reserves for market opportunities.
- Experienced investors: Evaluate allocation based on risk tolerance and sector thesis—higher NEO weighting for compliance-driven growth scenarios, increased TRX exposure for DeFi ecosystem expansion plays. Implement risk management through position sizing relative to total portfolio and correlation analysis with broader crypto market benchmarks.
- Institutional investors: Conduct thorough due diligence on regulatory positioning, custody solutions, and liquidity profiles. Consider NEO for portfolios emphasizing governance frameworks and regulatory clarity, while TRX may fit strategies targeting DeFi infrastructure growth and network utility metrics.
⚠️ Risk Disclosure: Cryptocurrency markets demonstrate elevated volatility characteristics. This analysis does not constitute investment advice. Market participants should conduct independent research and consider individual risk tolerance before making investment decisions.
VII. FAQ
Q1: What is the fundamental difference between NEO and TRX's tokenomics models?
NEO operates with a fixed maximum supply of 100 million tokens and a dual-token system (NEO/GAS), while TRX utilizes a dynamic economic model with token burning mechanisms and staking rewards. NEO's non-inflationary structure generates passive income through GAS distribution to holders, creating a predictable supply schedule. TRX employs a DPoS consensus mechanism that enables token holders to participate in network governance by delegating to Super Representatives, with rewards tied to network participation rather than holding alone.
Q2: Which asset demonstrates stronger ecosystem development currently?
TRX shows stronger DeFi ecosystem development with substantial total value locked across protocols like JustLend and SunSwap, higher transaction volume, and more active network usage. The TRON network has established significant presence in decentralized finance, gaming applications, and NFT marketplaces through APENFT. NEO maintains focus on enterprise-grade applications with compliance-oriented smart contract infrastructure and regulatory frameworks, positioning itself for institutional adoption rather than retail DeFi activity.
Q3: How do regulatory risks differ between NEO and TRX?
TRX has faced securities classification scrutiny from U.S. regulatory authorities, particularly regarding token distribution practices and platform operations, which has created market uncertainty. NEO's compliance-focused approach and emphasis on regulatory clarity has generally received more favorable consideration from oversight bodies. For cross-border payment applications and financial services, both projects face evolving regulatory standards, though NEO's governance framework may provide advantages in jurisdictions implementing stricter compliance requirements.
Q4: What are the projected price ranges for both assets through 2031?
For NEO, short-term 2026 forecasts range from $2.59-$4.23, mid-term 2028-2029 estimates span $3.79-$8.05, and long-term 2030-2031 projections reach $5.05-$8.30 in optimistic scenarios. TRX shows 2026 projections of $0.24-$0.37, mid-term 2028-2029 ranges of $0.20-$0.62, and long-term 2030-2031 estimates between $0.37-$0.90. These forecasts depend on factors including institutional capital flows, ecosystem expansion, and broader cryptocurrency market cycles.
Q5: Which asset is more suitable for passive income generation?
NEO is specifically designed for passive income through its dual-token mechanism, where holding NEO tokens automatically generates GAS rewards without additional staking requirements. This creates a straightforward income stream for long-term holders. TRX requires active participation in network governance through delegation to Super Representatives to earn staking rewards, making it suitable for investors willing to engage with network voting mechanisms. The passive nature of NEO's income generation offers simplicity, while TRX's approach provides governance participation alongside potential rewards.
Q6: How do transaction costs and network scalability compare?
TRX demonstrates superior transaction throughput with lower fees, supporting high-volume applications and frequent network usage through its DPoS architecture. This positions TRON favorably for DeFi protocols requiring cost-effective operations and gaming applications with numerous micro-transactions. NEO faces scalability considerations as transaction demand increases, though its focus remains on enterprise-grade applications rather than high-frequency retail transactions. For users prioritizing transaction speed and cost efficiency, TRX offers operational advantages.
Q7: What portfolio allocation strategy balances risk between these assets?
Conservative investors may consider a 40% NEO / 60% TRX allocation, reflecting TRX's broader ecosystem activity while maintaining exposure to NEO's compliance positioning and fixed supply characteristics. Aggressive investors might adopt a 30% NEO / 70% TRX split to capture potential upside from DeFi expansion and network utilization growth. Both strategies should incorporate stablecoin reserves for liquidity management, position sizing relative to total portfolio risk tolerance, and correlation analysis with Bitcoin and Ethereum as benchmark indicators for broader market movements.
Q8: What are the primary technical risks for each platform?
NEO faces network scalability challenges as adoption grows, dependency on ecosystem development pace for sustained utility value, and competitive pressures from established smart contract platforms affecting developer acquisition. TRX encounters network centralization concerns related to Super Representative voting structure, security considerations for rapidly expanding DeFi protocols, and smart contract vulnerabilities within ecosystem applications. Both platforms require ongoing technical development to address these challenges and maintain competitive positioning within the Layer-1 blockchain landscape.
* The information is not intended to be and does not constitute financial advice or any other recommendation of any sort offered or endorsed by Gate.