This comprehensive analysis compares NEON and XTZ, two distinct blockchain platforms with different market positions and technological approaches. NEON, launched in 2023, serves as a cross-chain infrastructure solution bridging Ethereum dApps to Solana, currently trading at $0.0520 with $12.5M market cap. XTZ, established since 2017 as a self-amending blockchain platform, trades at $0.5821 with $624.7M market cap. The article examines historical price trends, current market status, tokenomics, institutional adoption, and technology ecosystems to guide investment decisions. Through 2031 price forecasts and diversified investment strategies, it addresses which platform offers better value for conservative, aggressive, and institutional investors. Risk comparisons highlight NEON's higher volatility and technical scalability concerns versus XTZ's regulatory exposure. Real-time prices and trading data are available on Gate.
Introduction: Investment Comparison Between NEON and XTZ
In the cryptocurrency market, the comparison between NEON vs XTZ has consistently been a topic of interest for investors. The two assets exhibit notable differences in market capitalization ranking, application scenarios, and price performance, representing distinct positioning within the crypto asset landscape.
NEON (NEON): Launched in 2023, it has gained market recognition by providing a low-friction solution enabling Ethereum dApps to function within Solana, bridging the gap between two leading blockchain ecosystems.
XTZ (XTZ): Since its inception in 2017, it has been recognized as a self-amending decentralized blockchain platform, establishing itself as one of the established cryptocurrencies with substantial trading volume and market presence.
This article will comprehensively analyze the investment value comparison of NEON vs XTZ across historical price trends, supply mechanisms, institutional adoption, technical ecosystems, and future projections, attempting to address the question investors care about most:
"Which is the better buy right now?"
I. Historical Price Comparison and Current Market Status
Historical Price Trends of NEON (Coin A) and XTZ (Coin B)
- 2024: NEON reached a historical high of $3.98 on January 2, 2024, reflecting significant market interest during its early trading period.
- 2021: XTZ achieved its all-time high of $9.12 on October 4, 2021, influenced by broader market momentum during the cryptocurrency bull cycle.
- 2025: NEON experienced substantial price decline, recording an all-time low of $0.0505 on December 31, 2025, representing a significant correction from its historical peak.
- 2018: XTZ marked its lowest price point at $0.350476 on December 7, 2018, during the extended crypto market downturn.
- Comparative Analysis: During the recent market cycle, NEON declined from $3.98 to $0.0505, demonstrating high volatility since its launch in July 2023, while XTZ showed relatively more stable price action within its established trading range, declining from $9.12 to current levels over a longer time horizon.
Current Market Status (2026-01-25)
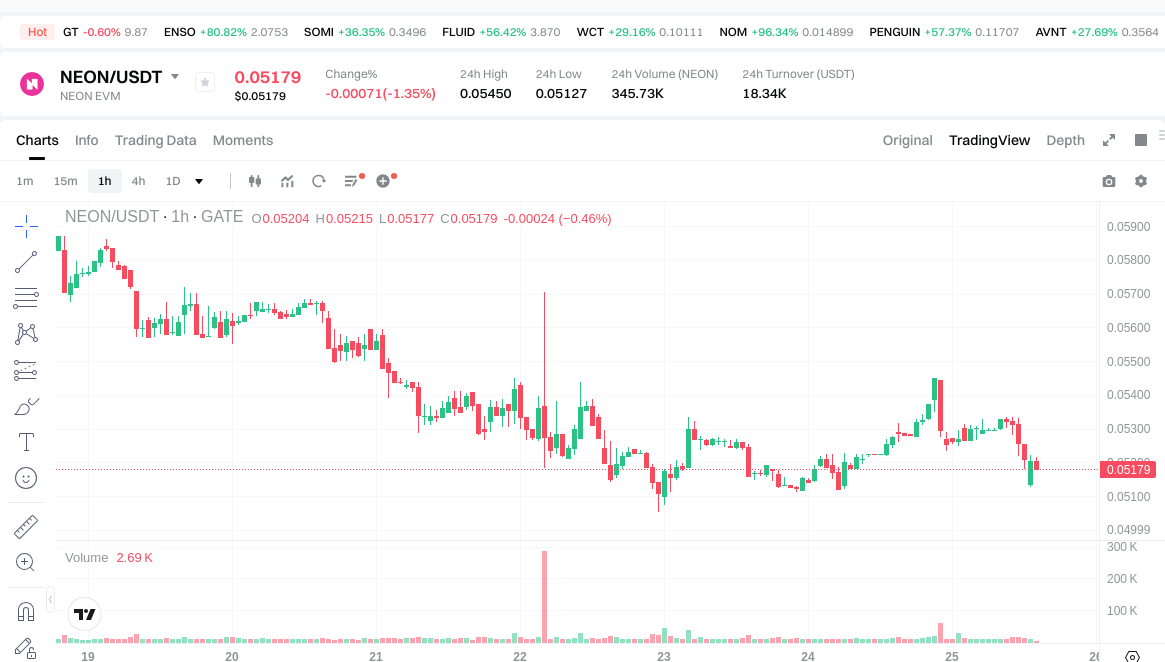
- NEON current price: $0.05203
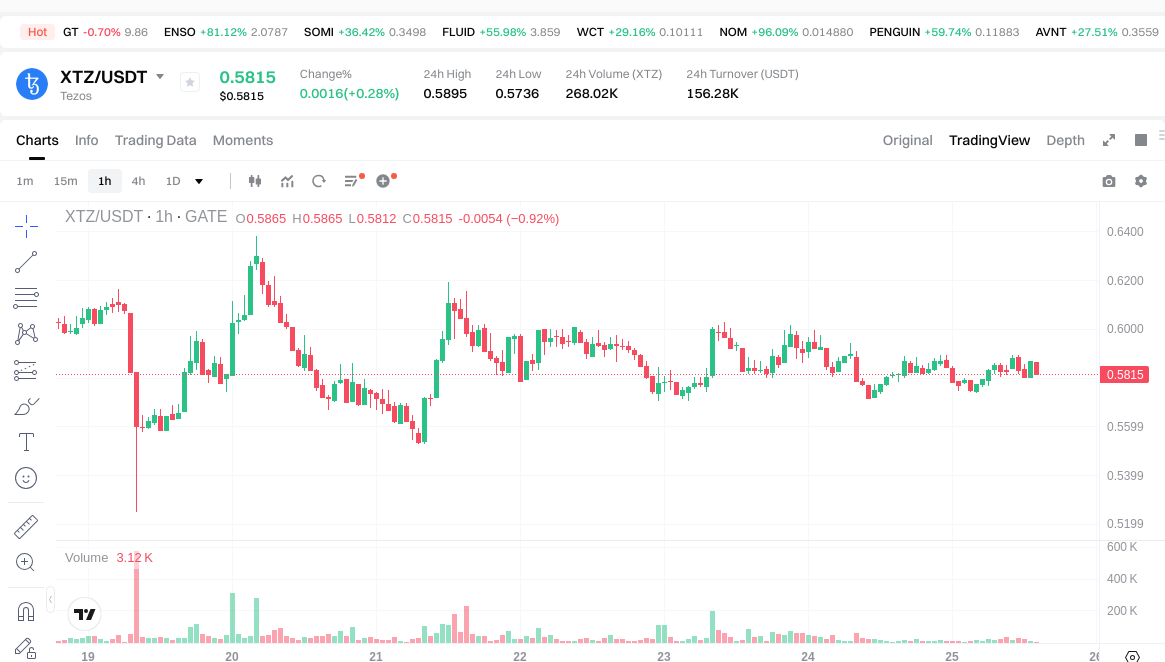
- XTZ current price: $0.5821
- 24-hour trading volume: $18,352.25 (NEON) vs $156,442.36 (XTZ)
- Market sentiment index (Fear & Greed Index): 25 (Extreme Fear)
- NEON 24-hour price change: -0.87%
- XTZ 24-hour price change: +0.27%
- NEON market capitalization: $12,459,386.36
- XTZ market capitalization: $624,703,422.50
View real-time prices:
II. Core Factors Affecting NEON vs XTZ Investment Value
Supply Mechanism Comparison (Tokenomics)
Due to limited available data on the specific supply mechanisms of NEON and XTZ, a detailed comparison cannot be provided at this time. Generally, tokenomics including supply caps, emission schedules, and burn mechanisms can influence long-term price dynamics and investor sentiment.
Institutional Adoption and Market Applications
Without specific information regarding institutional holdings or enterprise adoption patterns for NEON and XTZ, it is not possible to draw comparisons in this area. Institutional interest and real-world use cases in payments, settlements, and portfolio diversification typically serve as indicators of market maturity and confidence.
Technology Development and Ecosystem Building
Current reference materials do not provide details on recent technology upgrades or ecosystem developments for either NEON or XTZ. Key areas such as DeFi integration, NFT platforms, payment solutions, and smart contract capabilities would normally be assessed to evaluate the technological competitiveness and growth potential of each project.
Macroeconomic Environment and Market Cycles
The relationship between macroeconomic factors and the performance of NEON versus XTZ cannot be determined from the available data. Typically, factors such as inflation trends, monetary policy shifts, interest rate movements, and geopolitical developments influence digital asset valuations, though specific impacts vary by asset characteristics and market positioning.
III. 2026-2031 Price Forecast: NEON vs XTZ
Short-term Forecast (2026)
- NEON: Conservative $0.0378 - $0.0518 | Optimistic $0.0518 - $0.0741
- XTZ: Conservative $0.4710 - $0.5815 | Optimistic $0.5815 - $0.8374
Mid-term Forecast (2028-2029)
- NEON may enter a growth phase with estimated prices ranging from $0.0650 to $0.1317
- XTZ may enter a consolidation phase with estimated prices ranging from $0.4331 to $1.2038
- Key drivers: institutional capital inflows, ETF developments, ecosystem expansion
Long-term Forecast (2030-2031)
- NEON: Baseline scenario $0.0587 - $0.1128 | Optimistic scenario $0.1128 - $0.1690
- XTZ: Baseline scenario $0.7052 - $1.0685 | Optimistic scenario $1.0685 - $1.2821
View detailed price predictions for NEON and XTZ
Disclaimer
NEON:
| Year |
Predicted High Price |
Predicted Average Price |
Predicted Low Price |
Price Change |
| 2026 |
0.0740597 |
0.05179 |
0.0378067 |
0 |
| 2027 |
0.091870281 |
0.06292485 |
0.0522276255 |
20 |
| 2028 |
0.110678518665 |
0.0773975655 |
0.06501395502 |
48 |
| 2029 |
0.1316532589155 |
0.0940380420825 |
0.087455379136725 |
80 |
| 2030 |
0.13202941108383 |
0.112845650499 |
0.05867973825948 |
116 |
| 2031 |
0.168963792492152 |
0.122437530791415 |
0.095501274017303 |
135 |
XTZ:
| Year |
Predicted High Price |
Predicted Average Price |
Predicted Low Price |
Price Change |
| 2026 |
0.83736 |
0.5815 |
0.471015 |
0 |
| 2027 |
0.8655046 |
0.70943 |
0.5107896 |
21 |
| 2028 |
1.078830201 |
0.7874673 |
0.433107015 |
35 |
| 2029 |
1.203761888145 |
0.9331487505 |
0.70919305038 |
60 |
| 2030 |
1.282146383187 |
1.0684553193225 |
0.908187021424125 |
83 |
| 2031 |
1.245818902330035 |
1.17530085125475 |
0.70518051075285 |
101 |
IV. Investment Strategy Comparison: NEON vs XTZ
Long-term vs Short-term Investment Strategies
- NEON: May appeal to investors interested in emerging cross-chain infrastructure projects connecting Ethereum and Solana ecosystems, with tolerance for higher volatility and longer development timelines
- XTZ: May suit investors seeking exposure to established blockchain platforms with historical market presence and relatively more stable trading patterns within the digital asset space
Risk Management and Asset Allocation
- Conservative investors: NEON 20% vs XTZ 80%
- Aggressive investors: NEON 45% vs XTZ 55%
- Hedging instruments: stablecoin allocation, options strategies, cross-asset portfolio diversification
V. Potential Risk Comparison
Market Risk
- NEON: Higher volatility characteristics since launch in 2023, with price fluctuations from $3.98 to $0.0505, indicating substantial market risk and sensitivity to broader crypto market conditions
- XTZ: Established trading history since 2017 with relatively more predictable price movements, though still subject to crypto market cycles and sentiment shifts
Technical Risk
- NEON: Scalability considerations related to cross-chain functionality, network stability during growth phases
- XTZ: Platform upgrade execution, network consensus mechanisms, potential security vulnerabilities
Regulatory Risk
- Global regulatory developments may impact both assets differently based on their respective use cases, network structures, and jurisdictional exposure, with evolving compliance frameworks potentially affecting trading accessibility and institutional adoption
VI. Conclusion: Which Is the Better Buy?
📌 Investment Value Summary:
- NEON advantages: Early-stage cross-chain solution connecting Ethereum and Solana ecosystems, potential for growth in interoperability infrastructure, lower entry price point
- XTZ advantages: Established market presence since 2017, self-amending blockchain architecture, relatively higher market capitalization and trading volume compared to NEON
✅ Investment Recommendations:
- Beginner investors: Consider starting with XTZ due to its more established market position and longer track record, while allocating a smaller portion to NEON for exposure to emerging cross-chain technology
- Experienced investors: Evaluate risk tolerance and portfolio diversification needs, potentially maintaining balanced exposure to both assets while monitoring technical developments and market cycles
- Institutional investors: Conduct thorough due diligence on governance structures, liquidity profiles, and ecosystem maturity before allocation decisions
⚠️ Risk Disclosure: The cryptocurrency market exhibits substantial volatility. This content does not constitute investment advice.
VII. FAQ
Q1: What is the current market capitalization difference between NEON and XTZ?
As of January 25, 2026, XTZ has a significantly larger market capitalization of $624,703,422.50 compared to NEON's $12,459,386.36, representing approximately a 50x difference. This substantial gap reflects XTZ's established market position since its 2017 launch and broader institutional recognition, while NEON, launched in 2023, remains in its early growth stage as a cross-chain infrastructure solution connecting Ethereum and Solana ecosystems. The market cap disparity also correlates with trading volume differences, with XTZ recording $156,442.36 in 24-hour volume versus NEON's $18,352.25, indicating more mature liquidity profiles for the established platform.
Q2: How do the historical price performances of NEON and XTZ compare?
NEON experienced extreme volatility since its launch, reaching an all-time high of $3.98 on January 2, 2024, before declining to an all-time low of $0.0505 on December 31, 2025 — representing a decline of approximately 98.7%. In contrast, XTZ reached its historical peak of $9.12 on October 4, 2021, during the broader crypto bull cycle, and recorded its lowest point at $0.350476 on December 7, 2018. XTZ's price range demonstrates relatively more stable trading patterns over its longer market history, though both assets remain subject to cryptocurrency market cycles and volatility inherent to digital assets.
Q3: What are the key technological differences between NEON and XTZ?
NEON functions as a cross-chain infrastructure solution launched in 2023, specifically designed to enable Ethereum decentralized applications (dApps) to operate within the Solana ecosystem, addressing interoperability challenges between two major blockchain platforms. XTZ operates as a self-amending decentralized blockchain platform that has been active since 2017, featuring an on-chain governance mechanism allowing protocol upgrades without hard forks. While NEON focuses on bridging ecosystem gaps and enabling cross-chain functionality, XTZ emphasizes platform flexibility through its self-amendment architecture and smart contract capabilities, representing fundamentally different technological approaches within the blockchain infrastructure landscape.
Q4: What investment allocation strategies are recommended for NEON vs XTZ?
Conservative investors may consider a 20% NEON / 80% XTZ allocation, prioritizing the more established platform while maintaining limited exposure to emerging cross-chain technology. Aggressive investors might adopt a 45% NEON / 55% XTZ split, accepting higher volatility in exchange for potential growth opportunities in early-stage infrastructure projects. Beginner investors are recommended to start with XTZ due to its longer track record and more predictable market behavior, while experienced investors should evaluate portfolio diversification needs and risk tolerance levels. All allocation strategies should incorporate risk management tools including stablecoin reserves, options hedging strategies, and cross-asset diversification to mitigate cryptocurrency market volatility.
Q5: What are the price forecasts for NEON and XTZ through 2031?
Short-term forecasts for 2026 project NEON trading between $0.0378-$0.0741 (conservative to optimistic scenarios), while XTZ is expected to range from $0.4710-$0.8374. Mid-term projections for 2028-2029 estimate NEON prices of $0.0650-$0.1317 during a potential growth phase, with XTZ consolidating between $0.4331-$1.2038. Long-term forecasts for 2030-2031 suggest NEON reaching $0.0587-$0.1690 and XTZ achieving $0.7052-$1.2821 under baseline to optimistic scenarios. These projections incorporate factors including institutional capital inflows, potential ETF developments, and ecosystem expansion, though actual performance will depend on market conditions, technological adoption rates, and macroeconomic factors that remain inherently unpredictable in cryptocurrency markets.
Q6: What are the primary risks associated with investing in NEON versus XTZ?
NEON presents higher market risk due to its extreme volatility profile, declining 98.7% from its peak within two years, alongside technical risks related to cross-chain functionality scalability and network stability during growth phases. XTZ faces established platform risks including upgrade execution challenges, network consensus mechanism dependencies, and potential security vulnerabilities inherent to mature blockchain systems. Both assets are subject to evolving global regulatory frameworks that may impact trading accessibility, institutional adoption, and compliance requirements differently based on their respective use cases and jurisdictional exposure. Additionally, cryptocurrency market cycles, sentiment shifts, and macroeconomic conditions affect both assets, with NEON demonstrating greater sensitivity to market fluctuations compared to XTZ's relatively more predictable behavior patterns.
Q7: How do trading volumes compare between NEON and XTZ, and what does this indicate?
The 24-hour trading volume comparison shows XTZ at $156,442.36 versus NEON at $18,352.25 as of January 25, 2026, representing approximately an 8.5x difference favoring XTZ. This substantial volume disparity indicates significantly higher market liquidity and trading activity for XTZ, reflecting its established market presence since 2017 and broader exchange listings. Higher trading volumes typically correlate with improved price discovery mechanisms, reduced slippage for larger transactions, and greater market depth, suggesting that XTZ offers more favorable trading conditions for institutional participants and larger position sizes. The lower volume for NEON is consistent with its status as an emerging project launched in 2023, though volume growth may occur as ecosystem adoption increases and cross-chain functionality gains traction within the Ethereum-Solana interoperability landscape.
Q8: What factors should institutional investors prioritize when comparing NEON and XTZ?
Institutional investors should conduct comprehensive due diligence focusing on governance structures, with XTZ's self-amending protocol offering on-chain governance mechanisms versus NEON's cross-chain infrastructure governance model. Liquidity profiles require careful evaluation, as XTZ demonstrates substantially higher trading volumes and market depth suitable for larger allocations, while NEON's lower liquidity may present execution challenges for institutional-scale positions. Ecosystem maturity assessment should compare XTZ's established developer community and application ecosystem since 2017 against NEON's emerging cross-chain solution launched in 2023. Additional considerations include custody solutions availability, regulatory compliance frameworks applicable to each asset's jurisdictional exposure, counterparty risk management across exchanges and service providers, and integration capabilities with existing portfolio management systems and reporting infrastructure used by institutional investment operations.
* The information is not intended to be and does not constitute financial advice or any other recommendation of any sort offered or endorsed by Gate.