This comprehensive analysis compares NEWT and SOL across multiple investment dimensions. NEWT, launched in 2025, focuses on decentralized automation and verifiable agent authorization, while SOL, established in 2018, represents a mature Layer-1 blockchain solution. Current market data shows NEWT at $0.09278 with $84,658.17 daily volume, compared to SOL at $128.75 with $94,987,253.00 volume. NEWT experienced 89.1% decline from its $0.8511 peak, whereas SOL declined 56.1% from $293.31. The article examines price trends, supply mechanisms, institutional adoption, technical ecosystems, and market performance through 2031. For conservative investors, SOL offers established infrastructure and higher liquidity on Gate; experienced investors may diversify with NEWT as speculative allocation. Current extreme fear market sentiment presents distinct opportunities and risks for both protocols.
Introduction: Investment Comparison Between NEWT and SOL
In the cryptocurrency market, the comparison between NEWT vs SOL continues to be a topic of significant interest among investors. Both assets demonstrate notable differences in market capitalization ranking, application scenarios, and price performance, representing distinct positioning within the crypto asset landscape.
Newton (NEWT): Launched in 2025, this protocol has established itself as a decentralized infrastructure focused on verifiable onchain automation and secure agent authorization, enabling protocols, DAOs, and users to execute complex operations through verifiable agents.
Solana (SOL): Established in 2018 by former engineers from Qualcomm, Intel, and Dropbox, Solana represents a high-performance blockchain protocol designed to provide scalability without compromising decentralization or security, positioning itself as a leading Layer-1 solution.
This article will analyze the investment value comparison between NEWT vs SOL across multiple dimensions, including historical price trends, supply mechanisms, institutional adoption, technological ecosystems, and future projections, attempting to address investors' most pressing question:
"Which asset presents more compelling investment characteristics at the current market conditions?"
I. Historical Price Comparison and Current Market Status
NEWT and SOL Historical Price Trends
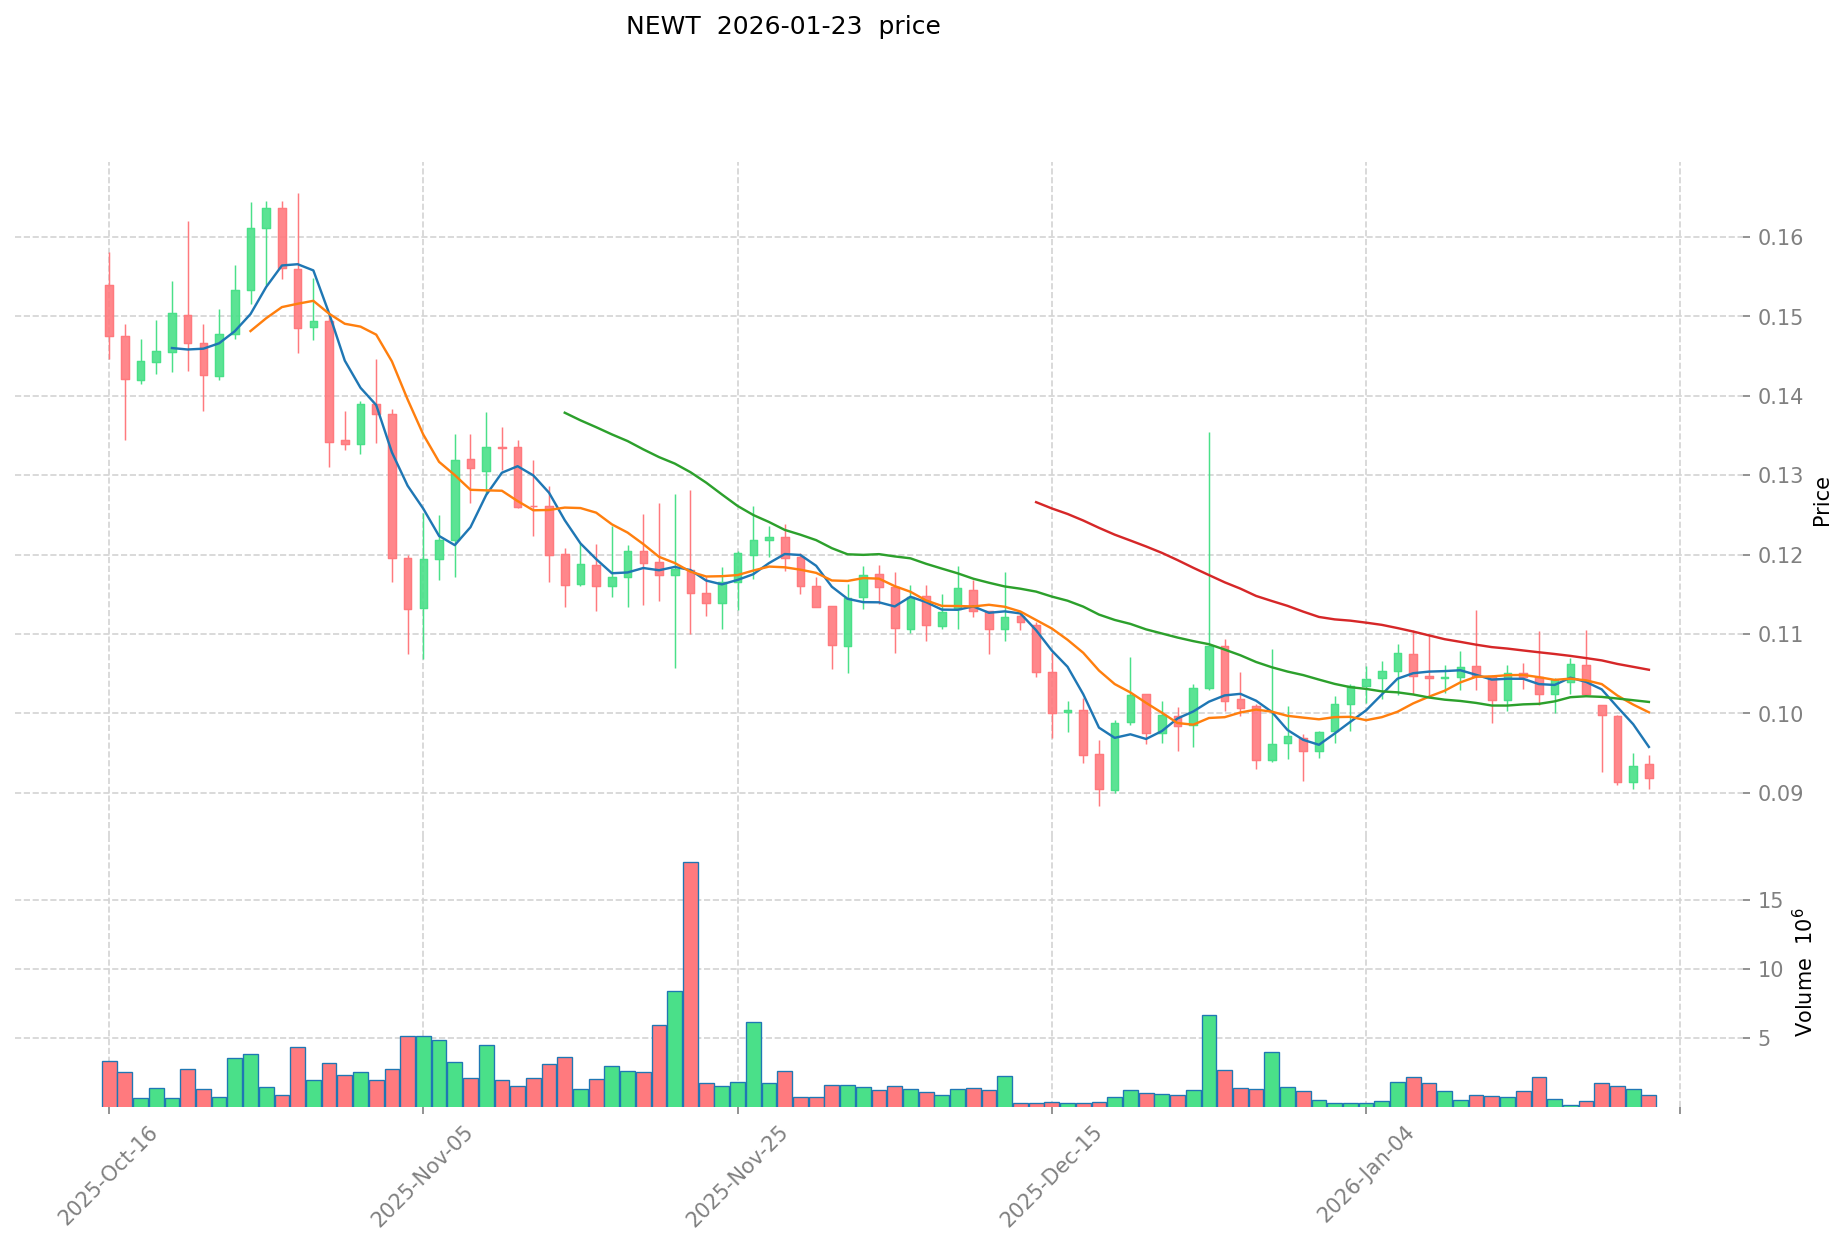
- 2025: NEWT experienced significant price volatility, reaching a high of $0.8511 on June 24, 2025, before declining to $0.0483 on October 10, 2025.
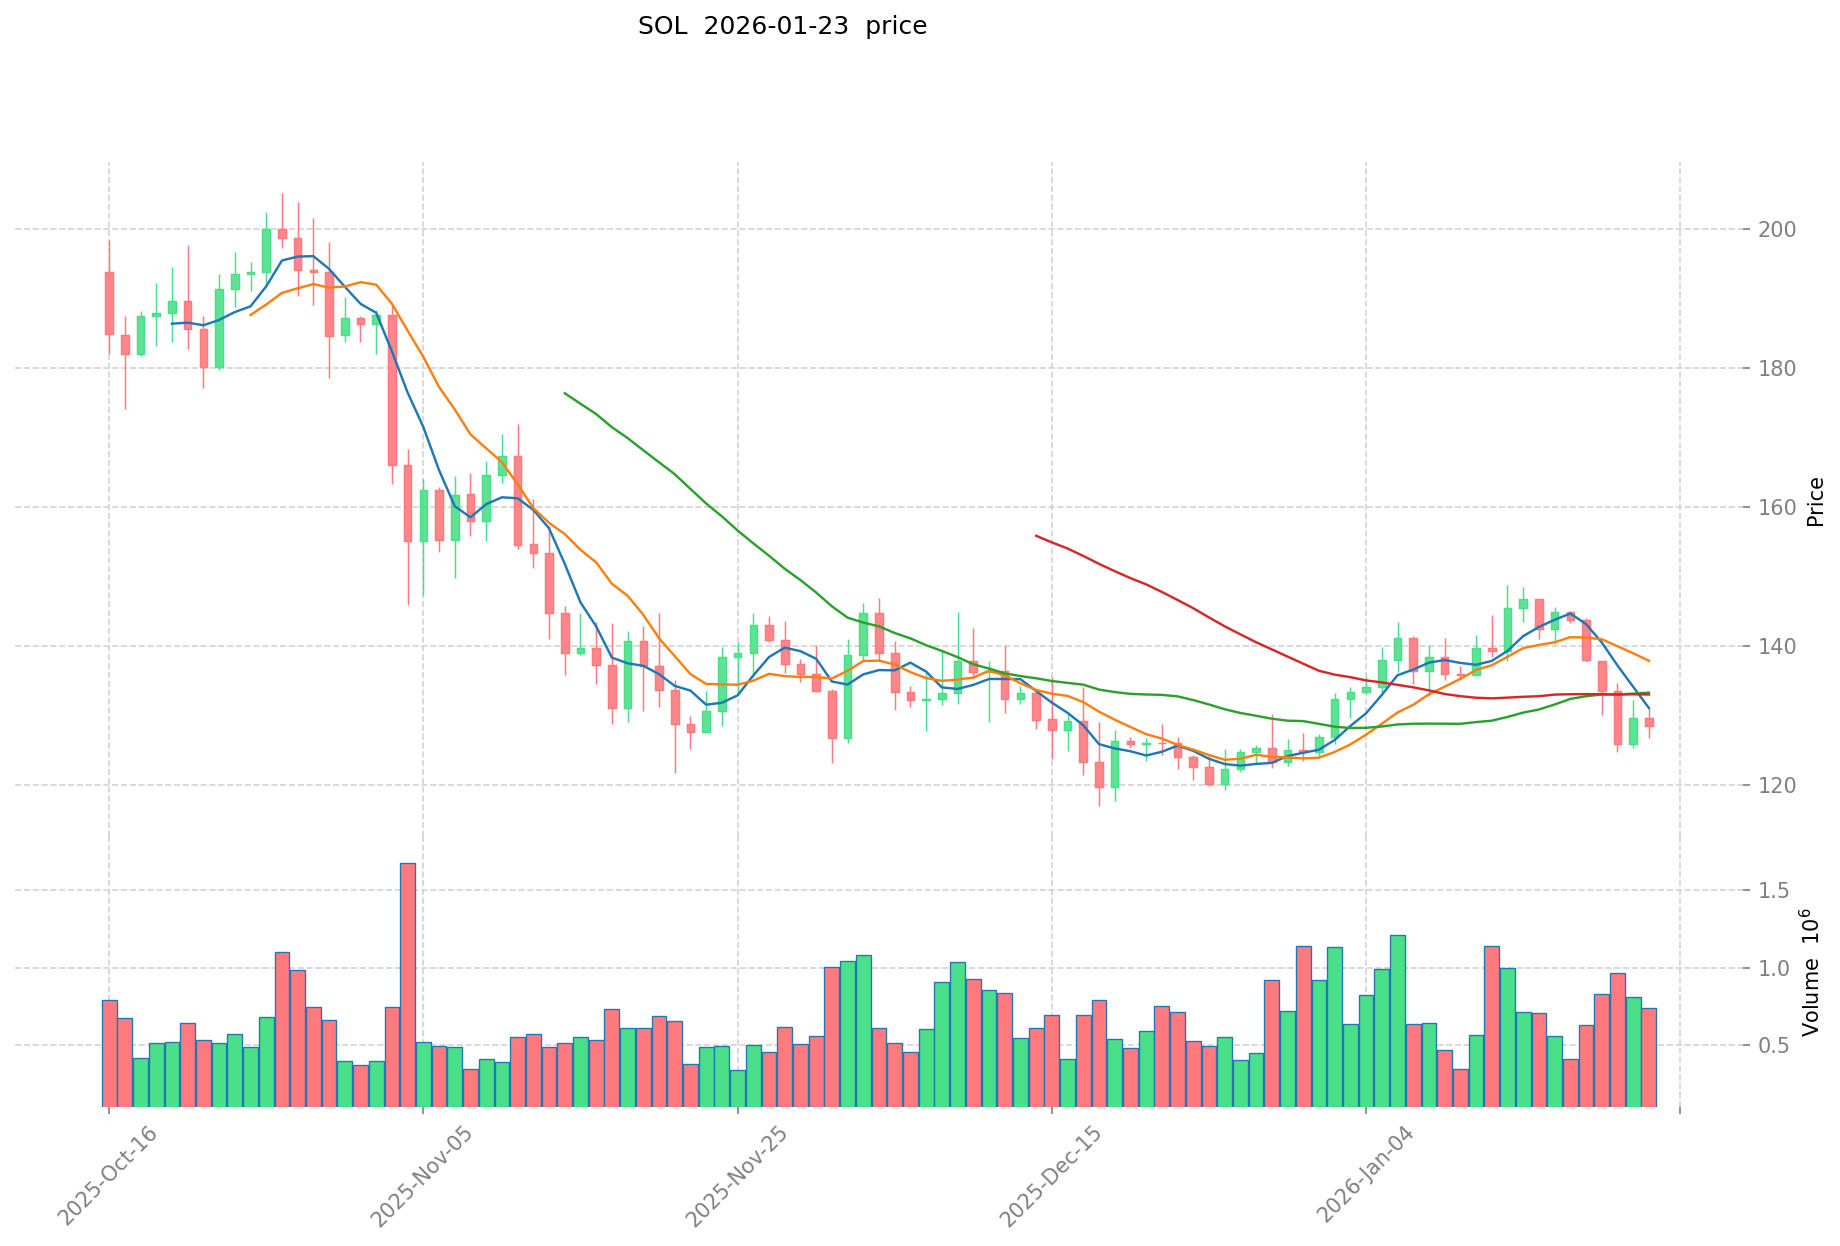
- 2020-2025: SOL demonstrated substantial growth from its low of $0.500801 in May 2020, reaching a peak of $293.31 in January 2025, reflecting the project's development and ecosystem expansion.
- Comparative Analysis: During the recent market cycle, NEWT declined from $0.8511 to its current price of $0.09278, representing an 89.1% decrease from its high, while SOL declined from $293.31 to $128.75, representing a 56.1% decrease from its peak.
Current Market Status (January 23, 2026)
- NEWT current price: $0.09278
- SOL current price: $128.75
- 24-hour trading volume: NEWT $84,658.17 vs SOL $94,987,253.00
- Market sentiment index (Fear & Greed Index): 24 (Extreme Fear)
View real-time prices:
- View NEWT current price Market Price
- View SOL current price Market Price
II. Core Factors Influencing NEWT vs SOL Investment Value
Supply Mechanism Comparison (Tokenomics)
Due to insufficient reference materials, detailed supply mechanism information for NEWT and SOL cannot be provided at this time. Generally speaking, the supply mechanism of crypto assets may include fixed supply models, deflationary models, or halving mechanisms, which tend to influence price cycles through changes in supply and demand dynamics.
Institutional Adoption and Market Applications
Institutional Holdings: Current reference materials do not provide specific data on institutional preference between NEWT and SOL.
Enterprise Adoption: Information regarding the application of NEWT and SOL in cross-border payments, settlements, or investment portfolios is not available in the provided materials.
National Policies: Regulatory attitudes toward these two assets across different jurisdictions are not covered in the available references.
Technical Development and Ecosystem Building
NEWT Technical Upgrades: Specific technical upgrade details and their potential impacts are not documented in the reference materials.
SOL Technical Development: Information on Solana's ongoing technical developments is not available in the provided sources.
Ecosystem Comparison: Comparative data on DeFi, NFT, payment systems, and smart contract implementations for both assets is not present in the reference materials.
Macroeconomic Environment and Market Cycles
Performance Under Inflation: The reference materials do not provide analysis on which asset demonstrates stronger inflation-resistant properties.
Macroeconomic Monetary Policy: The impact of interest rates and the US Dollar Index on NEWT and SOL is not covered in the available sources.
Geopolitical Factors: Information regarding cross-border transaction demand and international situations affecting these assets is not documented in the reference materials.
III. 2026-2031 Price Prediction: NEWT vs SOL
Short-term Forecast (2026)
- NEWT: Conservative $0.065-$0.093 | Optimistic $0.093-$0.136
- SOL: Conservative $113.25-$128.69 | Optimistic $128.69-$146.71
Mid-term Forecast (2028-2029)
- NEWT may enter a consolidation phase, with projected prices ranging from $0.099 to $0.170
- SOL may enter a growth phase, with projected prices ranging from $106.63 to $251.05
- Key drivers: institutional capital inflows, ETF developments, ecosystem expansion
Long-term Forecast (2030-2031)
- NEWT: Baseline scenario $0.115-$0.148 | Optimistic scenario $0.148-$0.178
- SOL: Baseline scenario $170.11-$227.58 | Optimistic scenario $227.58-$321.91
View detailed price predictions for NEWT and SOL
Disclaimer
NEWT:
| Year |
Predicted High Price |
Predicted Average Price |
Predicted Low Price |
Price Change |
| 2026 |
0.1362837 |
0.09271 |
0.064897 |
0 |
| 2027 |
0.121366661 |
0.11449685 |
0.0996122595 |
23 |
| 2028 |
0.133262883715 |
0.1179317555 |
0.109676532615 |
27 |
| 2029 |
0.169556381470125 |
0.1255973196075 |
0.099221882489925 |
35 |
| 2030 |
0.178567989151963 |
0.147576850538812 |
0.115109943420273 |
59 |
| 2031 |
0.174487489234564 |
0.163072419845387 |
0.148395902059302 |
75 |
SOL:
| Year |
Predicted High Price |
Predicted Average Price |
Predicted Low Price |
Price Change |
| 2026 |
146.7066 |
128.69 |
113.2472 |
0 |
| 2027 |
195.531586 |
137.6983 |
123.92847 |
6 |
| 2028 |
241.59166735 |
166.614943 |
106.63356352 |
29 |
| 2029 |
251.04706536525 |
204.103305175 |
126.5440492085 |
58 |
| 2030 |
295.8477408511625 |
227.575185270125 |
218.47217785932 |
76 |
| 2031 |
321.905099564591812 |
261.71146306064375 |
170.112450989418437 |
103 |
IV. Investment Strategy Comparison: NEWT vs SOL
Long-term vs Short-term Investment Strategies
- NEWT: May be suitable for investors interested in emerging decentralized automation infrastructure and verifiable agent technology, with higher risk tolerance for early-stage protocol adoption
- SOL: May be suitable for investors seeking established Layer-1 blockchain exposure with broader ecosystem development and institutional recognition
Risk Management and Asset Allocation
- Conservative investors: NEWT 10-20% vs SOL 80-90%
- Aggressive investors: NEWT 30-40% vs SOL 60-70%
- Hedging tools: stablecoin allocation, options strategies, cross-asset diversification
V. Potential Risk Comparison
Market Risk
- NEWT: Higher volatility evidenced by 89.1% decline from peak, lower liquidity with 24-hour trading volume of $84,658.17, and sensitivity to market sentiment in extreme fear conditions
- SOL: Moderate volatility with 56.1% decline from peak, substantially higher liquidity with 24-hour trading volume of $94,987,253.00, and established market presence reducing certain market risks
Technical Risk
- NEWT: Early-stage protocol implementation risks, network stability concerns for verifiable automation systems, and scalability challenges as adoption increases
- SOL: Network stability considerations based on historical performance, validator concentration concerns, and potential security vulnerabilities inherent in high-throughput blockchain architecture
Regulatory Risk
- Global regulatory policies may impact both assets differently, with established protocols like SOL potentially facing more immediate regulatory scrutiny, while emerging protocols like NEWT may encounter uncertainty regarding classification and compliance requirements across jurisdictions
VI. Conclusion: Which Is the Better Buy?
📌 Investment Value Summary:
- NEWT advantages: Early-stage positioning in decentralized automation infrastructure, potential for growth as verifiable agent technology gains adoption, and current lower entry price point
- SOL advantages: Established Layer-1 blockchain with proven track record since 2018, higher liquidity supporting easier entry and exit, broader ecosystem development, and relatively lower volatility compared to emerging protocols
✅ Investment Recommendations:
- Novice investors: Consider SOL for its established market presence, higher liquidity, and broader institutional recognition, starting with smaller position sizes to manage risk exposure
- Experienced investors: May explore diversified allocation between both assets, with SOL as core holding and NEWT as speculative position based on risk tolerance and portfolio objectives
- Institutional investors: Evaluate SOL for its established infrastructure and ecosystem maturity, while assessing NEWT's protocol development and adoption metrics before considering allocation
⚠️ Risk Disclosure: Cryptocurrency markets exhibit high volatility. This article does not constitute investment advice.
VII. FAQ
Q1: What is the primary difference between NEWT and SOL in terms of their technological focus?
NEWT is a decentralized infrastructure protocol focused on verifiable onchain automation and secure agent authorization, while SOL is an established Layer-1 blockchain protocol designed for high-performance scalability. NEWT, launched in 2025, specializes in enabling protocols, DAOs, and users to execute complex operations through verifiable agents, representing emerging technology in the decentralized automation space. In contrast, Solana (SOL), established in 2018 by former engineers from Qualcomm, Intel, and Dropbox, positions itself as a comprehensive blockchain solution that aims to provide scalability without compromising decentralization or security, supporting a broad ecosystem of applications including DeFi, NFTs, and smart contracts.
Q2: Which asset demonstrates higher liquidity based on current trading metrics?
SOL demonstrates significantly higher liquidity with a 24-hour trading volume of $94,987,253.00 compared to NEWT's $84,658.17. This substantial difference in trading volume—over 1,100 times greater for SOL—indicates that Solana offers considerably easier entry and exit opportunities for investors. Higher liquidity typically translates to tighter bid-ask spreads, reduced slippage on larger orders, and greater market depth, making SOL more accessible for both retail and institutional investors seeking to execute trades efficiently without significant price impact.
Q3: How have NEWT and SOL performed since their respective peaks?
NEWT has declined 89.1% from its peak of $0.8511 (June 24, 2025) to its current price of $0.09278, while SOL has declined 56.1% from its peak of $293.31 (January 2025) to $128.75. The more severe drawdown experienced by NEWT reflects both its early-stage nature and higher volatility characteristics typical of emerging protocols. SOL's relatively moderate decline demonstrates greater price stability, which can be attributed to its established market presence since 2018, broader institutional recognition, and more mature ecosystem. These performance differences highlight the distinct risk-reward profiles of early-stage protocols versus established Layer-1 blockchains.
Q4: What are the projected price ranges for NEWT and SOL in 2026?
For 2026, NEWT's conservative forecast ranges from $0.065 to $0.093, with an optimistic scenario of $0.093 to $0.136, while SOL's conservative forecast ranges from $113.25 to $128.69, with an optimistic scenario of $128.69 to $146.71. The conservative scenario for NEWT suggests potential downside from the current price of $0.09278, indicating continued consolidation or correction possibilities. SOL's conservative range implies relative price stability near current levels with moderate downside protection. The optimistic scenarios for both assets suggest potential upside of approximately 47% for NEWT and 14% for SOL, reflecting different growth trajectories based on their respective market positions and adoption stages.
Q5: What type of investor profile is most suitable for each asset?
SOL is generally more suitable for novice and conservative investors seeking exposure to established blockchain infrastructure with higher liquidity and lower volatility, while NEWT may appeal to experienced and aggressive investors with higher risk tolerance interested in early-stage protocol opportunities. For conservative portfolios, a recommended allocation might be 10-20% NEWT and 80-90% SOL, whereas aggressive investors might consider 30-40% NEWT and 60-70% SOL. Institutional investors are advised to evaluate SOL for its established infrastructure and ecosystem maturity, while carefully assessing NEWT's protocol development metrics and adoption trajectory before allocation. The key consideration is matching investment characteristics to individual risk tolerance, investment timeframe, and portfolio objectives.
Q6: What are the primary risks associated with investing in NEWT versus SOL?
NEWT faces higher market risk with greater volatility (89.1% decline from peak), lower liquidity ($84,658.17 24-hour volume), and early-stage protocol implementation risks including network stability concerns and scalability challenges as adoption increases. SOL, while more established, faces moderate volatility (56.1% decline), network stability considerations based on historical performance, validator concentration concerns, and potential security vulnerabilities inherent in high-throughput blockchain architecture. Both assets are subject to regulatory risk, though established protocols like SOL may face more immediate regulatory scrutiny, while emerging protocols like NEWT encounter uncertainty regarding classification and compliance requirements. Additionally, both assets are impacted by the current market sentiment of extreme fear (Fear & Greed Index: 24), which may contribute to continued price pressure.
Q7: What are the long-term price projections for 2030-2031?
For 2030-2031, NEWT's baseline scenario projects $0.115-$0.148 with an optimistic scenario of $0.148-$0.178, while SOL's baseline scenario projects $170.11-$227.58 with an optimistic scenario of $227.58-$321.91. By 2031, NEWT's predicted average price reaches $0.163072419845387, representing a 75% increase from 2026 levels, while SOL's predicted average price reaches $261.71146306064375, representing a 103% increase from 2026 levels. These projections suggest that SOL may offer stronger absolute price appreciation potential over the long term, driven by factors such as institutional capital inflows, ETF developments, and ecosystem expansion. However, these forecasts are subject to numerous variables including technological development, regulatory changes, market adoption rates, and macroeconomic conditions, and should not be interpreted as guaranteed outcomes.
Q8: How does the current market sentiment affect investment decisions for NEWT and SOL?
The current market sentiment index stands at 24 (Extreme Fear), which historically indicates periods of heightened risk aversion and potential accumulation opportunities for long-term investors. During extreme fear conditions, both NEWT and SOL may experience continued price pressure as investors reduce risk exposure, but this environment can also present entry points for those with conviction in the underlying protocols. The extreme fear reading suggests that market participants are heavily concerned about downside risks, which is reflected in both assets' substantial declines from their respective peaks. For NEWT, the combination of extreme fear and early-stage protocol status amplifies volatility risk, while for SOL, the established market presence and higher liquidity may provide some downside cushion. Investors should consider whether current fear levels represent temporary market psychology or reflect fundamental concerns requiring deeper analysis before committing capital.
* The information is not intended to be and does not constitute financial advice or any other recommendation of any sort offered or endorsed by Gate.