This comprehensive comparison analyzes NIZA and XTZ across multiple investment dimensions. NIZA Global, launched in 2025, powers a utility-focused ecosystem supporting trading and staking with current price of $0.056 and market cap of $8.45M. Tezos (XTZ), operational since 2017, features self-evolving blockchain technology with on-chain governance, priced at $0.57 with $613.76M market cap. The article evaluates historical price trends, tokenomics, institutional adoption, technological architecture, and long-term investment potential through 2031. XTZ suits conservative investors seeking established infrastructure exposure, while NIZA appeals to growth-focused investors accepting higher volatility. Risk considerations include NIZA's limited liquidity and newer status versus XTZ's broader market sensitivity. Current market sentiment at Extreme Fear presents distinct opportunities for differentiated portfolio strategies on Gate platform.
Introduction: NIZA vs XTZ Investment Comparison
In the cryptocurrency market, the comparison between NIZA vs XTZ has become a topic of interest for investors. The two tokens demonstrate notable differences in market capitalization ranking, application scenarios, and price performance, representing distinct positioning within the crypto asset landscape.
NIZA Global (NIZA): Launched in 2025, this digital asset aims to power a secure, transparent, and user-friendly ecosystem. Built with utility features enabling seamless trading, staking, and participation across the Niza Global platform, it seeks to provide accessibility for both retail and institutional users.
Tezos (XTZ): Since its launch in 2017, Tezos has been recognized as a self-evolving blockchain platform. The protocol employs formal verification techniques and on-chain governance mechanisms, allowing the network to upgrade without hard forks while ensuring smart contract security.
This article will analyze the NIZA vs XTZ investment value comparison through multiple dimensions including historical price trends, supply mechanisms, institutional adoption, technical ecosystem, and future outlook, attempting to address investors' core question:
"Which presents a more suitable investment opportunity at this time?"
I. Historical Price Comparison and Current Market Status
NIZA (Coin A) and XTZ (Coin B) Historical Price Trends
- 2021: XTZ reached its all-time high of $9.12 in October, driven by growing adoption in the NFT and DeFi sectors.
- 2018: XTZ experienced significant price volatility, reaching its historical low of $0.35 in December during a broader market downturn.
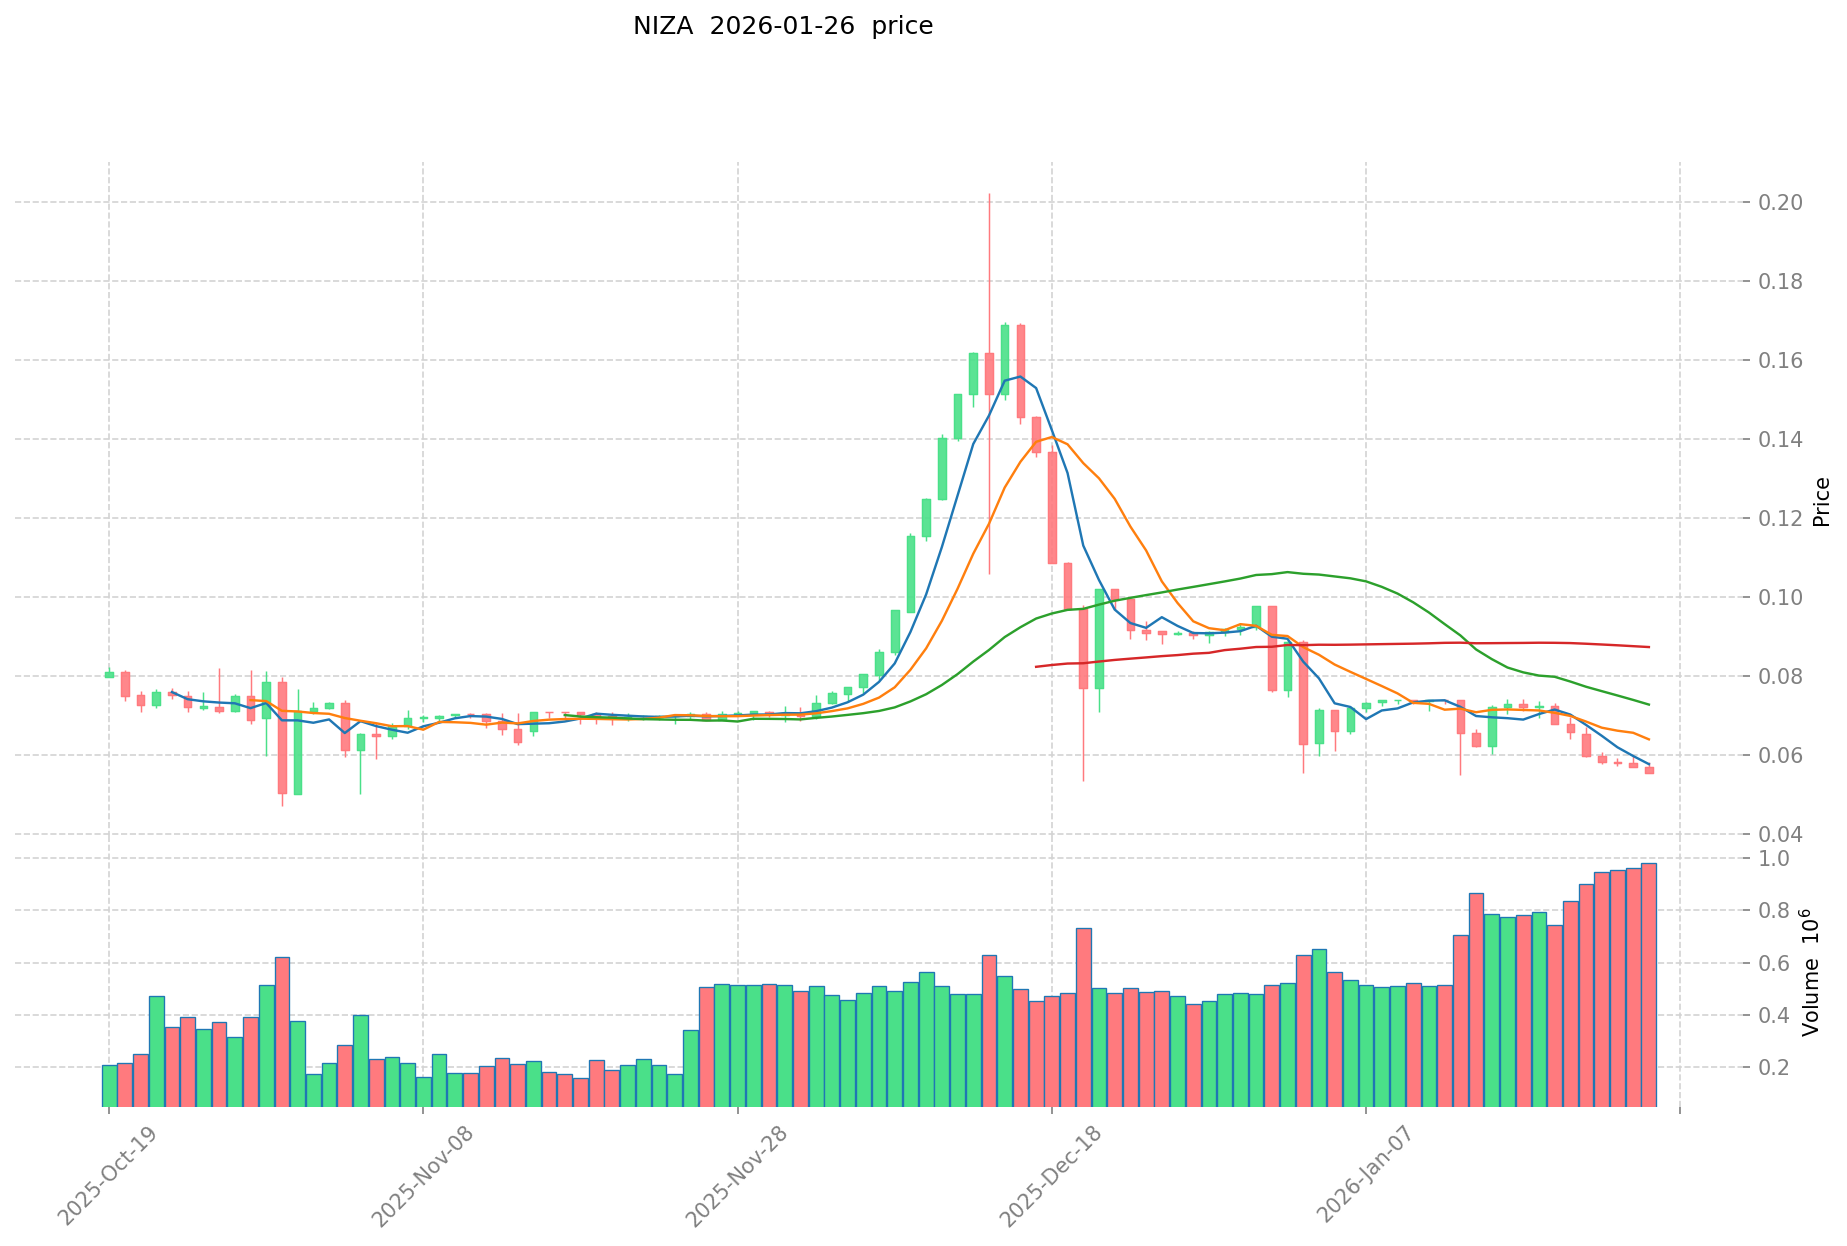
- 2025: NIZA was launched in September with an initial offering price, subsequently experiencing price fluctuations as the token gained initial market traction.
- Comparative Analysis: During the current market cycle, NIZA has moved from its historical high of $0.37 to approximately $0.056, while XTZ has declined from its peak of $9.12 to around $0.57, representing differing degrees of market adjustment.
Current Market Status (January 27, 2026)
- NIZA Current Price: $0.056312
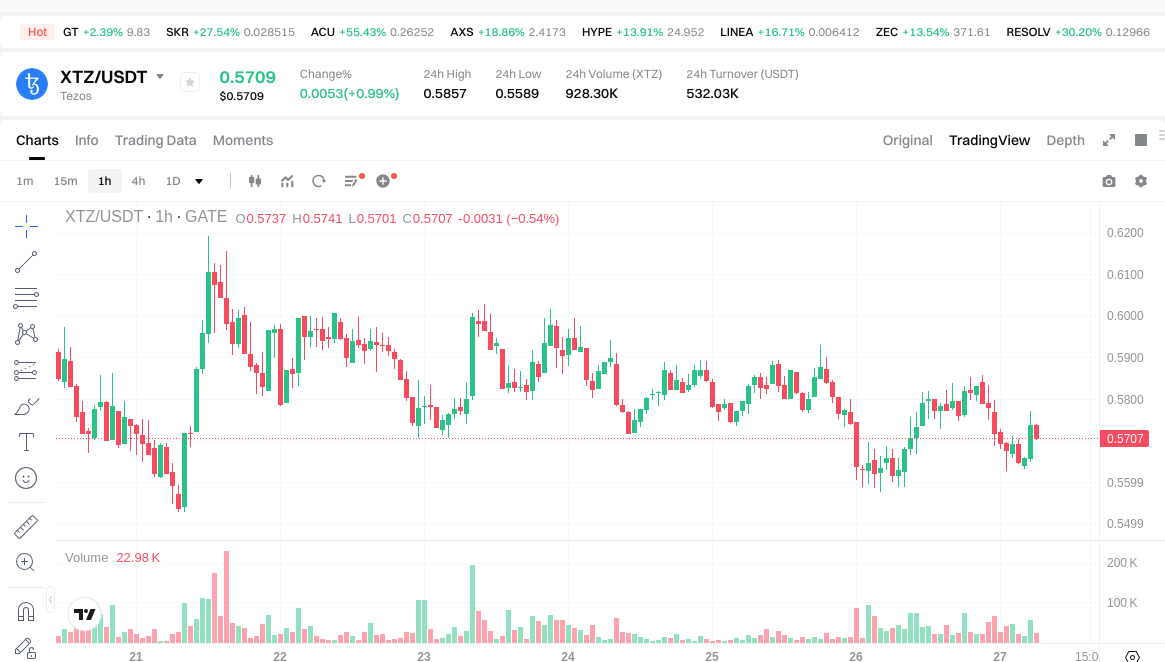
- XTZ Current Price: $0.5718
- 24-Hour Trading Volume: NIZA $54,536.28 vs XTZ $524,473.99
- Market Capitalization: NIZA $8.45M vs XTZ $613.76M
- Market Sentiment Index (Fear & Greed Index): 20 (Extreme Fear)
View real-time prices:
II. Core Factors Influencing NIZA vs XTZ Investment Value
Tokenomics Comparison
- NIZA: The reference materials indicate exchange rate data (1 USD = 37,243.9478 NIZA) suggesting potential high supply or early-stage valuation characteristics, though specific supply mechanisms are not detailed in available sources.
- XTZ: Materials reference XTZ within discussions of blockchain ecosystem development and exchange connectivity, though detailed tokenomics are not specified in the provided context.
- 📌 Historical Pattern: Supply mechanisms contribute to price cycle dynamics through market demand interactions and adoption phases, though specific historical patterns for these assets require additional data.
Institutional Adoption and Market Application
- Institutional Holdings: Materials reference Binance as a core ecosystem hub connecting projects with liquidity and trust, with XTZ mentioned in this context, though specific institutional holding data is not provided.
- Enterprise Adoption: Available materials discuss broader cryptocurrency adoption trends, including Bitcoin ETF interest and enterprise holdings by companies like Strategy (MSTR), though direct enterprise adoption comparisons between NIZA and XTZ are not detailed.
- Regulatory Environment: Materials reference various national approaches to cryptocurrency regulation, including historical policy statements, though specific regulatory stances toward NIZA or XTZ individually are not documented in provided sources.
Technology Development and Ecosystem Building
- NIZA Technology: Specific technical upgrades or development roadmaps are not detailed in available reference materials.
- XTZ Technology: Materials reference XTZ within discussions of blockchain fork resolution and ecosystem connectivity, though detailed technical development timelines are not provided.
- Ecosystem Comparison: Reference materials discuss broader trends in DeFi, tokenization of real-world assets, and trading platform development (such as KuCoin's 2025 volume growth), though specific ecosystem metrics for NIZA and XTZ applications are not documented.
Macroeconomic Environment and Market Cycles
- Performance During Inflation: Materials reference gold and silver price movements (gold near $4,757.30, silver at $94.25) alongside cryptocurrency market dynamics, though specific inflation-hedge characteristics of NIZA or XTZ are not analyzed in available sources.
- Macroeconomic Policy Impact: Reference materials document market reactions to broader conditions, including S&P 500 declines (approximately 1.8%), Nasdaq drops (2%), and VIX increases (around 5%), alongside cryptocurrency market movements, though direct correlations to interest rates or dollar index effects on NIZA and XTZ specifically are not provided.
- Geopolitical Factors: Materials reference the US dollar's role as reserve currency and its use in international commodity pricing, along with discussions of cross-border transaction needs, though specific geopolitical impacts on NIZA or XTZ are not detailed in available context.
III. 2026-2031 Price Prediction: NIZA vs XTZ
Short-term Prediction (2026)
- NIZA: Conservative $0.033-$0.056 | Optimistic $0.056-$0.077
- XTZ: Conservative $0.555-$0.572 | Optimistic $0.572-$0.778
Medium-term Prediction (2028-2029)
- NIZA may enter a gradual growth phase, with projected price range of $0.052-$0.111
- XTZ may enter a consolidation and expansion phase, with projected price range of $0.487-$1.036
- Key drivers: institutional capital inflows, ETF developments, ecosystem expansion
Long-term Prediction (2031)
- NIZA: Baseline scenario $0.114-$0.117 | Optimistic scenario $0.117-$0.159
- XTZ: Baseline scenario $0.739-$1.012 | Optimistic scenario $1.012-$1.093
View detailed price predictions for NIZA and XTZ
Disclaimer
NIZA:
| Year |
Predicted High Price |
Predicted Average Price |
Predicted Low Price |
Price Change |
| 2026 |
0.07729266 |
0.056418 |
0.03272244 |
0 |
| 2027 |
0.0909232488 |
0.06685533 |
0.0474672843 |
18 |
| 2028 |
0.093089361492 |
0.0788892894 |
0.067844788884 |
40 |
| 2029 |
0.11092622982534 |
0.085989325446 |
0.0515935952676 |
52 |
| 2030 |
0.135871733137224 |
0.09845777763567 |
0.065966711015898 |
74 |
| 2031 |
0.159344067325568 |
0.117164755386447 |
0.113649812724853 |
108 |
XTZ:
| Year |
Predicted High Price |
Predicted Average Price |
Predicted Low Price |
Price Change |
| 2026 |
0.778328 |
0.5723 |
0.555131 |
0 |
| 2027 |
0.87115506 |
0.675314 |
0.43220096 |
17 |
| 2028 |
1.0284019249 |
0.77323453 |
0.4871377539 |
34 |
| 2029 |
1.0359409615675 |
0.90081822745 |
0.7656954933325 |
57 |
| 2030 |
1.055533758014537 |
0.96837959450875 |
0.81343885938735 |
68 |
| 2031 |
1.092913210362575 |
1.011956676261643 |
0.738728373670999 |
76 |
IV. Investment Strategy Comparison: NIZA vs XTZ
Long-term vs Short-term Investment Strategies
- NIZA: May suit investors focusing on emerging ecosystem potential and early-stage growth opportunities, with consideration for higher volatility characteristics associated with newer market entrants.
- XTZ: May suit investors seeking established blockchain infrastructure exposure and participation in governance-enabled networks, with consideration for projects demonstrating longer operational history.
Risk Management and Asset Allocation
- Conservative Investors: NIZA 15-20% vs XTZ 80-85%
- Aggressive Investors: NIZA 40-50% vs XTZ 50-60%
- Hedging Tools: Stablecoin allocation, options strategies, cross-asset portfolio diversification
V. Potential Risk Comparison
Market Risk
- NIZA: Limited historical price data and lower liquidity levels (24-hour trading volume of $54,536.28) may contribute to increased price volatility during market fluctuations.
- XTZ: Price movements have demonstrated sensitivity to broader market cycles, with historical ranges from $0.35 to $9.12, reflecting exposure to cryptocurrency market sentiment shifts.
Technical Risk
- NIZA: As a newer platform launched in 2025, scalability testing and network stability validation remain in development phases.
- XTZ: Materials reference the platform's approach to network upgrades through on-chain governance, though specific technical vulnerability assessments are not detailed in available sources.
Regulatory Risk
- Global regulatory developments may affect both assets differently based on their respective functional classifications, ecosystem applications, and jurisdictional operations, though specific policy positions toward each token are not documented in provided materials.
VI. Conclusion: Which Is the Better Buy?
📌 Investment Value Summary:
- NIZA Characteristics: Represents exposure to an emerging ecosystem launched in 2025, with features designed for trading and staking participation, though accompanied by limited historical performance data and smaller market capitalization ($8.45M).
- XTZ Characteristics: Offers exposure to an established blockchain platform operational since 2017, with governance mechanisms and formal verification approaches, supported by larger market capitalization ($613.76M) and higher trading volumes.
✅ Investment Considerations:
- New Investors: May consider starting with assets demonstrating longer operational histories and established liquidity profiles before exploring newer market entrants, with appropriate position sizing relative to risk tolerance.
- Experienced Investors: May evaluate portfolio diversification opportunities across different market capitalization segments and development stages, with consideration for historical volatility patterns and ecosystem maturity levels.
- Institutional Investors: May prioritize assets with demonstrated liquidity depth, regulatory clarity, and established custody solutions, while monitoring emerging opportunities through pilot allocation frameworks.
⚠️ Risk Disclosure: Cryptocurrency markets demonstrate significant volatility characteristics. This analysis does not constitute investment advice. Individuals should conduct independent research and consult qualified professionals before making investment decisions.
VII. FAQ
Q1: What is the main difference between NIZA and XTZ in terms of market maturity?
XTZ is a significantly more established asset with a longer operational history and larger market presence, while NIZA represents a newer market entrant. XTZ launched in 2017 with a current market capitalization of $613.76M and 24-hour trading volume of $524,473.99, demonstrating established liquidity and institutional recognition. NIZA, launched in September 2025, has a market capitalization of $8.45M and trading volume of $54,536.28, positioning it as an early-stage project with limited historical performance data but potential for ecosystem growth.
Q2: How do the price volatility characteristics differ between NIZA and XTZ?
Both assets demonstrate volatility, but with different magnitude patterns. XTZ has experienced a historical price range from $0.35 (December 2018 low) to $9.12 (October 2021 high), reflecting established market cycles and broader cryptocurrency sentiment impacts. NIZA has moved from $0.37 to approximately $0.056 since its launch, with limited trading history making volatility assessment preliminary. The lower liquidity levels of NIZA ($54,536.28 daily volume) may contribute to increased price sensitivity during market fluctuations compared to XTZ's relatively higher liquidity profile.
Q3: What are the key technological differences between NIZA and XTZ platforms?
XTZ operates as a self-evolving blockchain platform employing formal verification techniques and on-chain governance mechanisms, allowing network upgrades without hard forks while ensuring smart contract security through mathematical proof methodologies. NIZA is positioned as a digital asset powering an ecosystem with utility features for trading, staking, and platform participation, though specific technical architecture details and upgrade mechanisms are not extensively documented in available materials. XTZ demonstrates a longer track record of technical development since 2017, while NIZA's technical maturity remains in earlier validation phases.
Q4: Which asset is more suitable for conservative investors?
XTZ may present characteristics more aligned with conservative investment approaches. The asset demonstrates established market presence, higher liquidity levels, longer operational history since 2017, and larger market capitalization ($613.76M versus $8.45M). Conservative allocation strategies suggested in the analysis recommend 80-85% XTZ versus 15-20% NIZA for risk-averse portfolios. However, conservative investors should prioritize comprehensive due diligence, appropriate position sizing relative to total portfolio composition, and recognition that all cryptocurrency assets carry significant volatility characteristics regardless of maturity level.
Q5: What is the projected price outlook for NIZA and XTZ through 2031?
Price predictions suggest differentiated growth trajectories. For 2026, NIZA conservative estimates range $0.033-$0.056 with optimistic scenarios reaching $0.056-$0.077, while XTZ conservative estimates range $0.555-$0.572 with optimistic scenarios of $0.572-$0.778. Long-term 2031 projections indicate NIZA baseline scenarios of $0.114-$0.117 (optimistic $0.117-$0.159) and XTZ baseline scenarios of $0.739-$1.012 (optimistic $1.012-$1.093). These projections incorporate assumptions about institutional capital flows, ecosystem development, and broader market cycle dynamics, though actual outcomes may vary significantly based on numerous unpredictable factors.
Q6: How do institutional adoption levels compare between NIZA and XTZ?
XTZ demonstrates more established institutional recognition, referenced within discussions of exchange ecosystem connectivity and liquidity infrastructure through platforms like Binance. The asset's longer operational history since 2017 has allowed for gradual institutional evaluation and integration into custody solutions and trading platforms. NIZA, as a 2025 launch, has limited documented institutional adoption history, representing earlier-stage institutional evaluation phases. Specific institutional holding data, enterprise adoption metrics, and custody solution availability comparisons require additional research beyond available reference materials for comprehensive assessment.
Q7: What are the primary risk factors investors should consider for each asset?
NIZA's primary risks include limited historical performance data, lower liquidity levels increasing potential price volatility, early-stage platform scalability testing requirements, and smaller market capitalization increasing susceptibility to large transaction impacts. XTZ's risks encompass exposure to broader cryptocurrency market cycles (demonstrated through historical price ranges from $0.35 to $9.12), technical considerations related to network governance upgrade processes, and regulatory classification uncertainties affecting blockchain platforms. Both assets face common cryptocurrency market risks including regulatory developments, macroeconomic policy impacts, technological competition, and market sentiment fluctuations reflected in the current Fear & Greed Index of 20 (Extreme Fear).
Q8: How should investors approach portfolio allocation between NIZA and XTZ?
Portfolio allocation should align with individual risk tolerance, investment timeframes, and market experience levels. Conservative investors may consider 80-85% XTZ and 15-20% NIZA allocations, prioritizing established market presence and liquidity. Aggressive investors might evaluate 50-60% XTZ and 40-50% NIZA distributions, accepting higher volatility for potential early-stage growth exposure. All investors should implement risk management frameworks including stablecoin reserves for volatility buffering, position sizing relative to total portfolio composition (not exceeding comfortable loss thresholds), diversification across asset categories beyond cryptocurrency markets, and regular portfolio rebalancing aligned with market condition changes and personal circumstance evolution.
* The information is not intended to be and does not constitute financial advice or any other recommendation of any sort offered or endorsed by Gate.