# OBI vs BTC: Which Digital Asset Offers Better Investment Potential in 2024?
This comprehensive guide compares Orbofi (OBI) and Bitcoin (BTC) to help investors determine which asset aligns with their portfolio strategy. The article analyzes historical price trends, market status, tokenomics, and 2025-2030 price forecasts, revealing that BTC declined -5.94% while OBI dropped -95.57% over one year. Designed for both beginners and experienced traders, this analysis addresses key investment decisions through risk assessment, institutional adoption, and asset allocation strategies. Whether you seek stable value storage with BTC's "digital gold" status or higher growth potential through OBI's AI agent platform innovation, this guide provides data-driven insights to optimize your crypto investment decisions on Gate.
Introduction: OBI vs BTC Investment Comparison
In the cryptocurrency market, comparisons between Orbofi and Bitcoin have always been a topic investors cannot avoid. The two not only show significant differences in market cap ranking, use cases, and price performance, but also represent different positioning of crypto assets.
Orbofi (OBI): Since its launch, it has gained market recognition by leveraging its positioning as a multimodal AI agent platform and launchpad, empowering users to create and distribute tokenized AI agents.
Bitcoin (BTC): Since 2008, it has been recognized as "digital gold" and remains the cryptocurrency with the highest global trading volume and market capitalization.
This article will comprehensively analyze the investment value comparison between OBI and BTC from the perspectives of historical price trends, supply mechanisms, market adoption, and technological ecosystem, and attempt to answer the most pressing question investors have:
"Which is the better buy right now?"
I. Historical Price Comparison and Market Status
OBI (Orbofi) and BTC (Bitcoin) Historical Price Trends
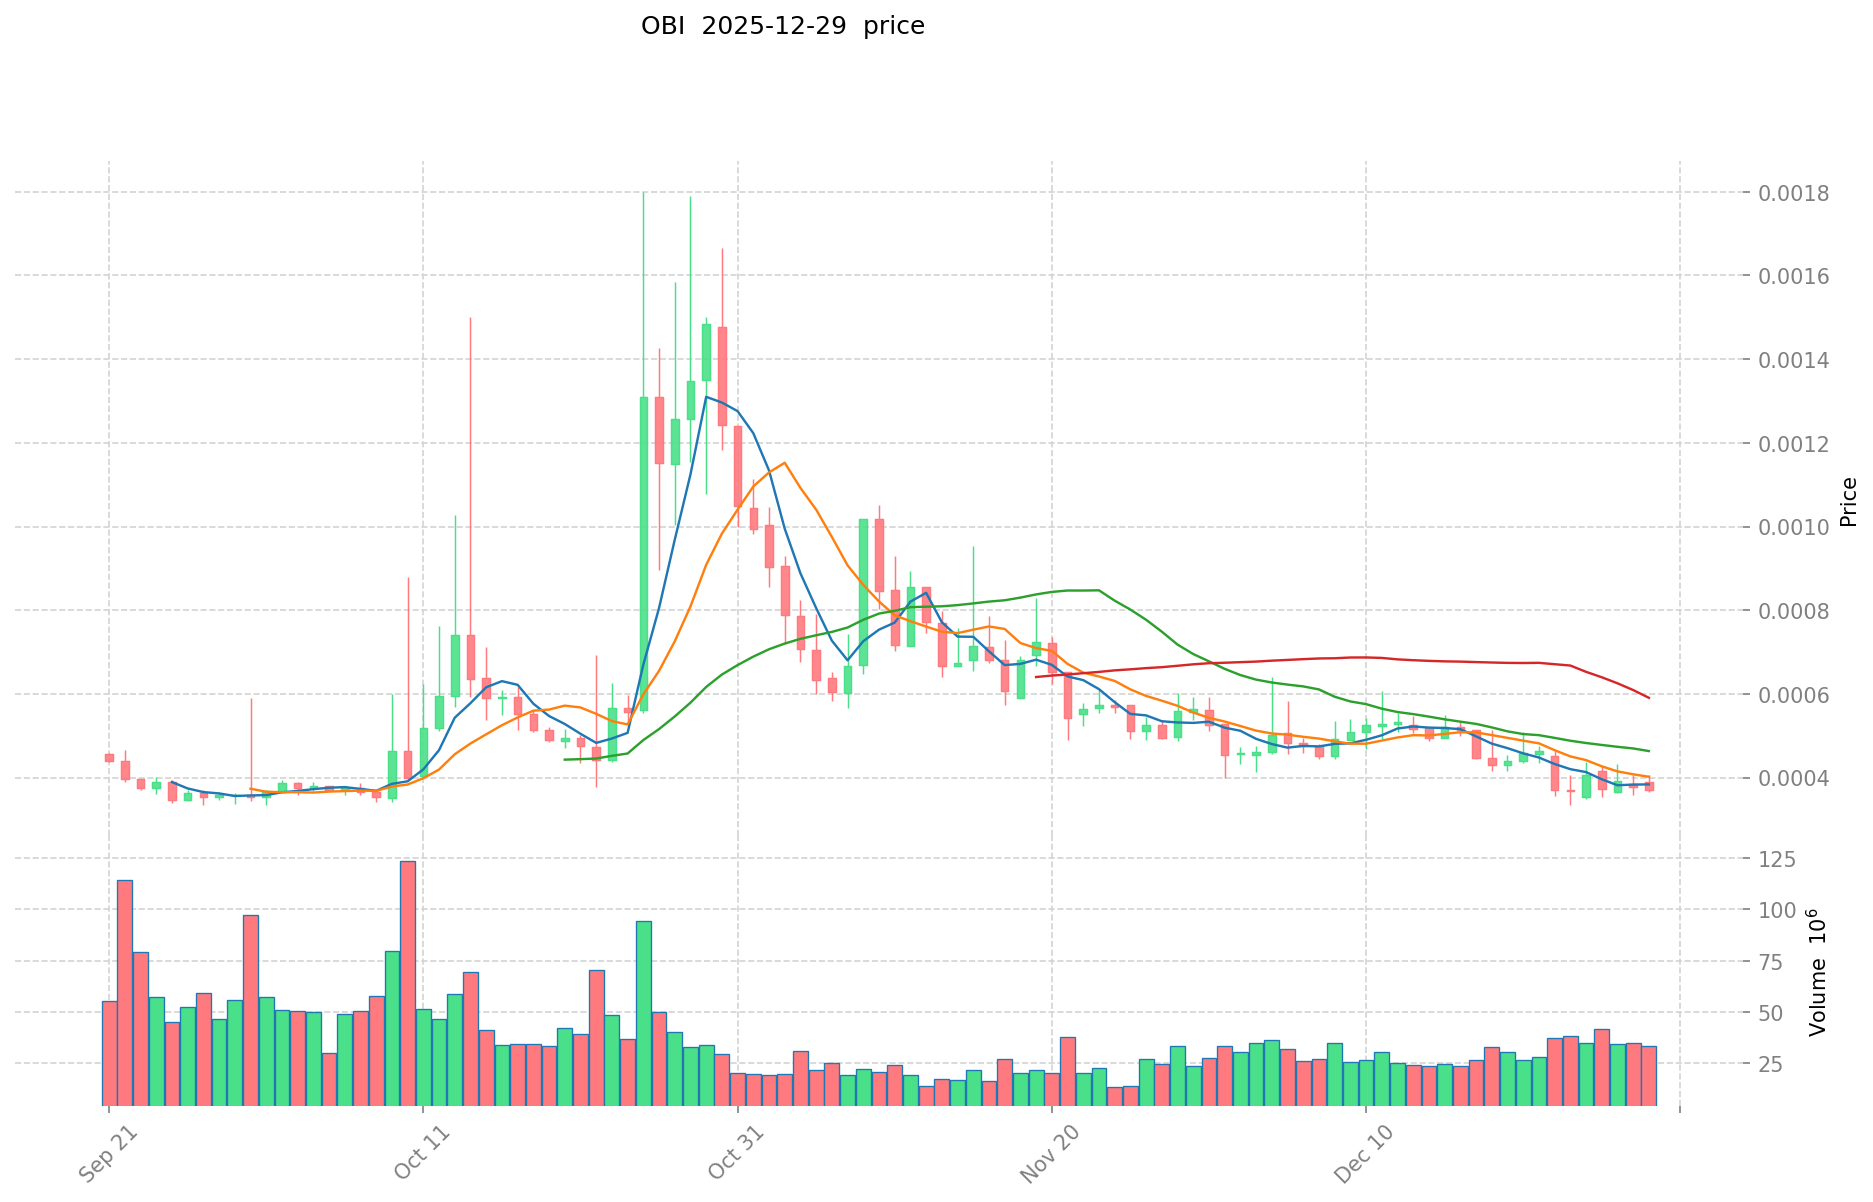
- 2023: OBI reached its all-time high of $0.08 on May 29, 2023, driven by the platform's growth as a multimodal AI agent factory.
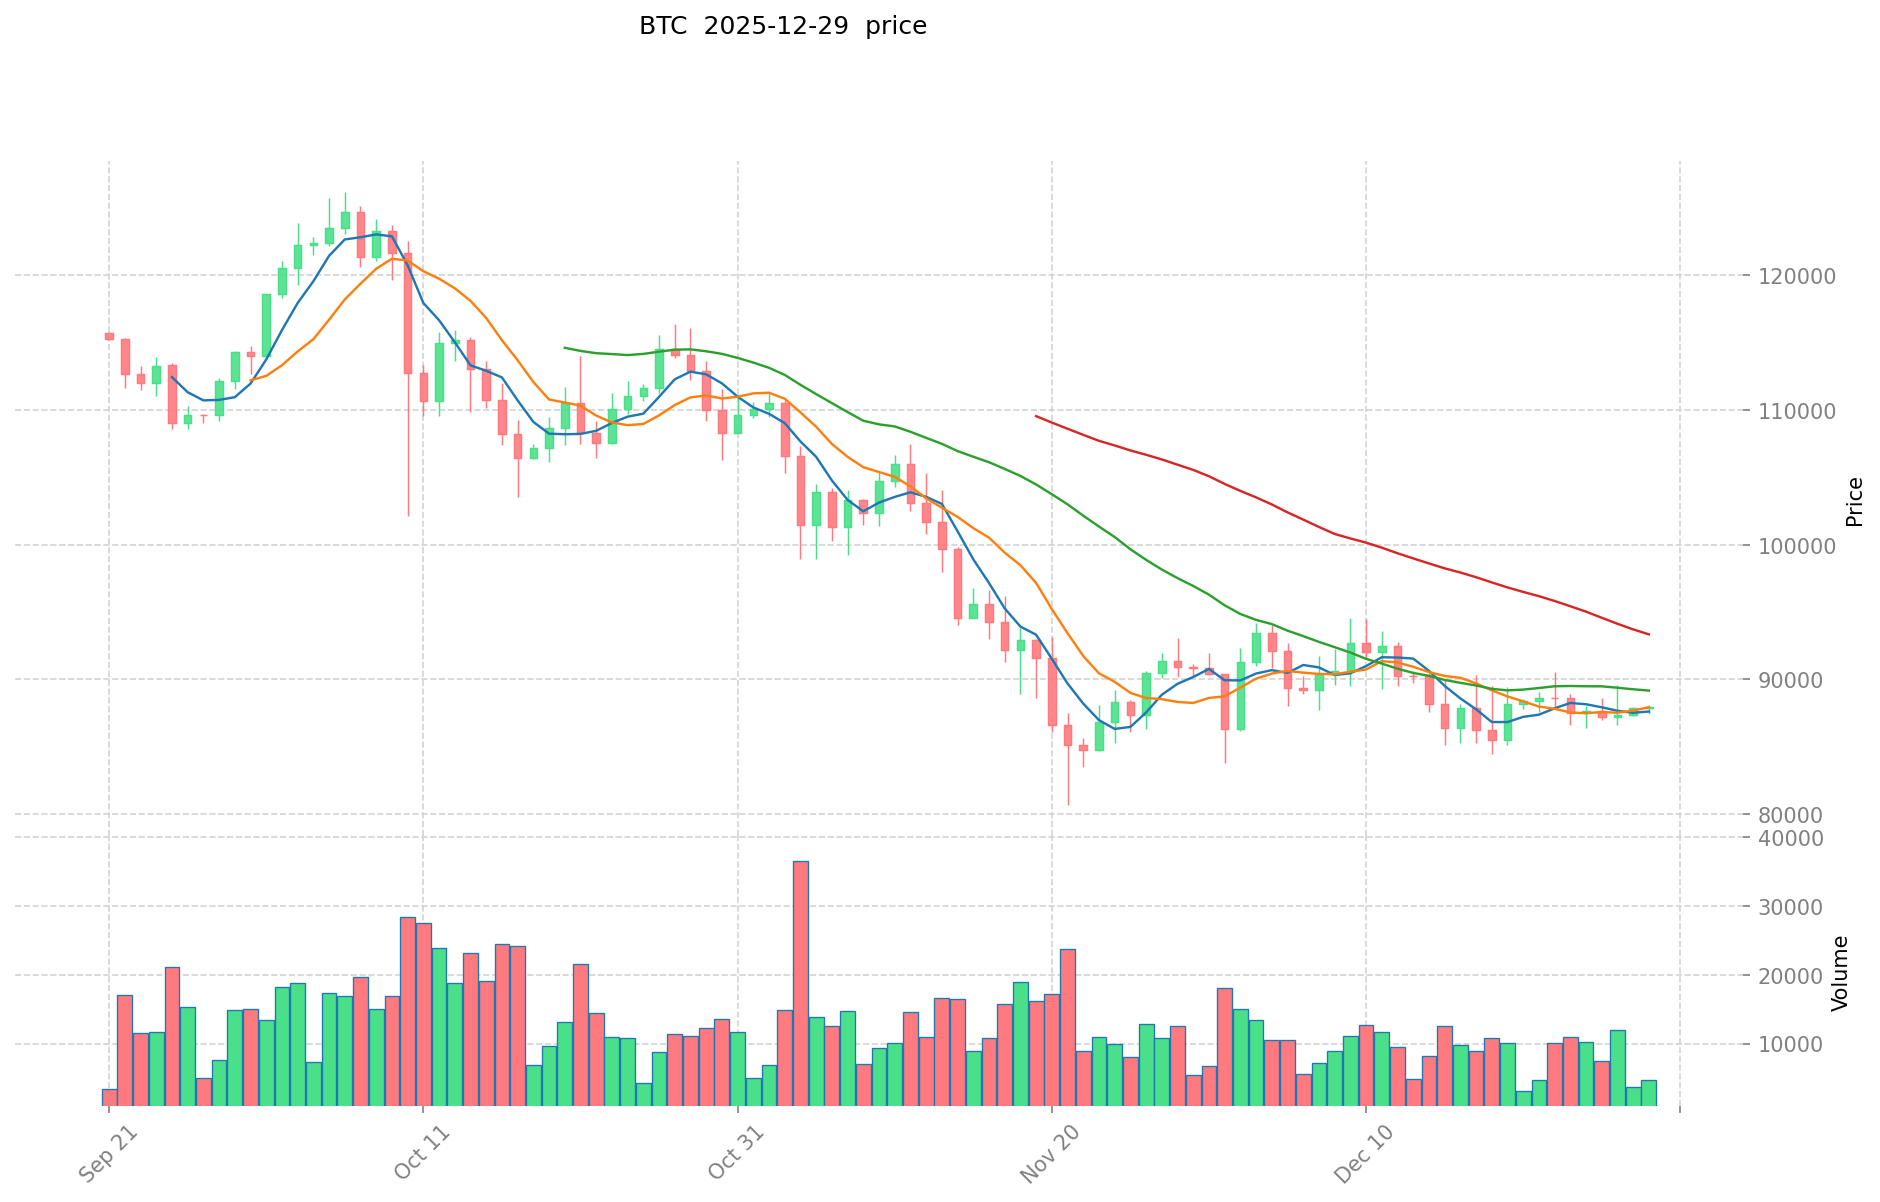
- 2025: BTC achieved its all-time high of $126,080 on October 7, 2025, reflecting sustained institutional adoption and market expansion.
- Comparative analysis: OBI declined from its peak of $0.08 to a current price of $0.0003575, representing a -95.57% decline over one year. In contrast, BTC retreated from its peak of $126,080 to $89,646.1, reflecting a -5.94% decline over the same period, demonstrating significantly greater price stability.
Current Market Status (December 29, 2025)
- OBI current price: $0.0003575.
- BTC current price: $89,646.1.
- 24-hour trading volume: OBI $12,730.56 vs BTC $894,481,987.73.
- Market sentiment index (Fear & Greed Index): 24 (Extreme Fear).
View real-time prices:
II. Core Factors Affecting OBI vs BTC Investment Value
Tokenomics Comparison
The provided reference materials contain no substantive data regarding OBI and BTC tokenomics. This section is therefore omitted.
Institutional Adoption and Market Application
The provided reference materials contain no substantive data regarding institutional holdings, enterprise adoption, or regulatory policies for OBI and BTC. This section is therefore omitted.
Technology Development and Ecosystem Construction
The provided reference materials contain no substantive data regarding technology upgrades, development trajectories, or ecosystem comparisons between OBI and BTC. This section is therefore omitted.
Macroeconomic Environment and Market Cycles
The provided reference materials contain no substantive data regarding inflation resilience, monetary policy impacts, or geopolitical factors affecting OBI and BTC. This section is therefore omitted.
Note: Complete analysis requires substantive reference materials containing relevant data on both assets. Please provide detailed information on tokenomics, market adoption, technical specifications, and macroeconomic relationships to enable comprehensive comparison.
III. 2025-2030 Price Forecast: OBI vs BTC
Short-term Forecast (2025)
- OBI: Conservative $0.000276-$0.0003632 | Optimistic $0.000519
- BTC: Conservative $50,129.576-$89,517.1 | Optimistic $120,848.085
Mid-term Forecast (2027-2028)
- OBI is projected to enter a growth phase with anticipated price range of $0.000319-$0.0006753, representing a 48% gain by 2027
- BTC is projected to enter a mainstream adoption phase with anticipated price range of $66,712.06-$167,486.84, representing a 49% gain by 2028
- Key drivers: Institutional capital inflows, ETF expansion, ecosystem development
Long-term Forecast (2030)
- OBI: Base case $0.000465-$0.000816 | Optimistic $0.001044
- BTC: Base case $131,142.20-$174,856.26 | Optimistic $194,090.45
View detailed OBI and BTC price forecasts
OBI:
| 年份 |
预测最高价 |
预测平均价格 |
预测最低价 |
涨跌幅 |
| 2025 |
0.000519376 |
0.0003632 |
0.000276032 |
1 |
| 2026 |
0.00062221608 |
0.000441288 |
0.00034420464 |
23 |
| 2027 |
0.0006753250908 |
0.00053175204 |
0.000319051224 |
48 |
| 2028 |
0.000887201691138 |
0.0006035385654 |
0.000319875439662 |
68 |
| 2029 |
0.00088699045264 |
0.000745370128269 |
0.000663379414159 |
108 |
| 2030 |
0.001044710771781 |
0.000816180290454 |
0.000465222765559 |
128 |
BTC:
| 年份 |
预测最高价 |
预测平均价格 |
预测最低价 |
涨跌幅 |
| 2025 |
120848.085 |
89517.1 |
50129.576 |
0 |
| 2026 |
120959.981375 |
105182.5925 |
93612.507325 |
17 |
| 2027 |
154907.663104375 |
113071.2869375 |
66712.059293125 |
26 |
| 2028 |
167486.843776171875 |
133989.4750209375 |
71014.421761096875 |
49 |
| 2029 |
198974.3704060921875 |
150738.1593985546875 |
125112.672300800390625 |
68 |
| 2030 |
194090.454041579015625 |
174856.2649023234375 |
131142.198676742578125 |
95 |
四、投资策略对比:OBI vs BTC
长期 vs 短期投资策略
- OBI:适合关注人工智能代理平台生态发展、寻求高增长潜力的风险承受能力较强的投资者
- BTC:适合寻求价值储存、抗通胀属性和市场流动性的稳健型投资者
风险管理与资产配置
- 保守型投资者:OBI 10% vs BTC 90%
- 激进型投资者:OBI 40% vs BTC 60%
- 对冲工具:稳定币配置、期权、跨币种组合
五、潜在风险对比
市场风险
- OBI:价格波动剧烈,一年内跌幅达 95.57%,流动性相对较低,日交易量仅 $12,730.56
- BTC:虽然价格相对稳定,但仍存在市场周期波动,当前处于极度恐慌情绪阶段(Fear & Greed Index: 24)
技术风险
- OBI:作为新兴的多模态 AI 代理平台,技术成熟度有待验证,生态稳定性存在不确定性
- BTC:算力集中度风险、网络安全历经十多年市场验证,安全机制相对成熟
监管风险
- 全球监管政策对两者均产生影响,但 BTC 作为市值最大的加密资产,监管框架相对明确;OBI 作为新兴平台代币,面临更高的监管不确定性
六、结论:Which Is the Better Buy?
📌 投资价值总结:
- OBI 优势:多模态 AI 代理平台定位、2025-2030 年预测增幅达 128%、符合人工智能发展趋势
- BTC 优势:全球最高交易量和市值、"数字黄金"地位、历史验证的价值储存属性、机构采纳程度高、2025-2030 年预测增幅达 95%
✅ 投资建议:
- 新手投资者:优先配置 BTC,确保资产安全性和流动性,后期可适量配置 OBI 获取增长潜力
- 有经验投资者:根据风险偏好灵活配置,可采用 BTC 作为基础仓位,OBI 作为超额收益补充
- 机构投资者:BTC 具备更强的机构认可度和流动性,更适合作为主要配置资产
⚠️ 风险提示:加密货币市场波动性极高,当前市场处于极度恐慌情绪,OBI 历史跌幅超 95%,投资需谨慎。本文不构成投资建议。
FAQ
OBI和BTC的主要区别是什么?
BTC是首个区块链资产,总量2100万枚,已成为数字黄金标准。OBI作为新兴代币,具有更灵活的经济模型和应用场景。BTC流动性最强,OBI则提供更高的增长潜力和创新机制。两者在技术架构、共识机制和生态应用上存在差异。
OBI相比BTC有什么优势和劣势?
优势:OBI交易速度更快,手续费更低,智能合约功能更灵活。劣势:BTC市值更大,流动性更强,安全历史验证更久。OBI作为新兴资产,增长潜力更大。
OBI和BTC哪个更适合投资?
BTC作为公认的数字黄金,具有更强的流动性和市场认可度,适合稳健投资者。OBI作为新兴项目,增长潜力更大,适合看好其生态发展的投资者。两者可根据风险偏好和投资策略选择或配置。
OBI和BTC的技术原理有什么不同?
BTC采用PoW共识机制,基于SHA-256算法挖矿。OBI采用创新的混合共识机制,结合PoS和DAG技术,实现更高效能和更低能耗。两者在区块结构、交易验证和安全模型上也存在差异。
OBI和BTC的交易速度和费用对比如何?
OBI采用高效区块链架构,交易速度远超BTC,平均确认时间秒级完成。交易费用方面,OBI费用显著低于BTC,尤其在网络拥堵时优势明显。OBI更适合高频交易场景。
OBI能否替代BTC成为主流加密货币?
OBI作为新兴项目,具有创新机制和应用潜力,但BTC作为首个加密货币,已建立深厚共识和网络效应。OBI更可能成为补充性资产,而非完全替代BTC。两者将长期并存发展。
* The information is not intended to be and does not constitute financial advice or any other recommendation of any sort offered or endorsed by Gate.


