This comprehensive guide compares Open Loot (OL) and Tezos (XTZ) as blockchain investment opportunities, examining their distinct market positions and performance metrics. OL, a Web3 gaming distribution platform launched in 2021, demonstrates higher volatility with an 83.91% annual decline, while XTZ, an established blockchain infrastructure since 2017, shows more moderate 52.059% adjustment. The analysis covers historical price trends, tokenomics mechanisms, institutional adoption patterns, and technological ecosystems of both assets. XTZ offers staking income-generation through Proof-of-Stake validation, whereas OL presents speculative gaming sector exposure. Price forecasts through 2031 project XTZ reaching $0.656-$1.592 and OL reaching $0.0220-$0.0293 under optimistic scenarios. Conservative investors favor XTZ's established infrastructure and passive income potential, while aggressive investors may allocate to OL's emerging opportunities, with allocation strategies ranging from 10-15% OL for conservative
Introduction: Investment Comparison Between OL and XTZ
In the cryptocurrency market, the comparison between Open Loot (OL) and Tezos (XTZ) continues to attract investor attention. The two assets differ significantly in market capitalization ranking, application scenarios, and price performance, representing distinct positioning within the crypto asset landscape.
Open Loot (OL): Launched in November 2021, this Web3 gaming distribution platform and marketplace has positioned itself to support game developers and publishers with go-to-market strategies, distribution, user experience, and payment solutions.
Tezos (XTZ): Introduced in October 2017, this decentralized blockchain has established itself as a self-amending cryptographic ledger, utilizing formal verification techniques to enhance smart contract security and transaction accuracy.
This article will provide a comprehensive analysis of the OL vs XTZ investment value comparison, examining historical price trends, supply mechanisms, institutional adoption, technological ecosystems, and future projections, attempting to address the question that concerns investors most:
"Which is the better buy right now?"
I. Historical Price Comparison and Current Market Status
Open Loot (OL) and Tezos (XTZ) Historical Price Trends
-
2024: Open Loot experienced a notable price movement, reaching its all-time high of $0.69 in December 2024. This represented a period of significant market interest in the Web3 gaming distribution platform.
-
2021: Tezos reached its all-time high of $9.12 in October 2021, coinciding with broader market momentum across blockchain platforms focused on smart contracts and decentralized applications.
-
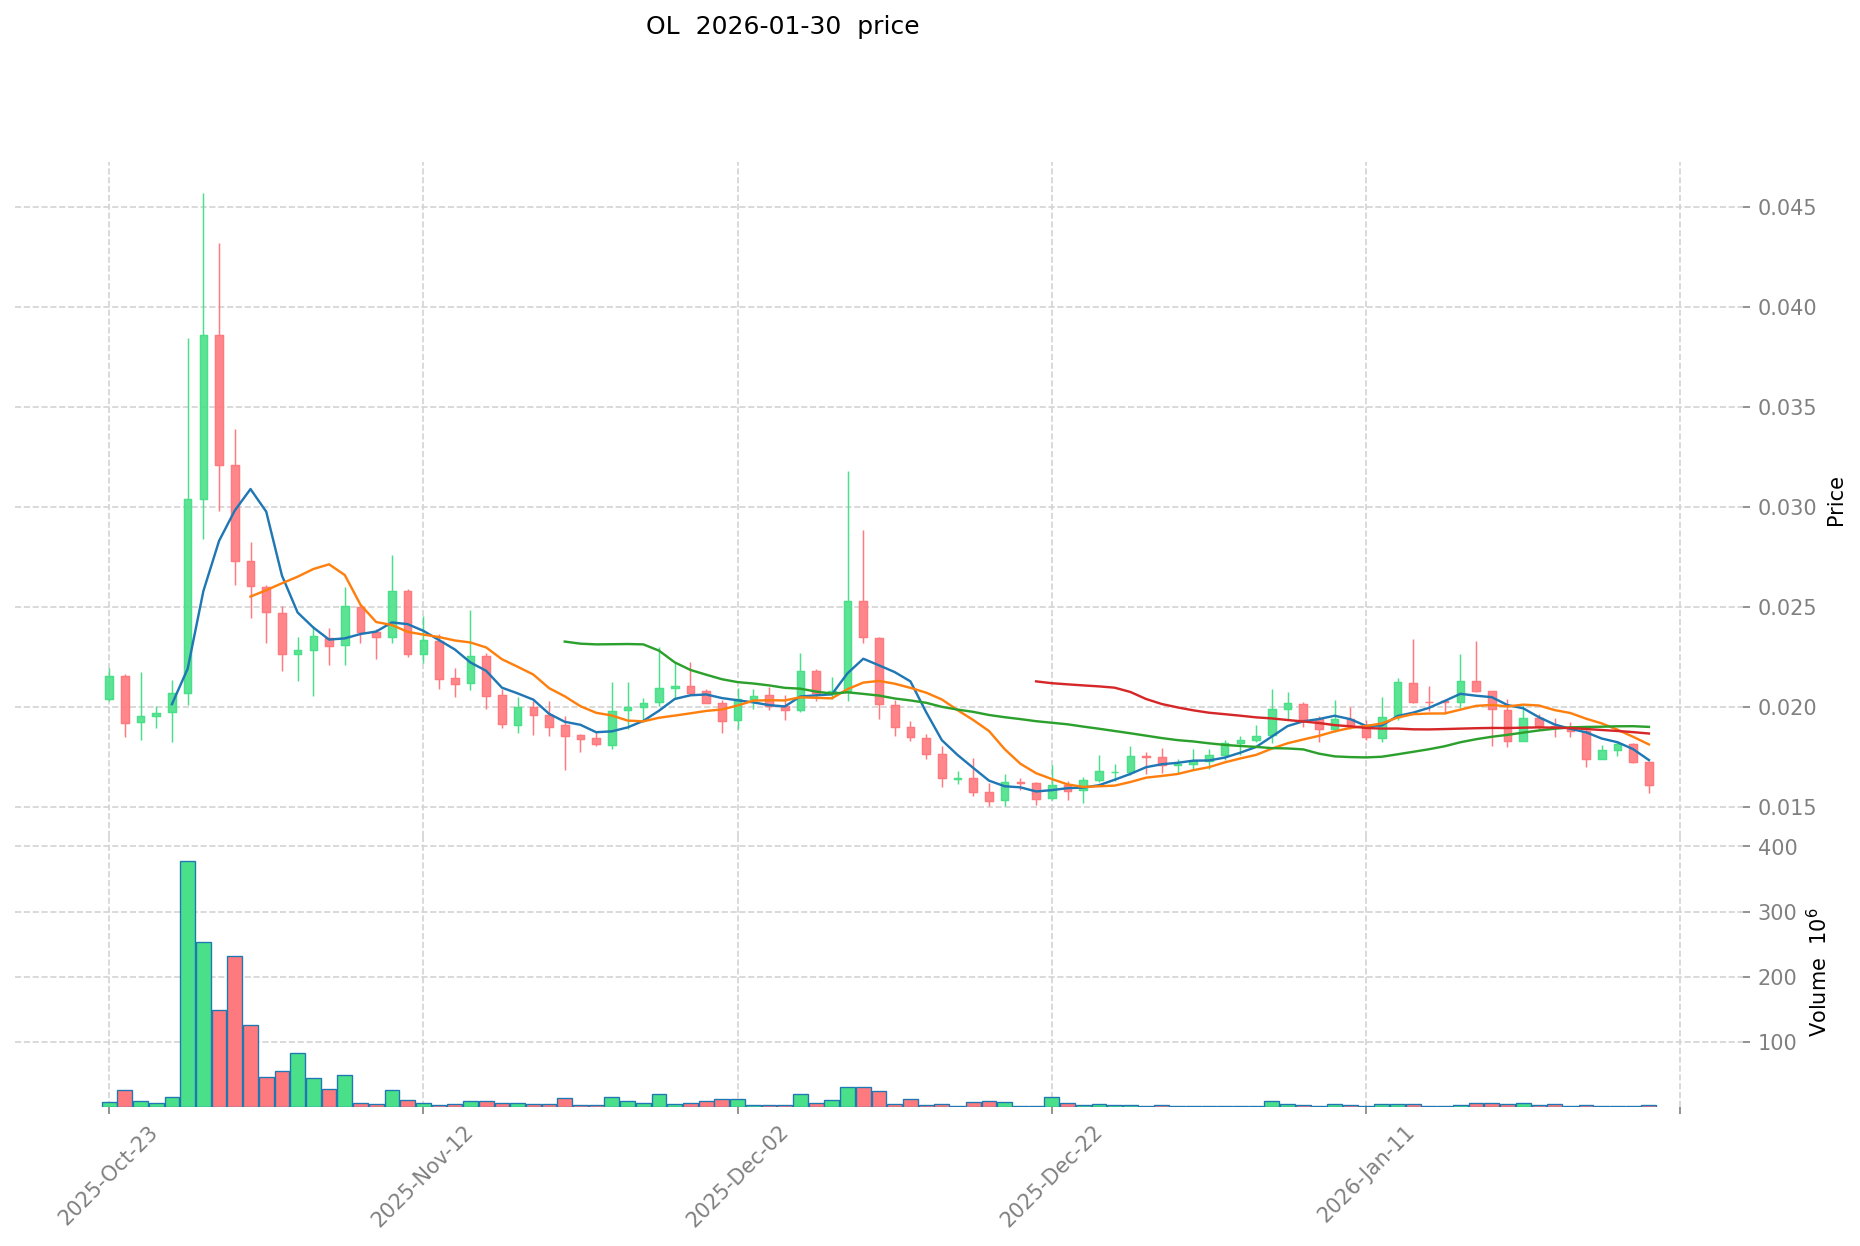
2025: Open Loot faced substantial downward pressure, declining to its all-time low of $0.00274 in October 2025, reflecting a period of market correction.
-
2018: Tezos recorded its all-time low of $0.350476 in December 2018, shortly after its initial launch period.
-
Comparative Analysis: During recent market cycles, Open Loot has experienced a decline of approximately 83.91% over the past year, while Tezos has seen a decrease of approximately 52.059% during the same period, indicating varying degrees of market adjustment across both assets.
Current Market Status (2026-01-31)
- Open Loot current price: $0.01573
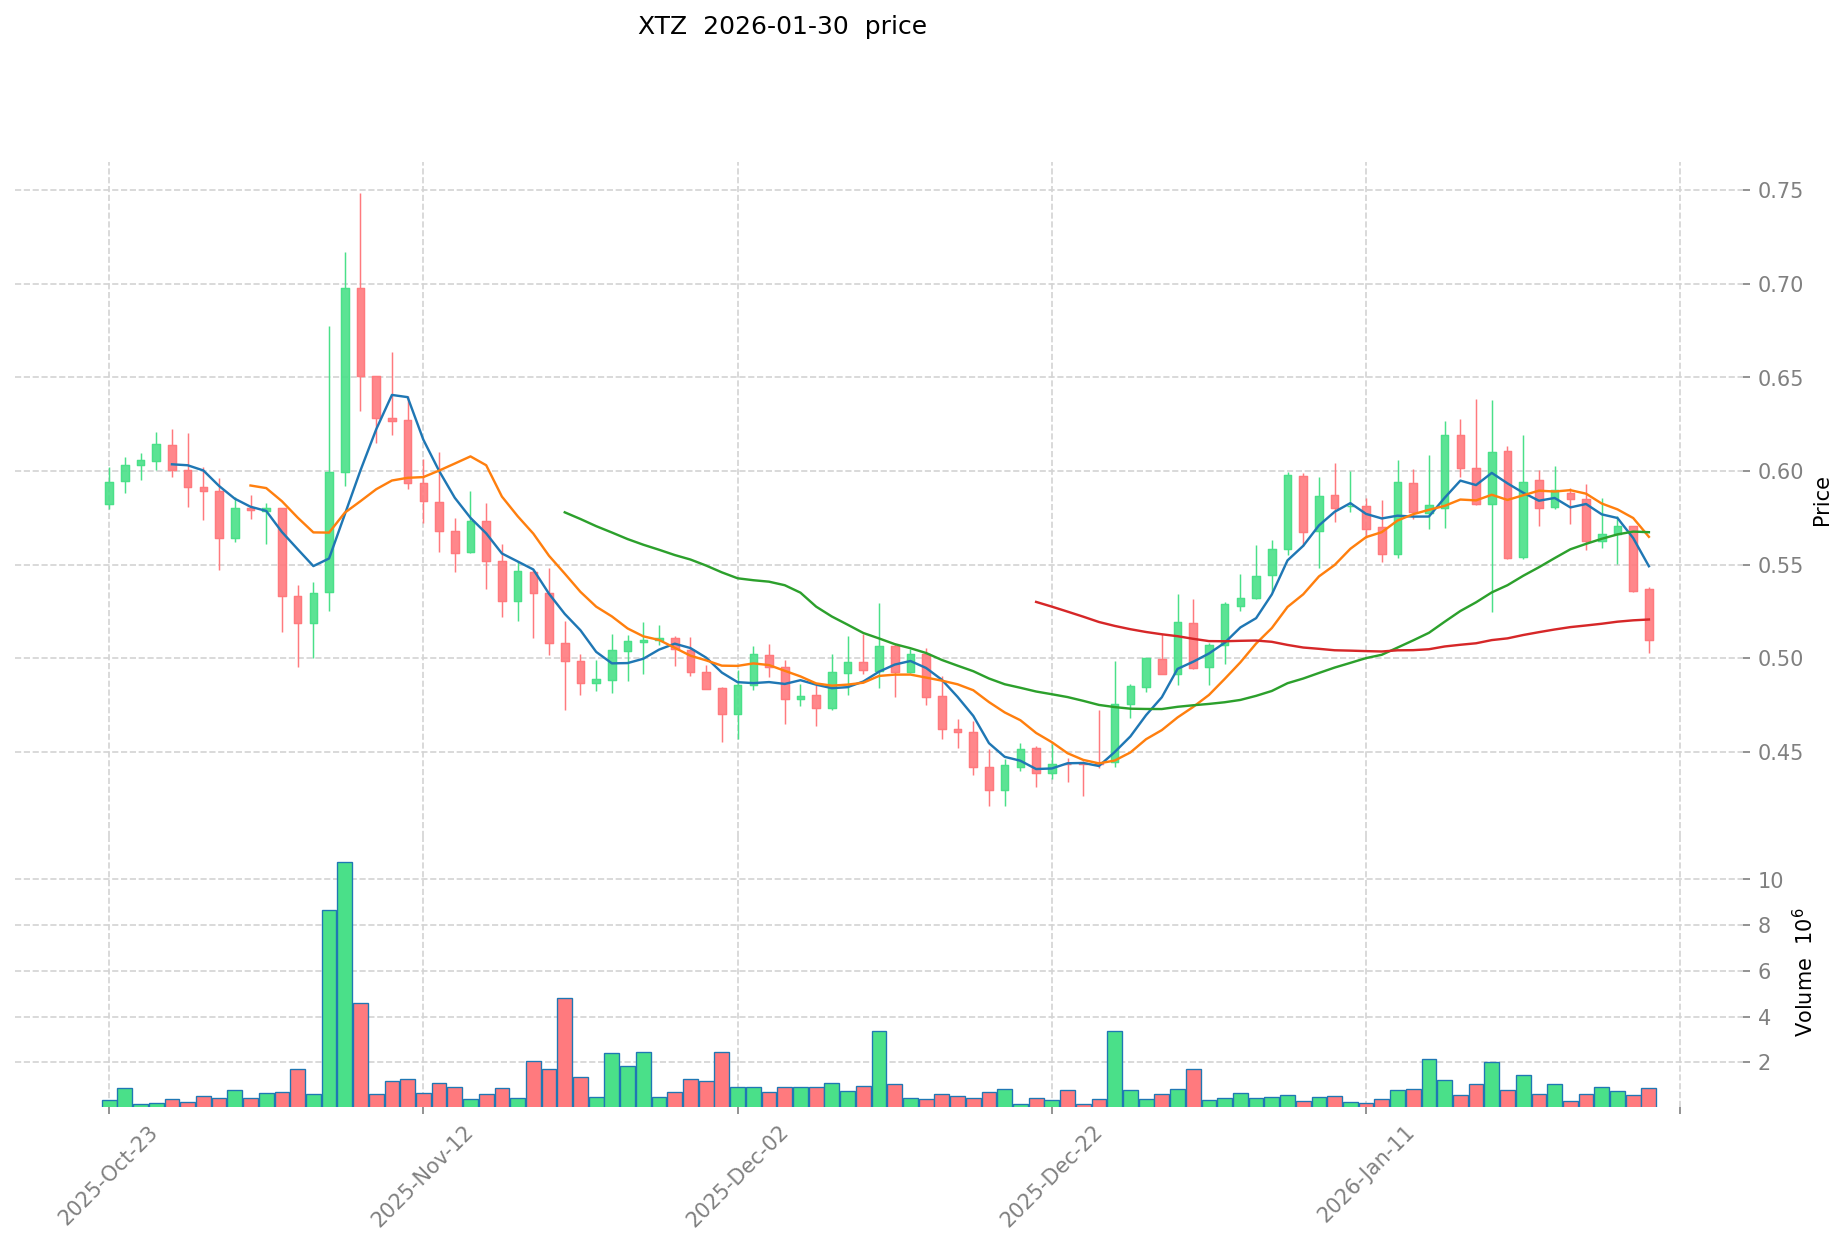
- Tezos current price: $0.507
- 24-hour trading volume: Open Loot recorded $32,938.2487391 compared to Tezos at $526,507.4948112
- Market Sentiment Index (Fear & Greed Index): 16 (Extreme Fear)
View real-time prices:
II. Core Factors Influencing OL vs XTZ Investment Value
Supply Mechanism Comparison (Tokenomics)
- OL: The provided materials do not contain specific information about OL's supply mechanism or tokenomics model.
- XTZ: According to the reference materials, TenX plans to stake Tezos through self-operated validator nodes to generate sustainable income. The Tezos Foundation intends to delegate part of XTZ to TenX-operated validator nodes after completing due diligence and internal approval. This staking mechanism indicates that XTZ employs a Proof-of-Stake consensus model, where token holders can participate in network validation and earn rewards.
- 📌 Historical Pattern: Supply mechanisms influence token value through inflation control and incentive structures. Staking mechanisms may reduce circulating supply, potentially creating upward pressure on prices, though market outcomes depend on multiple variables.
Institutional Adoption and Market Applications
- Institutional Holdings: The materials reference institutional involvement in crypto assets broadly. SBI Group's 2024 report mentions that the SEC's approval of spot Bitcoin ETFs in January 2024 accelerated institutional investor entry into crypto asset markets, suggesting growing institutional acceptance of digital assets generally.
- Enterprise Adoption: Specific comparative data on OL versus XTZ enterprise adoption is not available in the provided materials. The reference to TenX's partnership with Tezos Foundation suggests some level of institutional engagement with XTZ.
- National Policies: The materials mention varying regulatory attitudes across jurisdictions. SBI Group's discussion of stablecoin regulations in Japan and their partnership with Circle (USDC issuer) reflects evolving policy frameworks, though specific comparative regulatory treatment of OL versus XTZ is not detailed.
Technology Development and Ecosystem Building
- OL Technical Upgrades: The provided materials contain no specific information regarding OL's technical development roadmap or ecosystem initiatives.
- XTZ Technical Development: According to the reference materials, Tezos utilizes a validator node system and staking mechanism. The mention of TenX operating validation nodes suggests an active network infrastructure. However, detailed technical upgrade plans are not specified in the materials.
- Ecosystem Comparison: Comparative analysis of DeFi, NFT, payment systems, and smart contract implementations between OL and XTZ cannot be conducted based on the available reference materials.
Macroeconomic Conditions and Market Cycles
- Performance Under Inflation: The materials discuss crypto assets broadly in the context of macroeconomic conditions. The SBI Group report notes that crypto assets are transitioning from speculative commodities to recognized investment vehicles following institutional adoption milestones. However, specific comparative inflation-hedge characteristics of OL versus XTZ are not addressed.
- Macroeconomic Monetary Policy: The reference materials indicate that interest rates, dollar index movements, and monetary policy affect crypto markets generally. Chainlink (LINK) price analysis in the materials demonstrates how regulatory news and policy uncertainty can influence crypto asset valuations, suggesting similar dynamics may affect OL and XTZ.
- Geopolitical Factors: The materials reference cross-border transaction applications and international developments in blockchain technology. SBI Group's discussion of stablecoin development for cross-border payments and settlements suggests geopolitical considerations influence crypto adoption, though specific impacts on OL versus XTZ are not detailed.
III. 2026-2031 Price Forecast: OL vs XTZ
Short-term Forecast (2026)
- OL: Conservative $0.0145 - $0.0156 | Optimistic $0.0156 - $0.0223
- XTZ: Conservative $0.451 - $0.507 | Optimistic $0.507 - $0.532
Mid-term Forecast (2028-2029)
- OL may enter a consolidation phase with projected range of $0.0167 - $0.0256 in 2028, potentially extending to $0.0195 - $0.0234 by 2029
- XTZ may enter an expansion phase with projected range of $0.592 - $0.873 in 2028, potentially reaching $0.623 - $1.090 by 2029
- Key drivers: institutional capital inflows, ETF developments, ecosystem growth
Long-term Forecast (2030-2031)
- OL: Baseline scenario $0.0141 - $0.0230 (2030) | Optimistic scenario $0.0220 - $0.0293 (2031)
- XTZ: Baseline scenario $0.870 - $0.916 (2030) | Optimistic scenario $0.656 - $1.592 (2031)
View detailed price predictions for OL and XTZ
Disclaimer
Price predictions are based on historical data analysis and market trends. Cryptocurrency markets are highly volatile and subject to various risk factors. These forecasts should not be considered as investment advice. Always conduct your own research and consult with qualified financial advisors before making investment decisions.
OL:
| Year |
Predicted High Price |
Predicted Average Price |
Predicted Low Price |
Price Change |
| 2026 |
0.0223223 |
0.01561 |
0.0145173 |
0 |
| 2027 |
0.0206731035 |
0.01896615 |
0.0111900285 |
20 |
| 2028 |
0.0255673185075 |
0.01981962675 |
0.01664848647 |
25 |
| 2029 |
0.023374276807612 |
0.02269347262875 |
0.019516386460725 |
44 |
| 2030 |
0.025337262189999 |
0.023033874718181 |
0.01405066357809 |
46 |
| 2031 |
0.029264537829449 |
0.02418556845409 |
0.022008867293222 |
53 |
XTZ:
| Year |
Predicted High Price |
Predicted Average Price |
Predicted Low Price |
Price Change |
| 2026 |
0.532035 |
0.5067 |
0.450963 |
0 |
| 2027 |
0.701146125 |
0.5193675 |
0.472624425 |
2 |
| 2028 |
0.872667241875 |
0.6102568125 |
0.591949108125 |
20 |
| 2029 |
1.089949179965625 |
0.7414620271875 |
0.6228281028375 |
46 |
| 2030 |
1.236202564828359 |
0.915705603576562 |
0.869920323397734 |
80 |
| 2031 |
1.592412044619642 |
1.07595408420246 |
0.656331991363501 |
112 |
IV. Investment Strategy Comparison: OL vs XTZ
Long-term vs Short-term Investment Strategies
-
OL: May appeal to investors focused on emerging Web3 gaming distribution platforms and speculative opportunities in early-stage projects. The asset has experienced significant volatility, with price movements suggesting higher risk tolerance requirements. Short-term traders might consider technical analysis approaches given the pronounced price fluctuations observed in recent periods.
-
XTZ: May appeal to investors seeking exposure to established blockchain infrastructure with institutional validation mechanisms. The staking model provides potential for passive income generation through network participation. Long-term holders might consider the self-amending protocol features and formal verification techniques as factors supporting sustained ecosystem development.
Risk Management and Asset Allocation
-
Conservative Investors: OL 10-15% vs XTZ 85-90% - Conservative portfolios might emphasize established blockchain platforms with demonstrated institutional engagement and staking mechanisms that provide income-generating opportunities.
-
Aggressive Investors: OL 30-40% vs XTZ 60-70% - Growth-oriented portfolios might allocate higher proportions to emerging platforms while maintaining core positions in established networks with validator infrastructure.
-
Hedging Tools: Stablecoin allocation for liquidity management, diversified cross-asset positioning across different blockchain categories, and periodic rebalancing based on market conditions and volatility metrics.
V. Potential Risk Comparison
Market Risk
-
OL: The asset has demonstrated substantial price volatility, with approximately 83.91% decline observed over the past year period. Trading volume data indicates relatively lower liquidity levels at $32,938.2487391 in 24-hour volume, which may contribute to price impact concerns during position adjustments. The current market sentiment index at 16 (Extreme Fear) suggests challenging market conditions.
-
XTZ: The asset has experienced approximately 52.059% decline over the past year period, showing notable price adjustment but relatively less severe than some emerging platforms. The 24-hour trading volume of $526,507.4948112 indicates comparatively higher liquidity. Market correlation with broader crypto cycles may influence price movements during periods of sector-wide volatility.
Technology Risk
-
OL: Specific technical infrastructure details are limited in available materials. As a Web3 gaming distribution platform launched in November 2021, considerations may include platform adoption rates, developer engagement levels, and competition within the gaming distribution sector.
-
XTZ: The network utilizes validator node infrastructure and staking mechanisms. Considerations include network participation rates, validator node distribution, and the self-amending protocol's ability to implement upgrades without hard forks. The formal verification approach aims to enhance smart contract security, though implementation complexity may present considerations.
Regulatory Risk
- Global regulatory frameworks continue evolving across jurisdictions, with varying approaches to digital asset classification and oversight. Gaming platforms and established blockchain networks may face different regulatory considerations based on use cases and operational structures. Cross-border transaction capabilities and institutional engagement levels may influence regulatory scrutiny. Policy developments regarding staking mechanisms, token classifications, and platform operations could affect both assets differently based on their specific characteristics and jurisdictional presence.
VI. Conclusion: Which Is the Better Buy?
📌 Investment Value Summary:
-
OL Advantages: Positioning within the Web3 gaming distribution sector, which represents an emerging application area for blockchain technology. The platform's focus on supporting game developers with go-to-market strategies and payment solutions addresses specific industry needs. Price forecasts suggest potential recovery scenarios from current levels, though accompanied by significant uncertainty.
-
XTZ Advantages: Established blockchain infrastructure with self-amending protocol capabilities and formal verification techniques. Institutional validation through partnerships such as TenX's validator node operations. Staking mechanism provides income-generation opportunities for network participants. Longer operational history since October 2017 with demonstrated network resilience through multiple market cycles.
✅ Investment Recommendations:
-
New Investors: Consider starting with assets demonstrating established infrastructure, institutional engagement, and clearer operational frameworks. Focus on understanding staking mechanisms, network participation requirements, and liquidity considerations before position sizing. Prioritize education regarding wallet security, transaction processes, and market dynamics.
-
Experienced Investors: Evaluate portfolio allocation based on risk tolerance, investment horizon, and conviction regarding specific sector trends. Consider diversification across different blockchain categories while maintaining core positions in established networks. Monitor technical developments, institutional adoption trends, and regulatory environment changes that may affect asset positioning.
-
Institutional Investors: Assess custody solutions, regulatory compliance frameworks, and liquidity requirements for position management. Evaluate staking infrastructure options, validator node operations, and income generation strategies. Consider portfolio construction approaches that balance exposure to established networks with strategic allocations to emerging sectors based on institutional mandates and risk parameters.
⚠️ Risk Warning: Cryptocurrency markets exhibit extreme volatility. This content does not constitute investment advice. Conduct thorough research and consult qualified financial advisors before making investment decisions.
VII. FAQ
Q1: What are the main differences between Open Loot (OL) and Tezos (XTZ) in terms of their core functionality?
Open Loot is a Web3 gaming distribution platform focused on supporting game developers with go-to-market strategies and payment solutions, while Tezos is an established blockchain infrastructure with self-amending protocol capabilities. OL targets the gaming industry specifically, offering marketplace and distribution services for game publishers. In contrast, XTZ functions as a general-purpose blockchain platform utilizing formal verification techniques to enhance smart contract security. Tezos employs a Proof-of-Stake consensus mechanism allowing token holders to participate in network validation through staking, whereas OL's technical infrastructure details remain limited in public documentation.
Q2: How do the price volatilities of OL and XTZ compare over recent periods?
OL has experienced significantly higher volatility with approximately 83.91% decline over the past year, while XTZ declined approximately 52.059% during the same period. OL reached its all-time high of $0.69 in December 2024 but subsequently fell to an all-time low of $0.00274 in October 2025, demonstrating extreme price swings. XTZ exhibited more moderate fluctuations, with its all-time high of $9.12 occurring in October 2021 and all-time low of $0.350476 in December 2018. The current 24-hour trading volume differential—$32,938 for OL versus $526,507 for XTZ—indicates that Tezos maintains substantially higher liquidity, which typically correlates with reduced price impact during trading.
Q3: What investment allocation strategies are recommended for different investor profiles?
Conservative investors might consider an allocation of 10-15% OL versus 85-90% XTZ, emphasizing established blockchain platforms with institutional validation and income-generating staking mechanisms. Aggressive investors could adopt a 30-40% OL versus 60-70% XTZ allocation, maintaining core positions in established networks while increasing exposure to emerging gaming distribution platforms. Portfolio construction should incorporate stablecoin reserves for liquidity management, diversification across different blockchain categories, and periodic rebalancing based on volatility metrics. Risk tolerance, investment horizon, and conviction regarding specific sector trends should guide individual allocation decisions, with new investors prioritizing assets demonstrating clearer operational frameworks.
Q4: What are the key technological risks associated with OL and XTZ?
For OL, technological risks include limited publicly available infrastructure details, platform adoption rate uncertainties, and intense competition within the Web3 gaming distribution sector. As a platform launched in November 2021, developer engagement levels and ecosystem growth rates remain critical factors. For XTZ, considerations include validator node distribution patterns, network participation rates, and the complexity of implementing the self-amending protocol without hard forks. While Tezos's formal verification approach aims to enhance smart contract security, implementation complexity may present operational challenges. Both assets face risks related to technological obsolescence, competing protocol developments, and the ability to attract and retain developer communities.
Q5: How might regulatory developments affect OL and XTZ differently?
Gaming platforms and established blockchain networks may face distinct regulatory considerations based on their operational structures and use cases. OL, as a gaming distribution platform, could encounter regulations specific to gaming industry oversight, digital marketplace operations, and payment processing requirements across different jurisdictions. XTZ may face scrutiny related to staking mechanisms, which some regulators might classify as securities offerings, along with considerations regarding cross-border transaction capabilities and institutional engagement activities. The evolving global regulatory landscape regarding token classifications, platform operations, and validator node requirements could impact both assets differently depending on their jurisdictional presence and specific operational characteristics.
Q6: What income-generation opportunities exist for holders of OL versus XTZ?
Tezos provides clear income-generation opportunities through its Proof-of-Stake mechanism, allowing token holders to stake XTZ through validator nodes and earn network rewards. The materials reference TenX's operation of Tezos validator nodes with planned delegation from the Tezos Foundation, demonstrating institutional participation in this staking infrastructure. Staking rewards can provide passive income streams while reducing circulating supply, potentially creating upward price pressure. For Open Loot, the available materials do not specify comparable staking mechanisms or income-generation features for token holders. This distinction makes XTZ potentially more attractive for investors seeking yield-generating assets within their cryptocurrency portfolios, particularly those prioritizing cash flow characteristics over pure price appreciation strategies.
Q7: What factors should investors monitor when tracking OL and XTZ performance?
For OL, investors should monitor Web3 gaming sector adoption trends, platform user growth metrics, developer engagement levels, partnership announcements with game publishers, and competitive positioning against alternative gaming distribution platforms. Trading volume trends and liquidity improvements warrant attention given current relatively low volumes. For XTZ, key monitoring factors include validator node participation rates, staking ratio percentages, protocol upgrade implementations, institutional partnership developments, and broader smart contract platform competition. Both assets require attention to macroeconomic conditions affecting crypto markets, including regulatory developments, institutional adoption trends, and correlation patterns with major cryptocurrencies like Bitcoin and Ethereum during different market cycles.
Q8: What are the projected price trajectories for OL and XTZ through 2031?
Short-term 2026 forecasts suggest OL may range from $0.0145-$0.0156 (conservative) to $0.0156-$0.0223 (optimistic), while XTZ may range from $0.451-$0.507 (conservative) to $0.507-$0.532 (optimistic). Mid-term projections for 2028-2029 indicate OL could reach $0.0167-$0.0256 in 2028 and $0.0195-$0.0234 in 2029, whereas XTZ may achieve $0.592-$0.873 in 2028 and $0.623-$1.090 in 2029. Long-term 2030-2031 scenarios project OL baseline of $0.0141-$0.0230 (2030) extending to $0.0220-$0.0293 (2031), while XTZ baseline suggests $0.870-$0.916 (2030) reaching $0.656-$1.592 (2031). These forecasts assume varying institutional capital inflows, ecosystem development trajectories, and market cycle dynamics, though actual outcomes may differ substantially given cryptocurrency market volatility and unpredictable external factors.
* The information is not intended to be and does not constitute financial advice or any other recommendation of any sort offered or endorsed by Gate.