The article "OLE vs SAND: The Battle for Digital Asset Supremacy in the Blockchain Era" provides an in-depth comparison of OpenLeverage (OLE) and The Sandbox (SAND) as investment options. It examines historical price trends, market performance, and technological ecosystems to guide investors on which asset might be a better buy now. Key focus areas include supply mechanisms, institutional adoption, and regulatory risks. The article caters to both novice and experienced investors seeking insights into DeFi and metaverse sectors, offering investment strategies based on risk tolerance. For real-time updates, visit OLE and SAND prices on Gate.
Introduction: OLE vs SAND Investment Comparison
In the cryptocurrency market, OpenLeverage (OLE) vs The Sandbox (SAND) comparison has been an unavoidable topic for investors. The two not only show significant differences in market cap ranking, application scenarios, and price performance, but also represent different cryptocurrency asset positioning.
OpenLeverage (OLE): Since its launch, it has gained market recognition for its permissionless lending and margin trading protocol.
The Sandbox (SAND): Since its inception, it has been hailed as a virtual game world, and is one of the cryptocurrencies with high global trading volume and market capitalization.
This article will comprehensively analyze the investment value comparison between OLE and SAND, focusing on historical price trends, supply mechanisms, institutional adoption, technological ecosystems, and future predictions, and attempt to answer the question that investors care about most:
"Which is the better buy right now?"
Here is the analysis based on the provided information:
I. Price History Comparison and Current Market Status
OpenLeverage (OLE) and The Sandbox (SAND) Historical Price Trends
- 2021: SAND experienced significant growth due to the metaverse hype, reaching an all-time high of $8.40.
- 2022: OLE launched its token, with price fluctuations typical of new crypto projects.
- Comparative analysis: During the 2022 crypto market downturn, SAND declined from its peak to under $1, while OLE, being a newer token, showed high volatility.
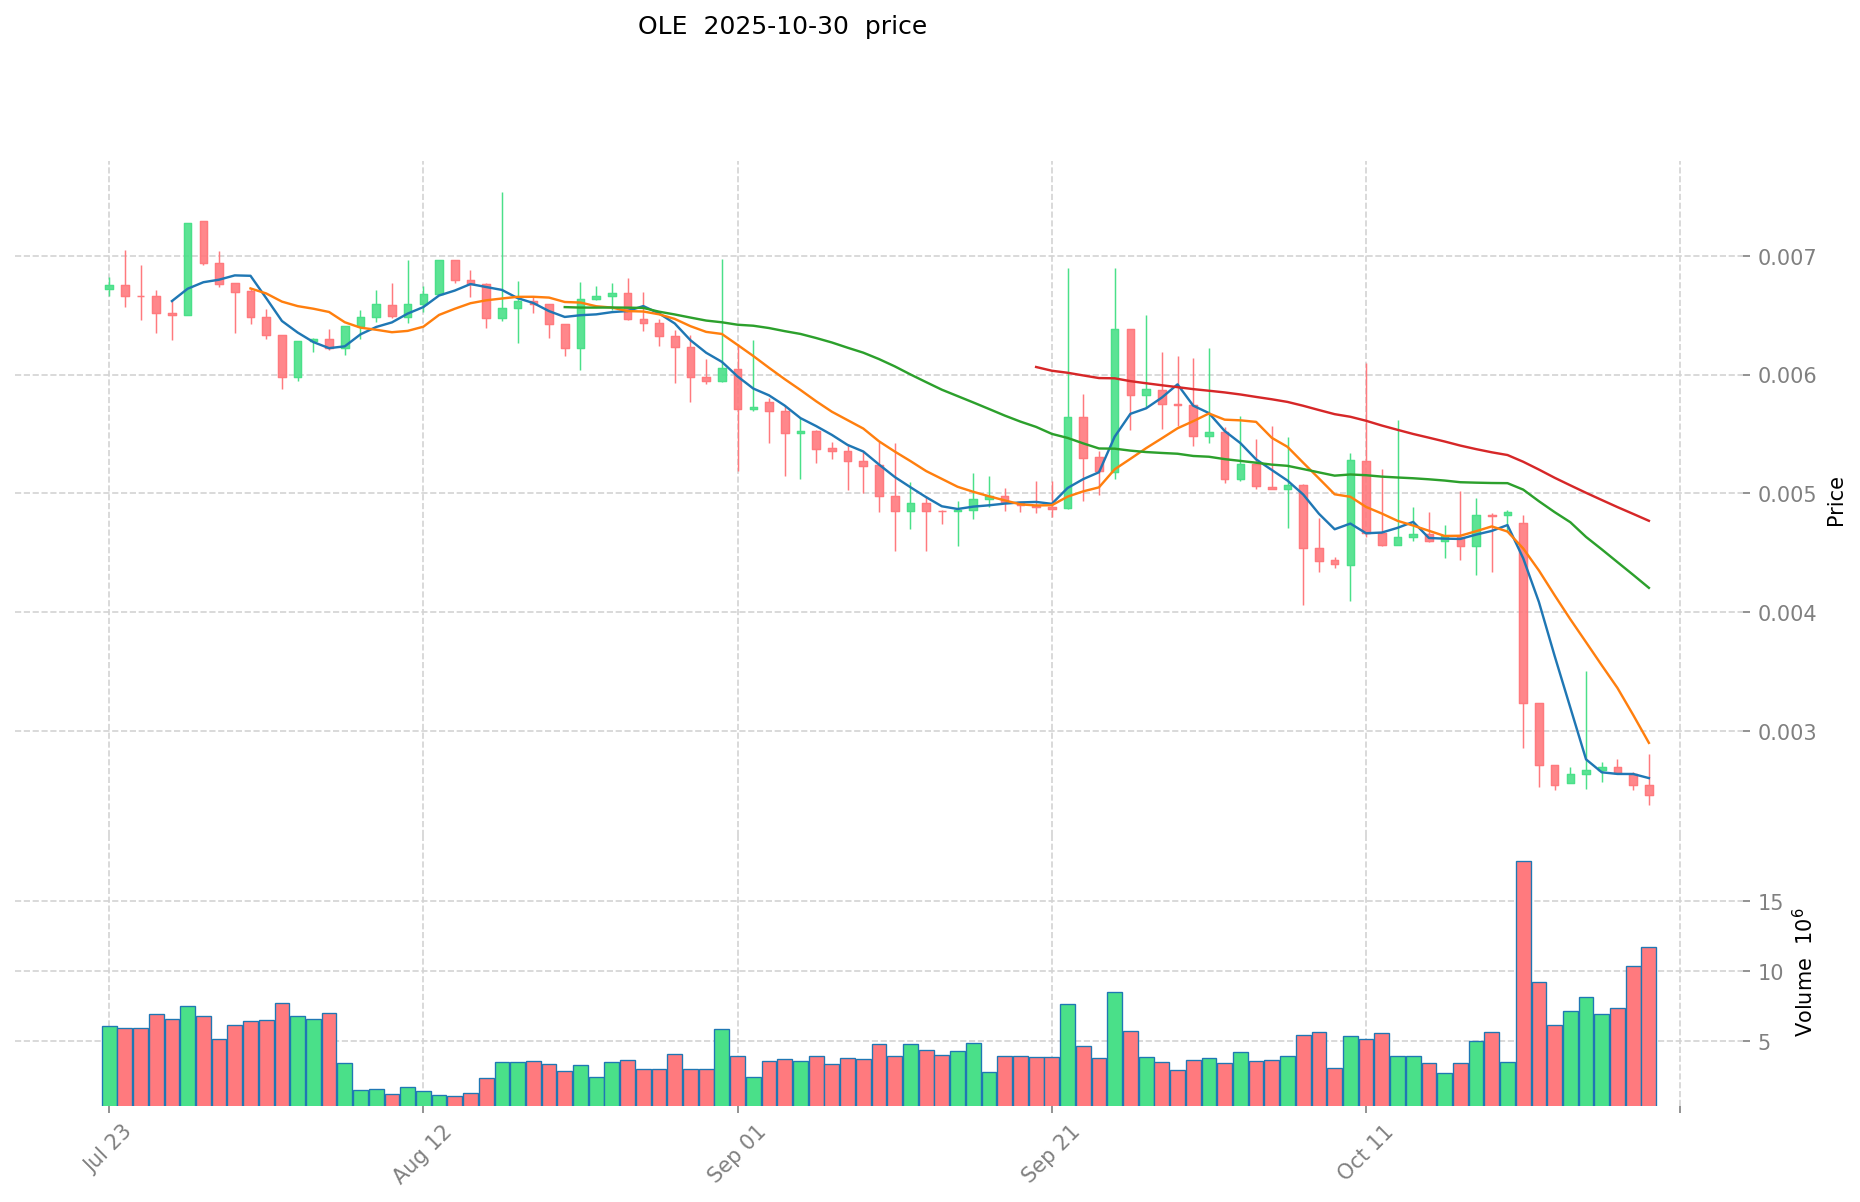
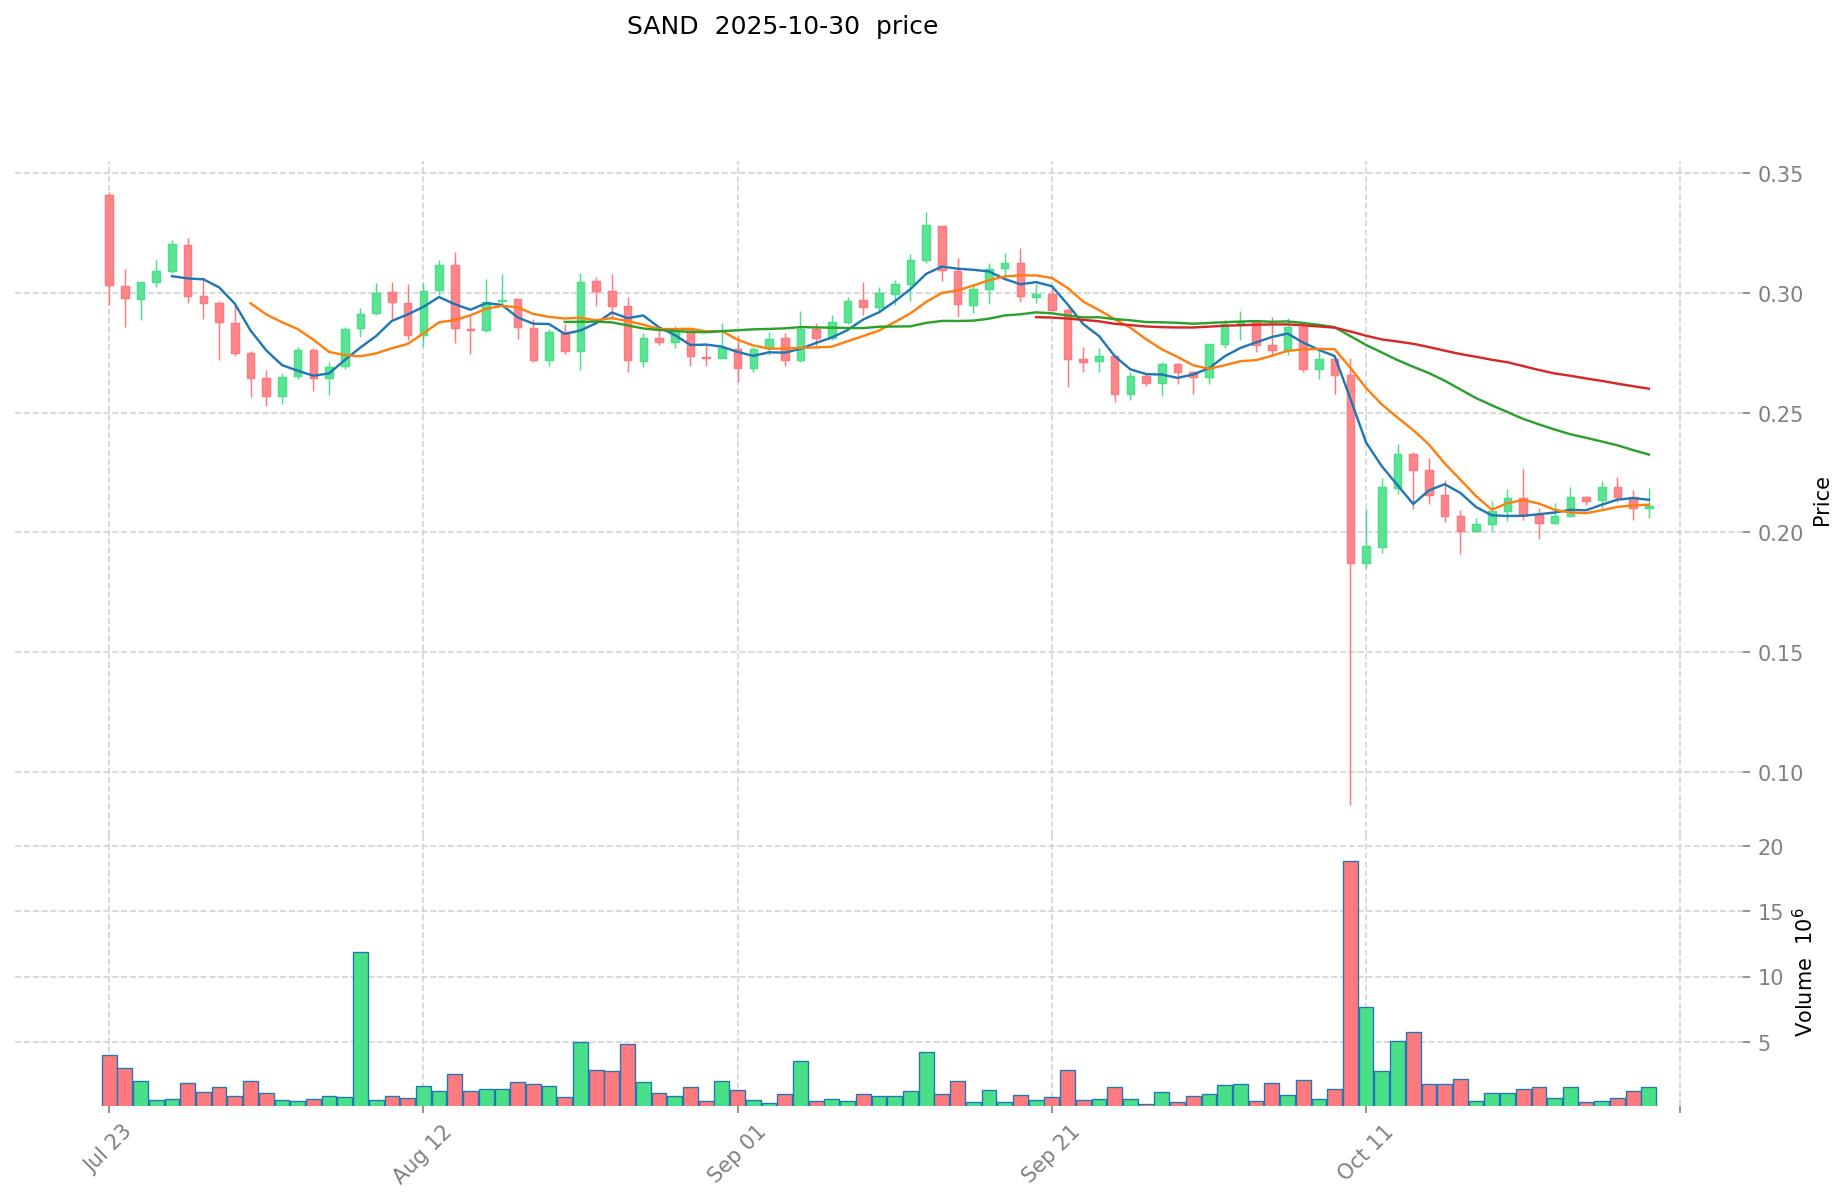
Current Market Situation (2025-10-30)
- OLE current price: $0.00245
- SAND current price: $0.1976
- 24-hour trading volume: OLE $20,923.62 vs SAND $354,312.66
- Market Sentiment Index (Fear & Greed Index): 34 (Fear)
Click to view real-time prices:
- View OLE current price Market Price
- View SAND current price Market Price
The Core Factors Affecting OLE vs SAND Investment Value
Supply Mechanism Comparison (Tokenomics)
- OLE: Core product is the OYL wallet and Protorunes meta-protocol that adds programmability to Runes
- SAND: Digital currency model focused on virtual world economies
- 📌 Historical pattern: Digital asset supply mechanisms drive price cycles through scarcity principles and adoption rates.
Institutional Adoption and Market Applications
- Institutional holdings: Limited data on institutional preference between these assets
- Enterprise adoption: Both aim to provide integrated services combining payment solutions and loyalty programs
- Regulatory attitudes: Digital currencies face varying regulatory approaches across countries, with some advancing to pilot stages (China, Sweden) and others already launching (Bahamas)
Technology Development and Ecosystem Building
- OLE technology: OYL wallet provides core functionality for Bitcoin inscriptions
- SAND technology: Focused on digital asset applications in virtual environments
- Ecosystem comparison: Both operate in the broader digital asset ecosystem transformed by financial technology
Macroeconomic Factors and Market Cycles
- Performance during inflation: Digital currencies generally positioned as alternative assets
- Macroeconomic monetary policy: Central bank digital currencies (CBDCs) are becoming increasingly important with 80% of central banks researching them
- Geopolitical factors: COVID-19 accelerated electronic payment adoption globally, reducing cash usage
III. 2025-2030 Price Prediction: OLE vs SAND
Short-term Prediction (2025)
- OLE: Conservative $0.00181892 - $0.002458 | Optimistic $0.002458 - $0.0027038
- SAND: Conservative $0.132727 - $0.1981 | Optimistic $0.1981 - $0.204043
Mid-term Prediction (2027)
- OLE may enter a growth phase, with expected prices ranging from $0.00216666555 to $0.00341324025
- SAND may enter a steady growth phase, with expected prices ranging from $0.2383903704 to $0.32282029325
- Key drivers: Institutional capital inflow, ETF developments, ecosystem growth
Long-term Prediction (2030)
- OLE: Base scenario $0.003465191992631 - $0.004470097670494 | Optimistic scenario $0.004470097670494+
- SAND: Base scenario $0.414543161090296 - $0.543051541028288 | Optimistic scenario $0.543051541028288+
View detailed price predictions for OLE and SAND
Disclaimer: The above predictions are based on historical data and market analysis. Cryptocurrency markets are highly volatile and subject to change. This information should not be considered as financial advice. Always conduct your own research before making investment decisions.
OLE:
| 年份 |
预测最高价 |
预测平均价格 |
预测最低价 |
涨跌幅 |
| 2025 |
0.0027038 |
0.002458 |
0.00181892 |
0 |
| 2026 |
0.00335517 |
0.0025809 |
0.001393686 |
5 |
| 2027 |
0.00341324025 |
0.002968035 |
0.00216666555 |
21 |
| 2028 |
0.0036373268925 |
0.003190637625 |
0.00178675707 |
30 |
| 2029 |
0.003516401726512 |
0.00341398225875 |
0.002492207048887 |
39 |
| 2030 |
0.004470097670494 |
0.003465191992631 |
0.003014717033589 |
41 |
SAND:
| 年份 |
预测最高价 |
预测平均价格 |
预测最低价 |
涨跌幅 |
| 2025 |
0.204043 |
0.1981 |
0.132727 |
0 |
| 2026 |
0.295575105 |
0.2010715 |
0.13270719 |
1 |
| 2027 |
0.32282029325 |
0.2483233025 |
0.2383903704 |
25 |
| 2028 |
0.41407910691875 |
0.285571797875 |
0.2113231304275 |
44 |
| 2029 |
0.479260869783718 |
0.349825452396875 |
0.339330688824968 |
77 |
| 2030 |
0.543051541028288 |
0.414543161090296 |
0.33577996048314 |
109 |
IV. Investment Strategy Comparison: OLE vs SAND
Long-term vs Short-term Investment Strategy
- OLE: Suitable for investors focusing on DeFi and lending protocols
- SAND: Suitable for investors interested in metaverse and gaming ecosystems
Risk Management and Asset Allocation
- Conservative investors: OLE 20% vs SAND 80%
- Aggressive investors: OLE 40% vs SAND 60%
- Hedging tools: Stablecoin allocation, options, cross-currency combinations
V. Potential Risk Comparison
Market Risk
- OLE: Higher volatility due to smaller market cap and newer project status
- SAND: Susceptible to metaverse and gaming industry trends
Technical Risk
- OLE: Scalability, network stability
- SAND: Platform adoption, smart contract vulnerabilities
Regulatory Risk
- Global regulatory policies may have differing impacts on DeFi protocols and metaverse projects
VI. Conclusion: Which Is the Better Buy?
📌 Investment Value Summary:
- OLE advantages: Potential growth in DeFi sector, innovative lending protocol
- SAND advantages: Established metaverse presence, larger market cap and liquidity
✅ Investment Advice:
- New investors: Consider a smaller allocation to OLE and larger to SAND for balanced exposure
- Experienced investors: Evaluate based on risk tolerance and sector preference
- Institutional investors: Analyze based on portfolio goals and market trends
⚠️ Risk Warning: Cryptocurrency markets are highly volatile. This article does not constitute investment advice.
None
VII. FAQ
Q1: What are the main differences between OLE and SAND?
A: OLE is focused on DeFi and lending protocols, while SAND is centered on metaverse and gaming ecosystems. OLE has a smaller market cap and is newer, while SAND is more established with higher liquidity.
Q2: Which cryptocurrency has performed better historically?
A: SAND has a longer history and experienced significant growth during the metaverse hype in 2021, reaching an all-time high of $8.40. OLE, being newer, has shown high volatility typical of new crypto projects.
Q3: What are the current prices and trading volumes for OLE and SAND?
A: As of 2025-10-30, OLE's price is $0.00245 with a 24-hour trading volume of $20,923.62. SAND's price is $0.1976 with a 24-hour trading volume of $354,312.66.
Q4: How do the future price predictions compare for OLE and SAND?
A: By 2030, OLE's base scenario price range is predicted to be $0.003465191992631 - $0.004470097670494, while SAND's is $0.414543161090296 - $0.543051541028288. Both show potential for growth, with SAND having higher predicted values.
Q5: What are the main risks associated with investing in OLE and SAND?
A: OLE faces higher volatility due to its smaller market cap and newer status, while SAND is more susceptible to metaverse and gaming industry trends. Both face technical risks such as scalability and smart contract vulnerabilities, as well as regulatory risks.
Q6: How should investors allocate their portfolio between OLE and SAND?
A: Conservative investors might consider allocating 20% to OLE and 80% to SAND, while more aggressive investors could opt for 40% OLE and 60% SAND. The exact allocation should be based on individual risk tolerance and investment goals.
* The information is not intended to be and does not constitute financial advice or any other recommendation of any sort offered or endorsed by Gate.


