This comprehensive analysis compares ORBR and SAND, two emerging digital assets in the metaverse economy, to guide investment decisions. ORBR, launched in 2022, operates as a blockchain tower defense game with P2E mechanics and NFT upgrades, while SAND, established since 2020, functions as a decentralized metaverse platform on Ethereum. The article examines historical price trends, tokenomics, institutional adoption, technological ecosystems, and provides price forecasts through 2031 on Gate. Both assets demonstrate significant volatility; ORBR offers higher growth potential from lower price levels, while SAND provides greater liquidity and market stability. The guide offers tailored investment strategies and risk assessments for conservative, aggressive, and institutional investors seeking metaverse exposure.
Introduction: ORBR vs SAND Investment Comparison
In the cryptocurrency market, the comparison between ORBR and SAND has become a topic that investors cannot avoid. The two not only show significant differences in market cap ranking, application scenarios, and price performance, but also represent distinct positioning within crypto assets.
Orbler (ORBR): Launched in 2022, it has gained market recognition by positioning itself as a blockchain-based real-time defense game with P2E (Play-to-Earn) mechanics, featuring upgradable NFT dragons and orbs with unique elements and skills.
The Sandbox (SAND): Since its launch in August 2020, it has been recognized as a decentralized virtual gaming metaverse, allowing players to create, own, and monetize gaming experiences through Ethereum-based functional tokens, becoming one of the widely adopted GameFi projects.
This article will comprehensively analyze the investment value comparison between ORBR and SAND around historical price trends, supply mechanisms, adoption landscape, technological ecosystems, and future outlook, attempting to answer the question that investors are most concerned about:
"Which is the better buy right now?"
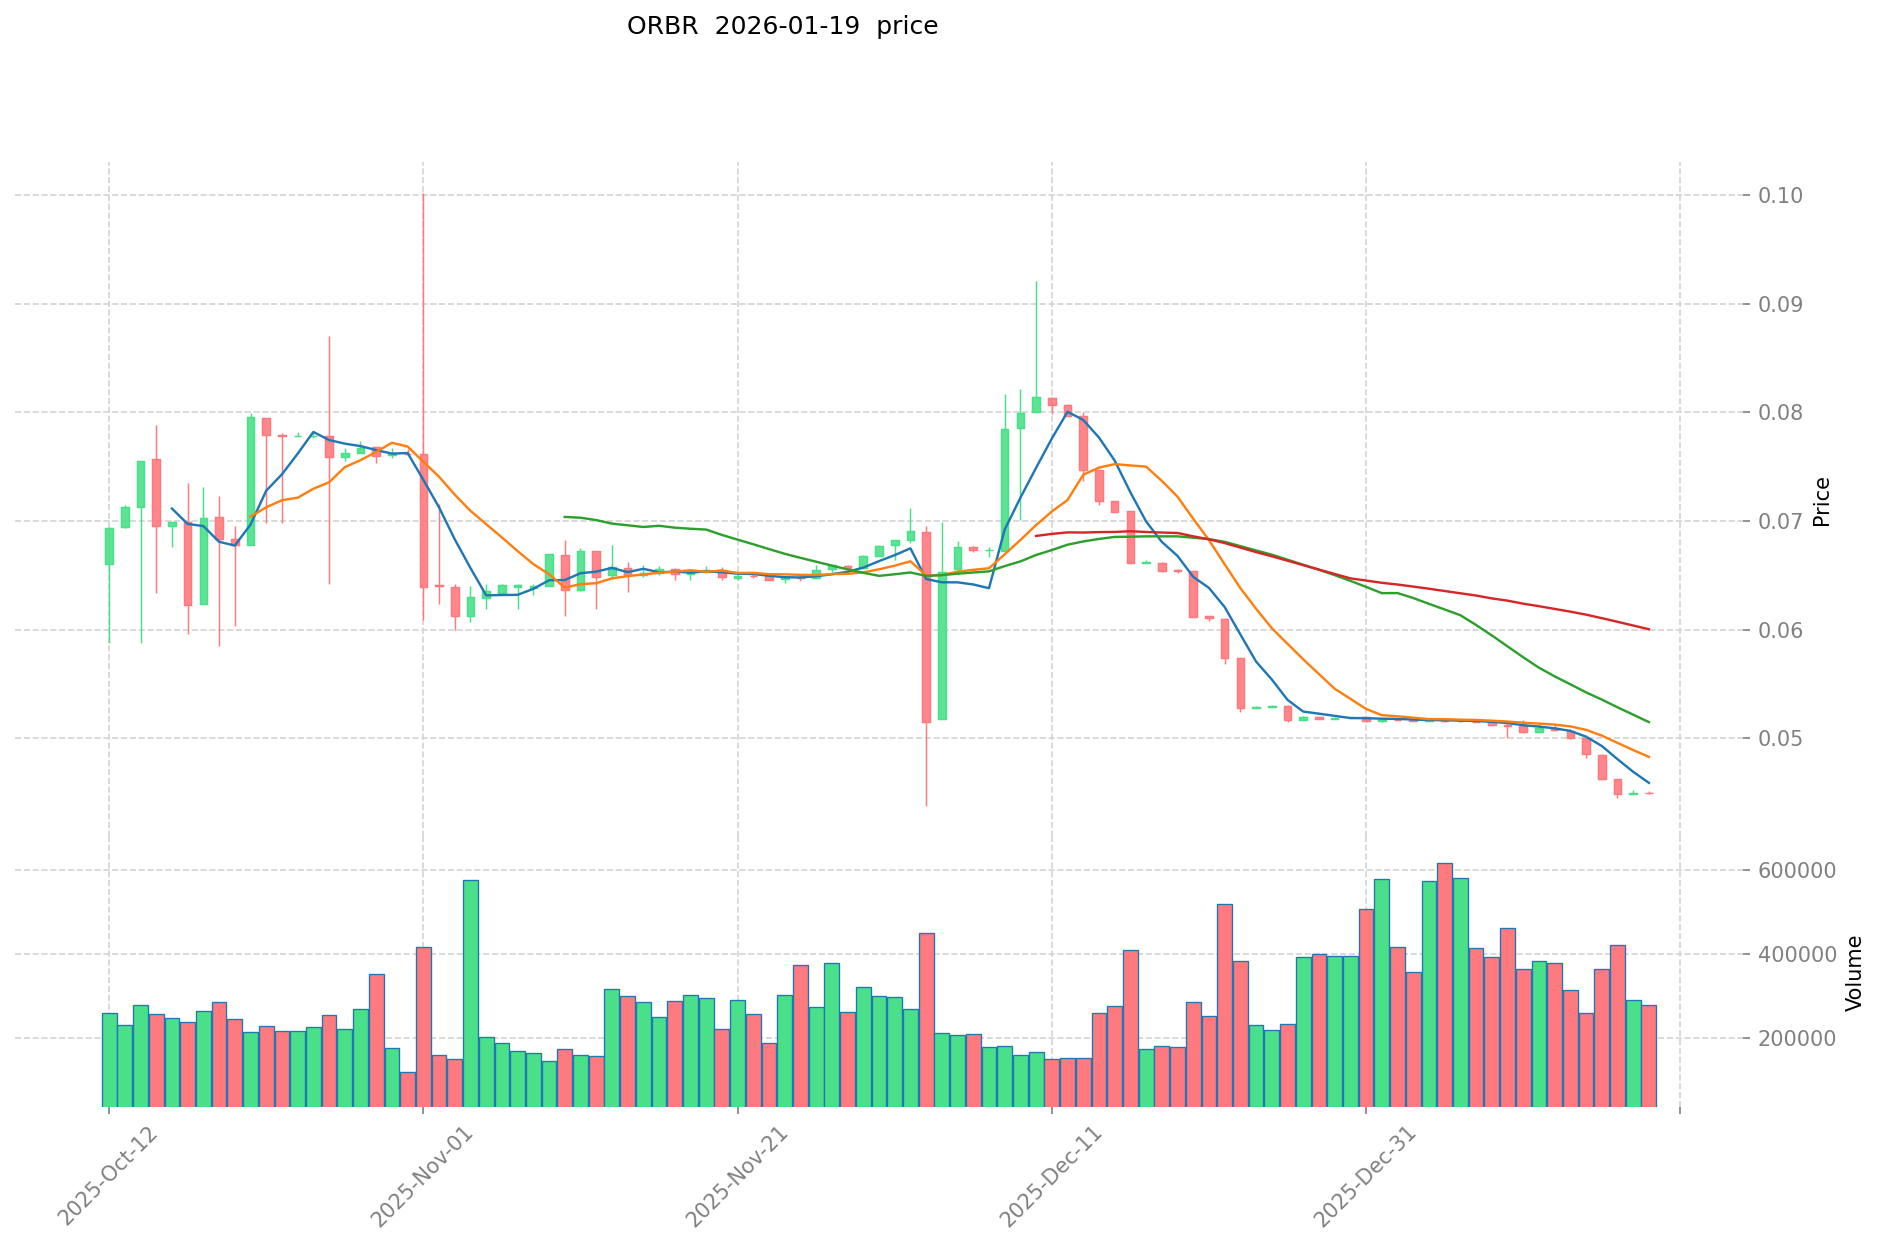
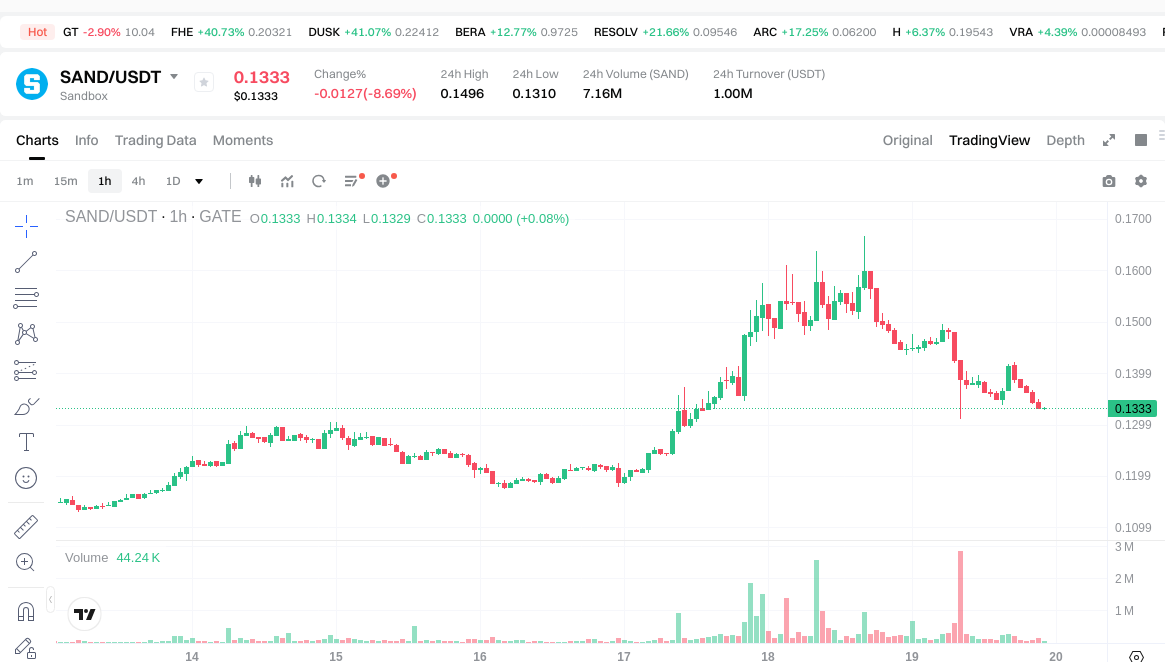
I. Historical Price Comparison and Current Market Status
ORBR (Coin A) and SAND (Coin B) Historical Price Trends
- 2022: ORBR experienced a significant price movement, reaching an all-time high of $44.91 in April 2022, driven by initial market enthusiasm surrounding the blockchain-based tower defense game launch.
- 2021: SAND witnessed substantial growth, peaking at $8.40 in November 2021, influenced by the rising interest in metaverse concepts and NFT gaming platforms.
- Comparative Analysis: During the crypto market downturn cycle, ORBR declined from its peak of $44.91 to a low of $0.04375621 recorded in December 2025, representing a decline of over 99%. Meanwhile, SAND decreased from its high of $8.40 to $0.02897764 in November 2020, showing a similar pattern of significant correction from peak levels.
Current Market Status (2026-01-19)
- ORBR Current Price: $0.04479
- SAND Current Price: $0.1334
- 24-Hour Trading Volume: ORBR recorded $12,848.69 compared to SAND's $1,008,957.60
- Market Sentiment Index (Fear & Greed Index): 44 (Fear)
View Real-time Prices:
- Check ORBR current price Market Price
- Check SAND current price Market Price
II. Core Factors Influencing ORBR vs SAND Investment Value
Supply Mechanism Comparison (Tokenomics)
Detailed supply mechanism information for ORBR and SAND is currently limited in available materials. Understanding tokenomics structures, including total supply, circulation mechanisms, and inflation/deflation models, remains essential for evaluating long-term value propositions.
Institutional Adoption and Market Application
- Institutional holdings: Current data regarding institutional preference between ORBR and SAND requires further market analysis.
- Enterprise adoption: Specific applications in cross-border payments, settlement systems, and investment portfolios for both assets need additional verification.
- National policies: Regulatory attitudes toward both assets vary across jurisdictions and continue to evolve.
Technology Development and Ecosystem Building
The competitive landscape of high-speed blockchain platforms presents opportunities for projects with strong technical foundations. Market participants should monitor ongoing technological developments and ecosystem expansion efforts that may influence the relative positioning of both assets.
- Ecosystem comparison: The development status of DeFi, NFT, payment solutions, and smart contract implementations represents key differentiation factors.
Macroeconomic Environment and Market Cycles
- Inflation environment performance: The anti-inflation characteristics of digital assets vary based on market perception and adoption patterns.
- Macroeconomic monetary policy: Interest rate movements and U.S. dollar index fluctuations may affect risk appetite for alternative assets.
- Geopolitical factors: Cross-border transaction demand and international developments can influence market dynamics for both assets.
III. 2026-2031 Price Prediction: ORBR vs SAND
Short-term Forecast (2026)
- ORBR: Conservative $0.0372-$0.0448 | Optimistic $0.0448-$0.0667
- SAND: Conservative $0.0679-$0.1331 | Optimistic $0.1331-$0.1384
Medium-term Forecast (2028-2029)
- ORBR may enter a gradual growth phase, with estimated price range of $0.0489-$0.0971
- SAND may enter a moderate expansion phase, with estimated price range of $0.0789-$0.1873
- Key drivers: institutional capital flows, ETF developments, ecosystem expansion
Long-term Forecast (2030-2031)
- ORBR: Baseline scenario $0.0585-$0.0848 | Optimistic scenario $0.0682-$0.1102
- SAND: Baseline scenario $0.1388-$0.1780 | Optimistic scenario $0.1569-$0.2080
View detailed price predictions for ORBR and SAND
Disclaimer
ORBR:
| Year |
Predicted High Price |
Predicted Average Price |
Predicted Low Price |
Price Change |
| 2026 |
0.0667073 |
0.04477 |
0.0371591 |
0 |
| 2027 |
0.063542061 |
0.05573865 |
0.053509104 |
24 |
| 2028 |
0.085285708365 |
0.0596403555 |
0.04890509151 |
33 |
| 2029 |
0.09710046278955 |
0.0724630319325 |
0.0492748617141 |
61 |
| 2030 |
0.110216271569332 |
0.084781747361025 |
0.058499405679107 |
89 |
| 2031 |
0.103348950033089 |
0.097499009465178 |
0.068249306625625 |
117 |
SAND:
| Year |
Predicted High Price |
Predicted Average Price |
Predicted Low Price |
Price Change |
| 2026 |
0.138424 |
0.1331 |
0.067881 |
0 |
| 2027 |
0.17377536 |
0.135762 |
0.0814572 |
1 |
| 2028 |
0.1826270424 |
0.15476868 |
0.0789320268 |
16 |
| 2029 |
0.187254625932 |
0.1686978612 |
0.10965360978 |
26 |
| 2030 |
0.1868750557443 |
0.177976243566 |
0.13882146998148 |
33 |
| 2031 |
0.207965240606871 |
0.18242564965515 |
0.156886058703429 |
36 |
IV. Investment Strategy Comparison: ORBR vs SAND
Long-term vs Short-term Investment Strategies
- ORBR: May appeal to investors focused on emerging GameFi ecosystems with P2E mechanics, particularly those with higher risk tolerance seeking exposure to early-stage blockchain gaming projects with significant price volatility.
- SAND: May suit investors interested in established metaverse platforms with demonstrated market presence, focusing on virtual world development and NFT-based gaming experiences within a more recognized ecosystem.
Risk Management and Asset Allocation
- Conservative Investors: ORBR 10-15% vs SAND 20-30%
- Aggressive Investors: ORBR 25-35% vs SAND 30-40%
- Hedging Tools: stablecoin allocations, options strategies, cross-asset portfolio diversification
V. Potential Risk Comparison
Market Risks
- ORBR: Exhibits extreme price volatility with over 99% decline from peak levels, limited trading volume of $12,848.69 indicating lower liquidity, and susceptibility to market sentiment shifts in the Fear & Greed Index environment.
- SAND: Demonstrates significant price corrections from historical highs, with current trading volume of $1,008,957.60 reflecting higher market activity, though remains exposed to broader metaverse sector sentiment and adoption patterns.
Technical Risks
- ORBR: Scalability challenges in supporting real-time gameplay, network stability concerns for maintaining consistent user experiences
- SAND: Infrastructure dependencies for metaverse operations, potential security vulnerabilities in smart contract implementations
Regulatory Risks
Global regulatory frameworks continue to evolve differently for gaming tokens versus metaverse platforms, with varying interpretations across jurisdictions potentially affecting operational models, token classifications, and cross-border accessibility for both assets.
VI. Conclusion: Which Is the Better Buy?
📌 Investment Value Summary:
- ORBR Advantages: Early-stage exposure to blockchain tower defense gaming with P2E mechanics, potential upside from low current price levels, unique NFT integration with upgradable dragons and orbs
- SAND Advantages: Established metaverse platform with demonstrated market recognition since 2020, higher trading volume indicating better liquidity, broader ecosystem for creating and monetizing gaming experiences
✅ Investment Recommendations:
- Beginner Investors: Consider starting with SAND for exposure to more established metaverse infrastructure with higher liquidity, while limiting allocation to manage volatility risk
- Experienced Investors: May explore diversified positions incorporating both assets based on risk tolerance, with emphasis on portfolio rebalancing and monitoring ecosystem developments
- Institutional Investors: Evaluate both assets within broader digital asset allocation frameworks, considering liquidity requirements, regulatory compliance, and correlation with traditional portfolio components
⚠️ Risk Disclosure: Cryptocurrency markets exhibit extreme volatility. This content does not constitute investment advice.
VII. FAQ
Q1: What is the current price difference between ORBR and SAND?
As of January 19, 2026, SAND is priced at $0.1334 while ORBR is priced at $0.04479, making SAND approximately 3 times more expensive than ORBR. This price differential reflects their different market positions, with SAND maintaining higher valuation due to its established metaverse platform status since 2020, while ORBR represents a newer blockchain gaming project launched in 2022. The significant price gap also correlates with their trading volumes, where SAND demonstrates substantially higher liquidity at $1,008,957.60 compared to ORBR's $12,848.69 in 24-hour trading volume.
Q2: Which asset has shown better resilience during market downturns?
Both ORBR and SAND have experienced severe declines from their all-time highs, with ORBR declining over 99% from its April 2022 peak of $44.91 to December 2025 low of $0.04375621, while SAND corrected from November 2021 peak of $8.40 to November 2020 low of $0.02897764. However, SAND has demonstrated relatively better market resilience through maintaining higher trading volumes and more stable price levels during the current Fear market sentiment (Fear & Greed Index: 44). The established metaverse ecosystem and broader market recognition of SAND have contributed to its comparatively stronger position during crypto market downturns.
Q3: What are the key technological differences between ORBR and SAND?
ORBR positions itself as a blockchain-based real-time tower defense game featuring P2E mechanics with upgradable NFT dragons and orbs that possess unique elements and skills, focusing on gaming-specific blockchain applications. SAND operates as a decentralized virtual gaming metaverse platform built on Ethereum, enabling players to create, own, and monetize diverse gaming experiences through functional tokens. The fundamental distinction lies in ORBR's specialized gaming mechanics versus SAND's broader metaverse infrastructure that supports multiple user-generated content types and experiences within a virtual world ecosystem.
Q4: How do the 2030 price predictions compare between ORBR and SAND?
According to baseline scenario forecasts for 2030, ORBR is projected to trade within a range of $0.0585-$0.0848, representing an 89% increase from current levels, while SAND is expected to reach $0.1388-$0.1780, indicating a 33% price appreciation. In optimistic scenarios, ORBR could potentially reach $0.0682-$0.1102, whereas SAND might achieve $0.1569-$0.2080. These projections suggest that ORBR presents higher percentage growth potential from current price levels due to its earlier development stage, while SAND offers more moderate but potentially more stable growth expectations based on its established market position.
Q5: What portfolio allocation strategy should different investor types consider?
Conservative investors should consider allocating 10-15% to ORBR and 20-30% to SAND within their cryptocurrency portfolio, reflecting the higher risk profile of ORBR and relatively more established position of SAND. Aggressive investors may increase exposure to 25-35% for ORBR and 30-40% for SAND, accepting higher volatility for potential upside. Beginner investors are recommended to start with SAND for exposure to established metaverse infrastructure with better liquidity, while experienced investors may explore diversified positions incorporating both assets based on individual risk tolerance, with emphasis on regular portfolio rebalancing and monitoring ecosystem developments.
Q6: What are the primary risks specific to each asset?
ORBR faces extreme price volatility risks with over 99% decline from peak levels, limited trading liquidity at $12,848.69 daily volume, scalability challenges in supporting real-time gameplay, and network stability concerns for maintaining consistent user experiences. SAND encounters significant price correction risks from historical highs, infrastructure dependencies for metaverse operations, potential smart contract security vulnerabilities, and exposure to broader metaverse sector sentiment shifts. Both assets remain subject to evolving global regulatory frameworks that differ between gaming tokens and metaverse platforms, with varying interpretations across jurisdictions potentially affecting operational models and cross-border accessibility.
Q7: Which asset offers better liquidity for institutional investors?
SAND demonstrates substantially superior liquidity for institutional investors with 24-hour trading volume of $1,008,957.60 compared to ORBR's $12,848.69, representing approximately 78 times higher daily trading activity. This significant liquidity differential enables institutional investors to execute larger position sizes with reduced market impact and slippage concerns when trading SAND. The higher trading volume also indicates broader market participation and price discovery mechanisms, making SAND more suitable for institutional allocation frameworks that prioritize liquidity requirements, regulatory compliance considerations, and correlation management within traditional portfolio components.
Q8: How do the gaming ecosystems differ between ORBR and SAND?
ORBR focuses on a specialized blockchain-based tower defense gaming experience with integrated P2E mechanics, featuring upgradable NFT dragons and orbs with unique elemental properties and skills, creating a concentrated gaming ecosystem around specific gameplay mechanics. SAND provides a comprehensive decentralized metaverse platform where users can create, own, and monetize diverse gaming experiences, supporting broader content creation tools, virtual land ownership, and multiple gaming genres within a single ecosystem. This fundamental difference means ORBR targets players seeking specific tower defense gameplay experiences, while SAND appeals to users interested in virtual world development, land ownership, and participation in a wider metaverse economy.
* The information is not intended to be and does not constitute financial advice or any other recommendation of any sort offered or endorsed by Gate.