This comprehensive guide compares OVR and XTZ, two distinct blockchain platforms with contrasting investment profiles. OVR, launched in 2021, leverages augmented reality technology with spatial domain NFTs covering 1.6 trillion hexagonal parcels, while XTZ, established in 2017, operates as a self-evolving smart contract platform with on-chain governance. The article examines historical price trends, current market status showing OVR at $0.03964 versus XTZ at $0.469, tokenomics differences, institutional adoption, and technological development. Long-term price projections through 2031 are provided alongside risk analysis covering market, technical, and regulatory factors. Investment allocation strategies differentiate between conservative and aggressive investors, with XTZ recommended for stability-seeking investors and OVR for growth exposure. The analysis addresses which asset offers superior investment value based on individual risk profiles and investment objectives on Gate exchange.
Introduction: Investment Comparison Between OVR and XTZ
In the cryptocurrency market, the comparison between OVR vs XTZ has been a topic of ongoing interest among investors. The two assets demonstrate notable differences in market capitalization ranking, application scenarios, and price performance, representing distinct positioning within the crypto asset landscape.
OVR: Launched in 2021, this decentralized network platform has gained recognition for its unique approach to bridging physical and virtual worlds through augmented reality (AR) technology. The platform operates with spatial domain NFTs (ERC-721 tokens) covering 1.6 trillion unique hexagonal land parcels.
XTZ (Tezos): Since its launch in 2017, Tezos has established itself as a self-evolving blockchain platform with on-chain governance mechanisms. With a market ranking of 114 and over 5.7 million holders, it represents one of the more established smart contract platforms in the ecosystem.
This article will provide a comprehensive analysis of OVR vs XTZ investment value comparison, examining historical price trends, supply mechanisms, institutional adoption, technical ecosystems, and future outlook, attempting to address the question most relevant to investors:
"Which is the better buy right now?"
I. Historical Price Comparison and Current Market Status
OVR and XTZ Historical Price Trends
- 2021: OVR experienced notable price movements, with its price reaching $3.33 in December, representing a period of increased market interest in augmented reality and metaverse-related projects.
- 2018-2021: XTZ showed volatility during its early years, with the price falling to $0.350476 in December 2018 before gradually recovering as the platform developed its self-amendment capabilities and governance features.
- Comparative Analysis: During the 2021-2022 market cycle, OVR declined from its peak of $3.33 to lower levels, while XTZ experienced a similar pattern, falling from its October 2021 high of $9.12 as broader market conditions shifted.
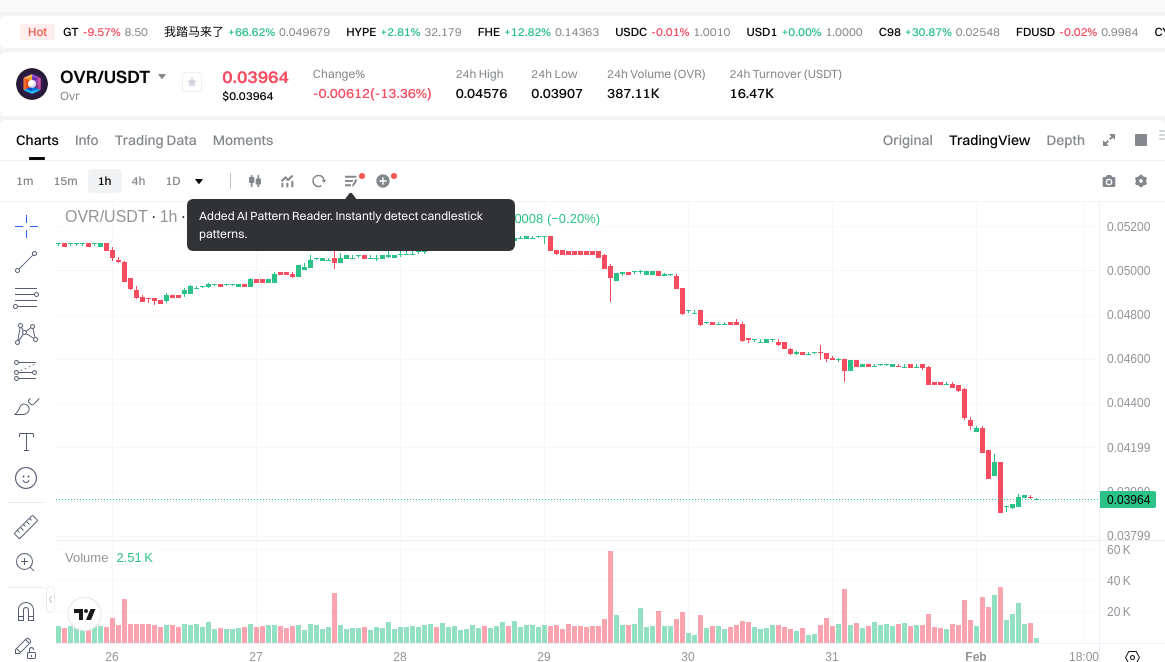
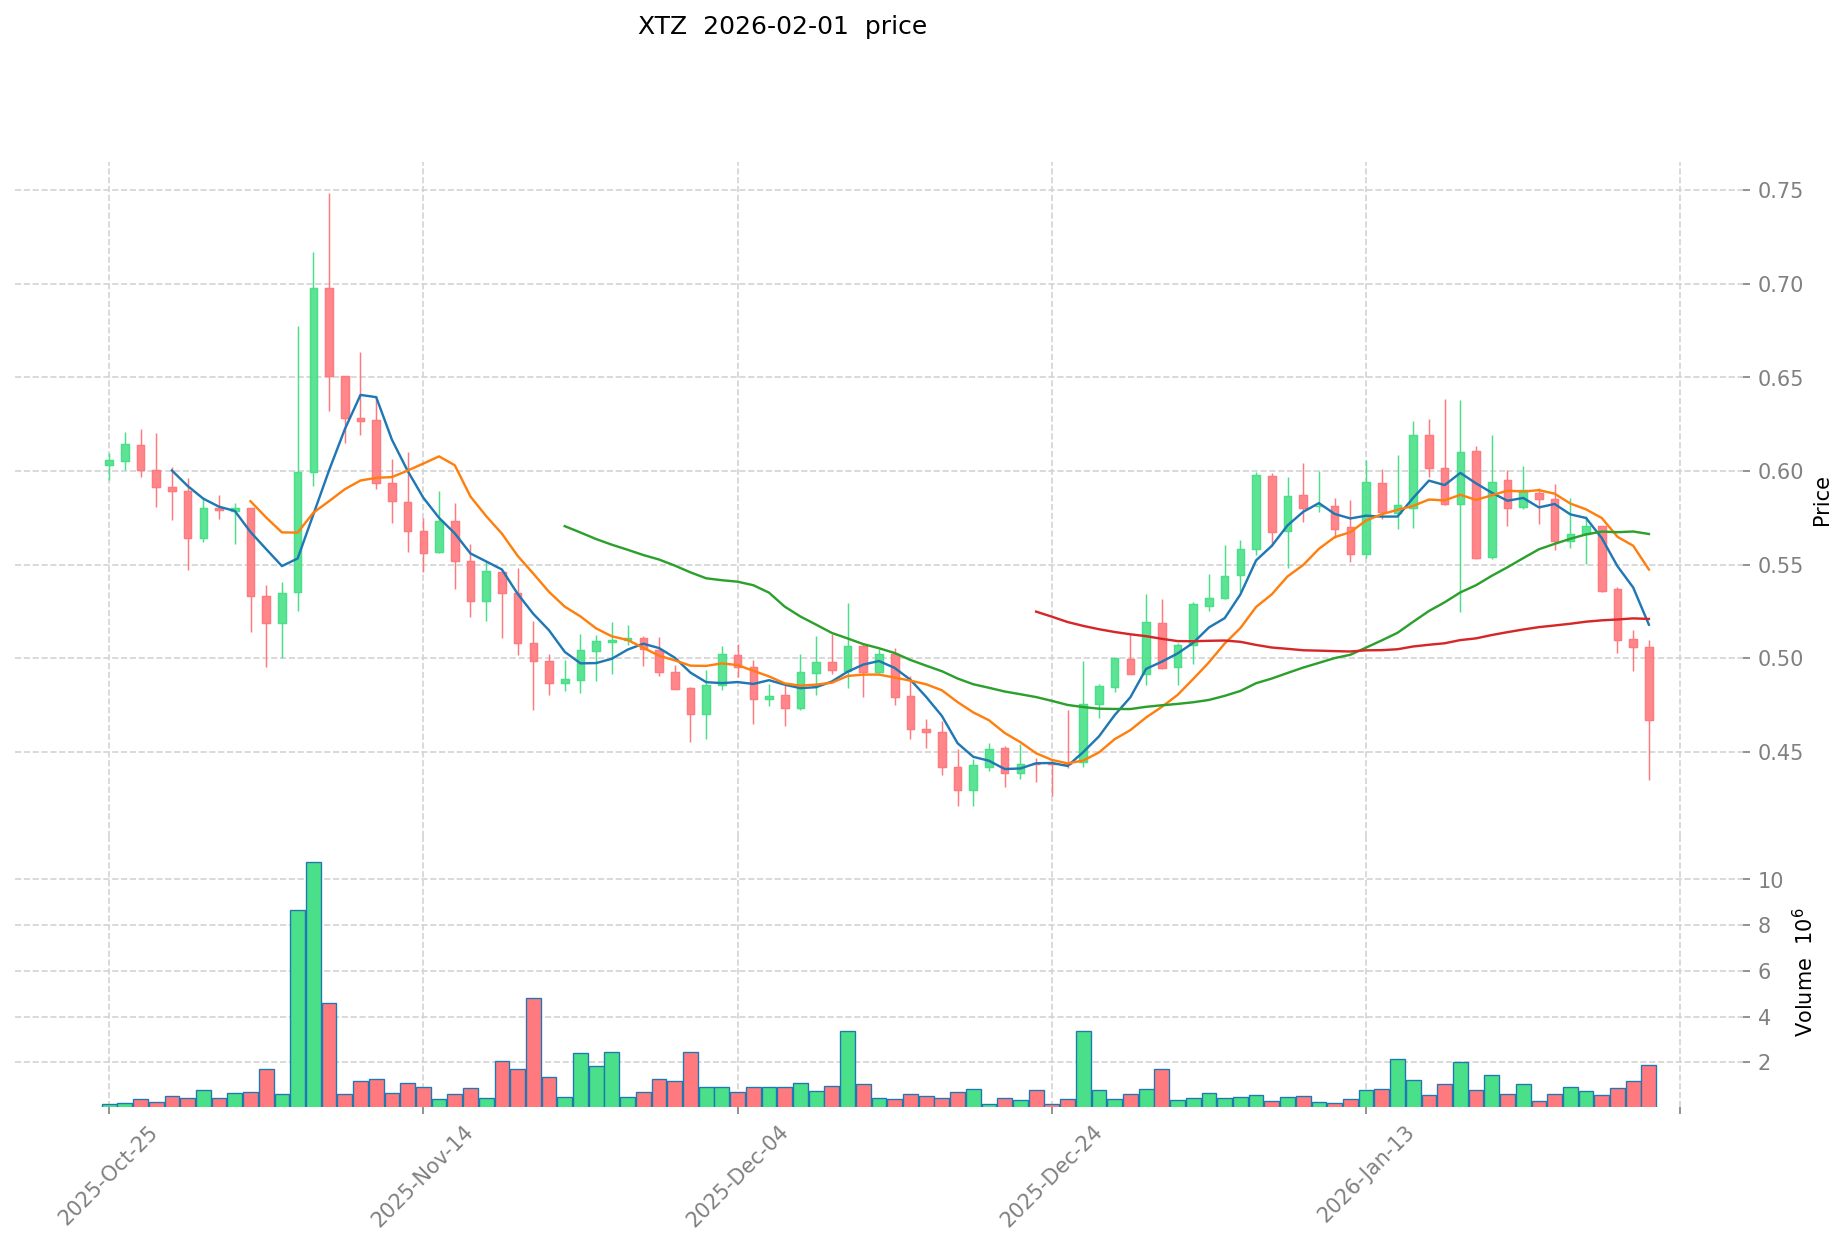
Current Market Status (2026-02-01)
- OVR Current Price: $0.03964
- XTZ Current Price: $0.469
- 24-Hour Trading Volume: OVR $16,496.39 vs XTZ $872,003.86
- Market Sentiment Index (Fear & Greed Index): 14 (Extreme Fear)
View real-time prices:
II. Core Factors Influencing OVR vs XTZ Investment Value
Supply Mechanism Comparison (Tokenomics)
- OVR: The supply dynamics are influenced by market demand and token utility within its ecosystem, with scarcity playing a role in determining value.
- XTZ: Features a supply mechanism that responds to network activity and staking participation, affecting token distribution over time.
- 📌 Historical Pattern: Supply mechanisms can contribute to price cycles through changes in circulating supply and market expectations.
Institutional Adoption and Market Application
- Institutional Holdings: Both assets have varying levels of institutional interest, influenced by factors such as liquidity, regulatory clarity, and use case alignment.
- Enterprise Adoption: The application of these tokens in areas such as payments, settlements, and portfolio diversification varies based on their respective technological capabilities and market positioning.
- National Policies: Regulatory approaches toward these assets differ across jurisdictions, potentially affecting their adoption and trading conditions.
Technological Development and Ecosystem Building
- OVR Technological Progress: Development activities focus on enhancing utility and expanding use cases within its targeted applications.
- XTZ Technological Evolution: Ongoing developments aim to improve network efficiency, governance mechanisms, and ecosystem growth.
- Ecosystem Comparison: Both projects have presence in various sectors including decentralized applications, with different degrees of adoption and integration.
Macroeconomic Factors and Market Cycles
- Performance in Inflationary Environments: The behavior of digital assets during inflationary periods is influenced by multiple factors including investor sentiment and broader market conditions.
- Macroeconomic Monetary Policy: Interest rate changes and currency strength can affect capital flows into and out of digital asset markets.
- Geopolitical Factors: International dynamics and cross-border transaction needs may influence demand patterns for different digital assets.
III. 2026-2031 Price Projection: OVR vs XTZ
Short-term Outlook (2026)
- OVR: Conservative $0.0305-$0.0396 | Optimistic $0.0396-$0.0480
- XTZ: Conservative $0.287-$0.470 | Optimistic $0.470-$0.550
Mid-term Outlook (2028-2029)
- OVR may enter a consolidation phase, with projected price range of $0.033-$0.065
- XTZ may enter a growth phase, with projected price range of $0.305-$0.818
- Key drivers: institutional capital flows, ETF developments, ecosystem expansion
Long-term Outlook (2030-2031)
- OVR: Baseline scenario $0.056-$0.066 | Optimistic scenario $0.069-$0.081
- XTZ: Baseline scenario $0.453-$0.743 | Optimistic scenario $0.779-$1.070
View detailed price predictions for OVR and XTZ
Disclaimer
OVR:
| Year |
Predicted High Price |
Predicted Average Price |
Predicted Low Price |
Price Change |
| 2026 |
0.0479644 |
0.03964 |
0.0305228 |
0 |
| 2027 |
0.049934508 |
0.0438022 |
0.031537584 |
10 |
| 2028 |
0.06467832852 |
0.046868354 |
0.0328078478 |
18 |
| 2029 |
0.0708321434002 |
0.05577334126 |
0.033464004756 |
40 |
| 2030 |
0.068999989139809 |
0.0633027423301 |
0.056339440673789 |
59 |
| 2031 |
0.080704666196644 |
0.066151365734954 |
0.060197742818808 |
66 |
XTZ:
| Year |
Predicted High Price |
Predicted Average Price |
Predicted Low Price |
Price Change |
| 2026 |
0.549666 |
0.4698 |
0.286578 |
0 |
| 2027 |
0.58619295 |
0.509733 |
0.46895436 |
8 |
| 2028 |
0.6465963105 |
0.547962975 |
0.38905371225 |
16 |
| 2029 |
0.8182731105675 |
0.59727964275 |
0.3046126178025 |
27 |
| 2030 |
0.778554014324625 |
0.70777637665875 |
0.4529768810616 |
50 |
| 2031 |
1.07015788150803 |
0.743165195491687 |
0.49792068097943 |
58 |
IV. Investment Strategy Comparison: OVR vs XTZ
Long-term vs Short-term Investment Strategies
- OVR: May appeal to investors interested in augmented reality applications and spatial computing developments, with a focus on emerging technology adoption cycles
- XTZ: May appeal to investors seeking exposure to established smart contract platforms with governance mechanisms and staking capabilities
Risk Management and Asset Allocation
- Conservative Investors: OVR 20-30% vs XTZ 70-80%
- Aggressive Investors: OVR 40-50% vs XTZ 50-60%
- Hedging Tools: Stablecoin allocation, options strategies, cross-asset portfolio diversification
V. Potential Risk Comparison
Market Risk
- OVR: Subject to volatility associated with early-stage projects and fluctuations in metaverse and AR sector sentiment
- XTZ: Experiences volatility influenced by smart contract platform competition and broader market conditions affecting established networks
Technical Risk
- OVR: Scalability considerations, network stability as adoption grows
- XTZ: Network evolution challenges, potential security considerations during protocol upgrades
Regulatory Risk
- Global regulatory developments may affect both assets differently based on their classification, use cases, and jurisdictional considerations. Policy changes regarding digital assets, NFTs, and decentralized platforms could influence their respective market conditions
VI. Conclusion: Which Is the Better Buy?
📌 Investment Value Summary:
- OVR Characteristics: Positioning in augmented reality and spatial computing sector, application-specific use case focus
- XTZ Characteristics: Established blockchain platform with on-chain governance, larger holder base, staking mechanisms
✅ Investment Considerations:
- Novice Investors: Consider allocation weighted toward more established assets with greater liquidity and market depth
- Experienced Investors: May evaluate portfolio diversification across different technology segments and risk profiles
- Institutional Investors: Assessment based on regulatory clarity, liquidity requirements, and alignment with investment mandates
⚠️ Risk Disclosure: Cryptocurrency markets exhibit high volatility. This content does not constitute investment advice.
VII. FAQ
Q1: What are the main differences between OVR and XTZ in terms of market positioning?
OVR focuses on augmented reality (AR) and spatial computing with 1.6 trillion hexagonal land parcels as NFTs, while XTZ operates as an established self-evolving blockchain platform with on-chain governance. OVR, launched in 2021, targets the metaverse and AR sector with specialized use cases, whereas XTZ, launched in 2017, serves as a general-purpose smart contract platform with over 5.7 million holders and a market ranking of 114. The fundamental difference lies in their technological focus: OVR bridges physical and virtual worlds through spatial domain NFTs, while XTZ provides infrastructure for decentralized applications through its self-amendment capabilities and staking mechanisms.
Q2: How do the current trading volumes compare between OVR and XTZ?
XTZ demonstrates significantly higher liquidity with a 24-hour trading volume of $872,003.86 compared to OVR's $16,496.39 as of February 1, 2026. This substantial difference—approximately 53 times greater volume for XTZ—reflects the established market presence and broader adoption of Tezos. Higher trading volumes typically indicate greater market depth, easier entry and exit positions, and lower price slippage for investors. The volume disparity also suggests that XTZ benefits from listings on more exchanges and participation from a wider range of market participants, including institutional investors who prioritize liquidity when making allocation decisions.
Q3: What are the projected price ranges for OVR and XTZ by 2031?
By 2031, OVR's projected price range spans from $0.060 (low scenario) to $0.081 (optimistic scenario), representing approximately 66% growth from current levels. XTZ shows a broader range from $0.498 (low scenario) to $1.070 (optimistic scenario), indicating potential 58% growth in the baseline scenario. The mid-term outlook for 2028-2029 suggests OVR may consolidate between $0.033-$0.065, while XTZ could reach $0.305-$0.818 during its growth phase. These projections factor in institutional capital flows, ETF developments, and ecosystem expansion, though actual outcomes depend on multiple variables including market cycles, technological adoption, and regulatory developments.
Q4: How should portfolio allocation differ between conservative and aggressive investors?
Conservative investors should consider a 70-80% allocation to XTZ versus 20-30% to OVR, prioritizing the established platform's greater liquidity and market depth. Aggressive investors might balance exposure more evenly at 50-60% XTZ and 40-50% OVR, accepting higher volatility for potential upside in the AR sector. This allocation strategy reflects XTZ's position as a more mature asset with governance mechanisms and staking capabilities, while OVR represents exposure to emerging augmented reality applications. Risk management should incorporate stablecoin allocations, options strategies, and cross-asset portfolio diversification regardless of investment approach, with position sizing adjusted based on individual risk tolerance and investment timeframes.
Q5: What are the primary regulatory risks facing OVR and XTZ?
Both assets face distinct regulatory considerations based on their classification and use cases. OVR's NFT-based spatial domain model may encounter evolving regulations concerning digital collectibles, virtual property rights, and metaverse applications, which vary significantly across jurisdictions. XTZ, as an established smart contract platform with staking mechanisms, faces scrutiny regarding securities classification, particularly concerning its proof-of-stake consensus and token distribution model. Global regulatory developments regarding digital assets, decentralized platforms, and blockchain governance could affect their respective market conditions differently. Policy changes in major markets like the United States, European Union, and Asia-Pacific regions may influence adoption patterns, exchange listings, and institutional participation for both assets.
Q6: How do the supply mechanisms of OVR and XTZ impact their long-term value proposition?
OVR's supply dynamics respond to market demand and token utility within its ecosystem, with scarcity mechanisms potentially affecting value as adoption increases in the AR sector. XTZ features a supply mechanism tied to network activity and staking participation, creating a relationship between token distribution and network security. Historical patterns suggest these supply mechanisms contribute to price cycles through changes in circulating supply and market expectations. XTZ's staking model can reduce circulating supply when participation increases, potentially creating upward price pressure during periods of high network activity. OVR's token utility in acquiring spatial domain NFTs creates demand-driven scarcity, though the impact depends on adoption rates of augmented reality applications and platform usage growth.
Q7: What technological developments should investors monitor for OVR and XTZ?
For OVR, investors should track progress in AR technology integration, partnerships with metaverse platforms, user adoption metrics for spatial domain NFTs, and developments in cross-platform compatibility. Key indicators include the number of active land parcels, transaction volumes within the ecosystem, and integration with major AR hardware providers. For XTZ, monitoring focuses on protocol upgrades through its self-amendment mechanism, improvements in transaction throughput and finality times, growth in decentralized applications built on the platform, and expansion of institutional staking participation. Both projects' ecosystem developments—including developer activity, grant programs, and strategic partnerships—provide insights into long-term viability and competitive positioning within their respective sectors.
Q8: How does the current market sentiment of "Extreme Fear" (14 on Fear & Greed Index) affect investment decisions for OVR and XTZ?
The Extreme Fear reading of 14 indicates widespread market pessimism, which historically has coincided with potential accumulation opportunities for long-term investors, though timing remains uncertain. In such conditions, established assets like XTZ with greater liquidity typically experience less severe drawdowns than smaller-cap projects like OVR, which may face amplified volatility. Risk-averse investors might use this sentiment as a signal to increase stablecoin allocations while gradually accumulating positions through dollar-cost averaging strategies. Conversely, experienced investors may view extreme fear as presenting asymmetric risk-reward opportunities, though proper position sizing and risk management remain essential. The sentiment indicator should be considered alongside technical analysis, on-chain metrics, and fundamental developments rather than as a standalone timing signal.
* The information is not intended to be and does not constitute financial advice or any other recommendation of any sort offered or endorsed by Gate.