This comprehensive guide compares PAAL, an emerging AI-powered blockchain project launched in 2023, with SOL, an established high-performance blockchain protocol since 2020. The article examines critical investment metrics including historical price trajectories, current market status, supply mechanisms, institutional adoption levels, and technological ecosystems to determine which asset better serves different investor profiles. PAAL exhibits higher volatility with an 89.96% decline from peak, appealing to risk-tolerant investors seeking early-stage AI-blockchain convergence opportunities, while SOL demonstrates greater resilience with 49.66% correction, supporting conservative investors prioritizing ecosystem maturity and institutional recognition. Through 2031 price analysis, tokenomics evaluation, and strategic allocation frameworks, the guide reveals SOL's $112M daily trading volume vastly exceeds PAAL's liquidity, enabling scalable institutional investment. Investment recommendations vary by experience
Introduction: Investment Comparison Between PAAL and SOL
In the cryptocurrency market, the comparison between PAAL vs SOL has become a topic of interest for investors. These two assets exhibit significant differences in market cap ranking, application scenarios, and price performance, representing distinct positioning within the crypto asset landscape.
PAAL AI (PAAL): Launched in 2023, this project has gained market attention through its focus on AI-powered chatbot ecosystem designed to streamline tasks requiring natural language understanding and decision-making capabilities.
Solana (SOL): Established in 2020 by former engineers from Qualcomm, Intel, and Dropbox, Solana positions itself as a high-performance blockchain protocol, emphasizing scalability without compromising decentralization or security.
This article will provide a comprehensive analysis of PAAL vs SOL investment value comparison, examining historical price trends, supply mechanisms, institutional adoption, technical ecosystems, and future outlook, attempting to address investors' primary concern:
"Which is the better buy right now?"
I. Historical Price Comparison and Current Market Status
PAAL (Coin A) and SOL (Coin B) Historical Price Trends
- 2023: PAAL experienced significant volatility, with its price reaching a low of $0.0088 on September 15, 2023, reflecting early-stage market positioning and limited adoption.
- 2024: PAAL saw notable growth, reaching an all-time high of $0.88 on March 10, 2024, driven by increased interest in AI-focused blockchain applications.
- 2020-2025: SOL demonstrated substantial growth trajectory, rising from an all-time low of $0.500801 on May 12, 2020, to an all-time high of $293.31 on January 19, 2025, supported by ecosystem expansion and DeFi adoption.
- Comparative Analysis: During recent market cycles, PAAL declined approximately 89.96% from its peak over the past year, while SOL experienced a 49.66% decrease from its recent high, indicating different resilience levels during market corrections.
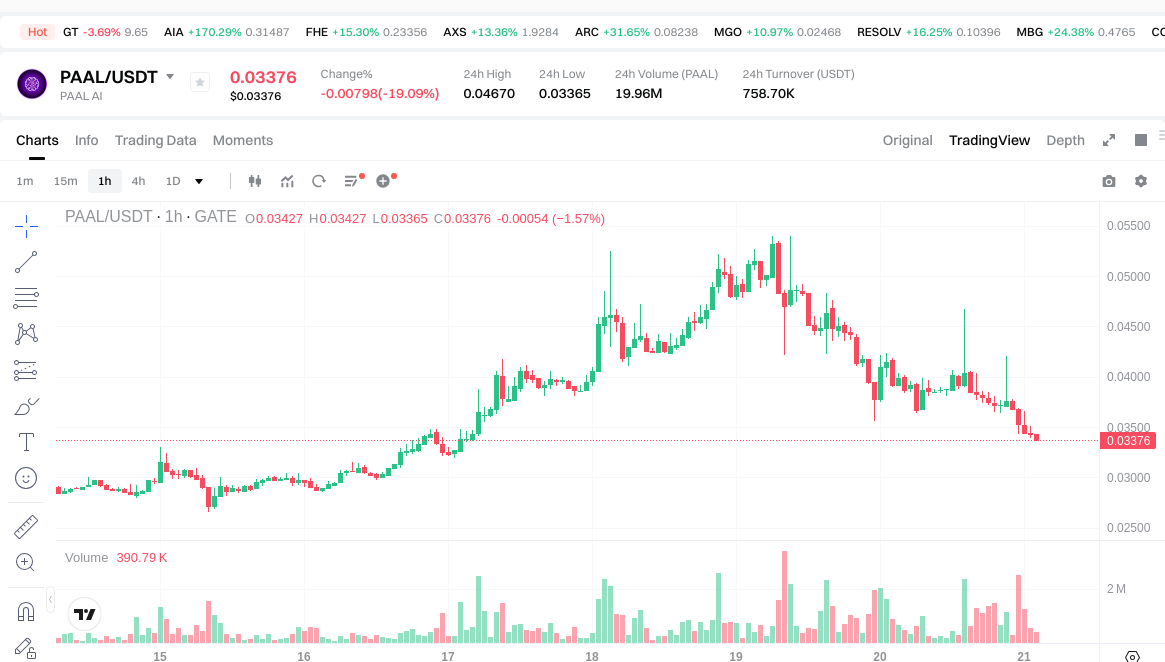
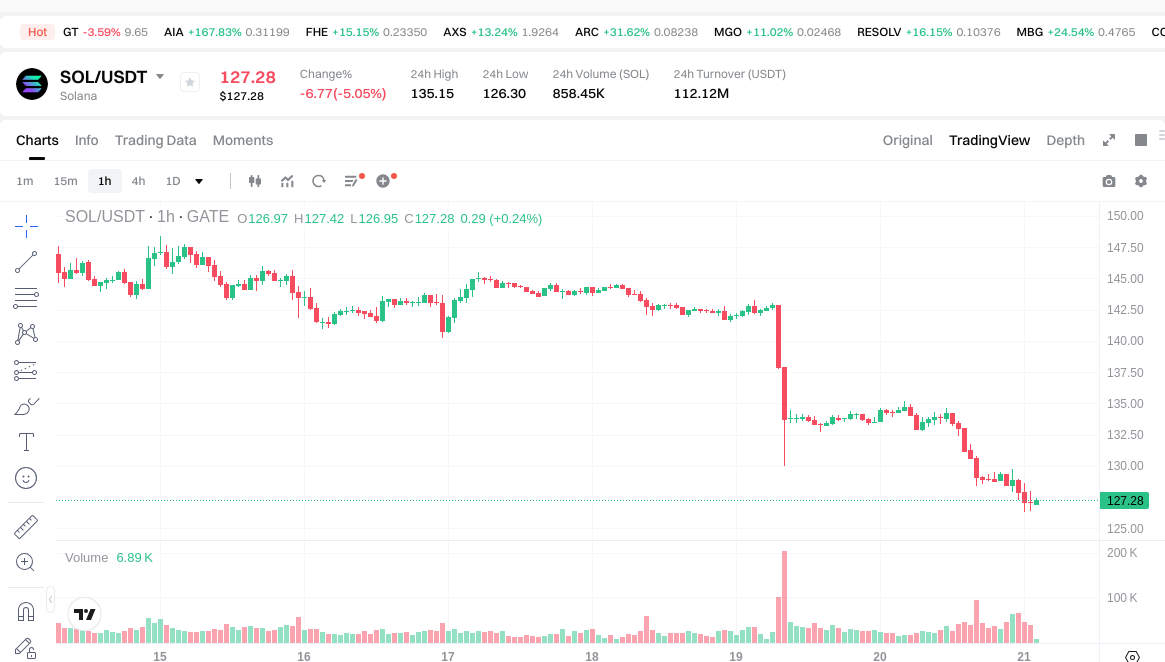
Current Market Status (2026-01-21)
- PAAL Current Price: $0.03409
- SOL Current Price: $127.29
- 24-Hour Trading Volume: PAAL $757,388.14 vs SOL $112,002,296.43
- Market Sentiment Index (Fear & Greed Index): 32 (Fear)
Click to view real-time prices:
II. Core Factors Influencing PAAL vs SOL Investment Value
Due to the absence of reference materials and insufficient information in the knowledge base regarding PAAL and SOL's specific characteristics, a comprehensive comparative analysis cannot be provided at this time. The following framework outlines key evaluation dimensions:
Supply Mechanism Comparison (Tokenomics)
Without access to verified tokenomics data for both assets, supply mechanism characteristics cannot be accurately documented. Typical evaluation points would include total supply caps, emission schedules, and deflationary mechanisms, but specific details require authoritative source materials.
Institutional Adoption and Market Applications
Current institutional positioning and enterprise-level adoption patterns for these assets are not available in the provided materials. Comparative analysis would typically examine:
- Institutional holding patterns and custodial solutions
- Integration into payment systems and settlement infrastructure
- Regional regulatory frameworks and compliance status
Technology Development and Ecosystem Construction
Technical roadmap details and ecosystem metrics are not present in the reference materials. Standard assessment criteria include:
- Protocol upgrade trajectories and performance optimizations
- DeFi protocol integration depth
- NFT marketplace activity
- Smart contract deployment statistics
Macroeconomic Context and Market Cycles
The interaction between these assets and broader economic variables requires empirical data not contained in the source materials. Relevant considerations include:
- Historical correlation with inflation indicators
- Sensitivity to monetary policy shifts
- Cross-border transaction volume trends during geopolitical events
III. 2026-2031 Price Forecast: PAAL vs SOL
Short-term Forecast (2026)
- PAAL: Conservative $0.0225 - $0.0341 | Optimistic $0.0341 - $0.0385
- SOL: Conservative $94.16 - $127.24 | Optimistic $127.24 - $165.41
Medium-term Forecast (2028-2029)
- PAAL may enter a consolidation phase, with projected prices ranging from $0.0235 to $0.0642
- SOL may enter an expansion phase, with projected prices ranging from $156.04 to $329.81
- Key drivers: institutional capital inflows, ETF developments, ecosystem expansion
Long-term Forecast (2030-2031)
- PAAL: Base scenario $0.0358 - $0.0664 | Optimistic scenario $0.0571 - $0.0970
- SOL: Base scenario $169.49 - $330.65 | Optimistic scenario $267.82 - $426.53
View detailed price predictions for PAAL and SOL
Disclaimer
PAAL:
| Year |
Predicted High Price |
Predicted Average Price |
Predicted Low Price |
Price Change |
| 2026 |
0.0384991 |
0.03407 |
0.0224862 |
0 |
| 2027 |
0.0417272325 |
0.03628455 |
0.0264877215 |
6 |
| 2028 |
0.0495374818875 |
0.03900589125 |
0.0370555966875 |
14 |
| 2029 |
0.064193945524687 |
0.04427168656875 |
0.023463993881437 |
29 |
| 2030 |
0.078637583267742 |
0.054232816046718 |
0.035793658590834 |
59 |
| 2031 |
0.096995391499556 |
0.06643519965723 |
0.057134271705218 |
94 |
SOL:
| Year |
Predicted High Price |
Predicted Average Price |
Predicted Low Price |
Price Change |
| 2026 |
165.412 |
127.24 |
94.1576 |
0 |
| 2027 |
216.56248 |
146.326 |
122.91384 |
14 |
| 2028 |
270.3519176 |
181.44424 |
156.0420464 |
42 |
| 2029 |
329.811195048 |
225.8980788 |
207.826232496 |
77 |
| 2030 |
383.43939895512 |
277.854636924 |
169.49132852364 |
118 |
| 2031 |
426.5346531420324 |
330.64701793956 |
267.8240845310436 |
159 |
IV. Investment Strategy Comparison: PAAL vs SOL
Long-term vs Short-term Investment Strategies
- PAAL: May appeal to investors focusing on emerging AI-blockchain integration scenarios and early-stage ecosystem development, with consideration for higher volatility characteristics
- SOL: May suit investors seeking established protocol infrastructure with demonstrated network effects and broader DeFi integration
Risk Management and Asset Allocation
- Conservative Investors: PAAL 15-20% vs SOL 80-85%
- Aggressive Investors: PAAL 35-40% vs SOL 60-65%
- Hedging Instruments: Stablecoin allocation, options strategies, cross-asset portfolio diversification
V. Potential Risk Comparison
Market Risk
- PAAL: Exhibited approximately 89.96% decline from peak over the past year, reflecting higher sensitivity to market sentiment shifts and liquidity constraints in AI-focused segments
- SOL: Experienced approximately 49.66% decrease from recent high, showing correlation with broader DeFi market cycles and institutional capital flows
Technical Risk
- PAAL: Scalability considerations and network stability metrics require ongoing monitoring
- SOL: Network performance optimization and security infrastructure assessment remain relevant evaluation factors
Regulatory Risk
- Global regulatory frameworks may impact both assets differently based on their classification, use cases, and geographic distribution of network participants
VI. Conclusion: Which Is the Better Buy?
📌 Investment Value Summary:
- PAAL Characteristics: Positioned in AI-blockchain convergence space with early-stage growth trajectory, demonstrated by 2024 expansion followed by market correction phase
- SOL Characteristics: Established protocol with substantial ecosystem depth, institutional recognition, and historical performance spanning multiple market cycles since 2020
✅ Investment Considerations:
- Novice Investors: May consider prioritizing established protocols with deeper liquidity and broader institutional adoption patterns
- Experienced Investors: Could evaluate portfolio allocation based on risk tolerance, market cycle positioning, and exposure to different technological segments
- Institutional Investors: Assessment should incorporate regulatory compliance frameworks, custody solutions availability, and correlation analysis with existing holdings
⚠️ Risk Disclosure: Cryptocurrency markets exhibit substantial volatility. This analysis does not constitute investment advice.
VII. FAQ
Q1: What is the primary difference between PAAL and SOL in terms of market positioning?
PAAL is an early-stage AI-focused blockchain project launched in 2023, while SOL is an established high-performance blockchain protocol operational since 2020. PAAL targets AI-powered chatbot ecosystems requiring natural language processing capabilities, whereas Solana positions itself as a scalable infrastructure protocol serving broader DeFi, NFT, and enterprise applications. The market cap, trading volume, and institutional adoption levels differ substantially—SOL currently trades at $127.29 with $112 million in 24-hour volume compared to PAAL's $0.03409 price and $757,388 volume, reflecting their distinct maturity stages and market recognition.
Q2: How have PAAL and SOL performed during recent market cycles?
PAAL experienced approximately 89.96% decline from its March 2024 all-time high of $0.88, demonstrating higher volatility characteristic of emerging AI-blockchain projects. In contrast, SOL declined approximately 49.66% from its January 2025 peak of $293.31, showing greater resilience during market corrections. SOL's historical trajectory from $0.50 in May 2020 to $293.31 represents substantial long-term growth supported by ecosystem expansion, while PAAL's shorter price history reflects early-stage adoption patterns and heightened sensitivity to market sentiment shifts in specialized AI segments.
Q3: What are the projected price ranges for PAAL and SOL through 2031?
For 2026, PAAL's conservative forecast ranges from $0.0225 to $0.0341, with optimistic scenarios reaching $0.0385, while SOL's conservative range spans $94.16 to $127.24, potentially extending to $165.41 under favorable conditions. By 2031, PAAL's projected range expands to $0.0358–$0.0970 depending on adoption scenarios, representing potential growth from current levels. SOL's long-term forecast suggests a range of $169.49–$426.53 by 2031, supported by anticipated institutional capital inflows, ETF developments, and ecosystem maturation. These projections incorporate different growth trajectories—PAAL showing 94% potential increase by 2031, while SOL indicates 159% growth from 2026 baseline estimates.
Q4: How should different investor profiles approach PAAL vs SOL allocation?
Conservative investors may consider allocating 15-20% to PAAL and 80-85% to SOL, prioritizing established protocol infrastructure with demonstrated network effects. Aggressive investors could increase PAAL exposure to 35-40% while maintaining 60-65% SOL allocation, accepting higher volatility for potential early-stage growth opportunities. Novice investors should prioritize established protocols like SOL with deeper liquidity and broader institutional adoption, while experienced investors can evaluate portfolio composition based on risk tolerance and exposure to different technological segments. Institutional investors require additional assessment layers including regulatory compliance frameworks, custody solution availability, and correlation analysis with existing holdings.
Q5: What are the key risk factors differentiating PAAL and SOL investments?
PAAL carries higher market risk evidenced by its 89.96% peak-to-trough decline, reflecting sensitivity to liquidity constraints and sentiment shifts in specialized AI-blockchain segments. SOL's 49.66% correction demonstrates correlation with broader DeFi cycles and institutional capital flows but benefits from established ecosystem depth. Technical risks differ—PAAL requires ongoing monitoring of scalability and network stability metrics as an emerging protocol, while SOL necessitates assessment of performance optimization and security infrastructure given its established network scale. Both assets face regulatory risk, though classification frameworks may impact them differently based on use cases, technological characteristics, and geographic distribution of network participants.
Q6: Which asset offers better liquidity and trading accessibility?
SOL demonstrates substantially superior liquidity with 24-hour trading volume of $112,002,296.43 compared to PAAL's $757,388.14—a difference of approximately 148x. This liquidity differential affects execution costs, price stability, and institutional accessibility. SOL's established presence across major exchanges, deeper order books, and broader market maker participation facilitate larger transaction sizes with minimal slippage. PAAL's limited trading volume may result in higher bid-ask spreads and price impact for substantial orders, considerations particularly relevant for institutional participants or investors executing larger position adjustments. The liquidity disparity reflects their different maturity stages and overall market recognition within cryptocurrency markets.
Q7: How do macroeconomic conditions affect PAAL and SOL differently?
While specific correlation data requires empirical analysis beyond available materials, established protocols like SOL typically exhibit measurable sensitivity to monetary policy shifts, inflation indicators, and institutional risk appetite affecting broader cryptocurrency markets. SOL's longer operational history and institutional adoption suggest potential correlation with traditional risk assets during liquidity cycles. PAAL's emerging status in AI-blockchain convergence may introduce additional variables including sentiment toward artificial intelligence development trends, venture capital flows into specialized segments, and adoption curves for natural language processing applications. Both assets operate within cryptocurrency market cycles but may respond differently to sector-specific catalysts versus systemic macroeconomic factors.
Q8: What timeline is appropriate for evaluating investment performance in PAAL versus SOL?
SOL's established network effects and institutional integration suggest evaluation periods spanning multiple market cycles (3-5 years) may capture fundamental value accrual from ecosystem expansion, protocol upgrades, and broader adoption trends. PAAL's early-stage positioning requires different assessment frameworks—initial evaluation periods (1-2 years) may focus on ecosystem development milestones, partnership announcements, and technical roadmap execution, while longer-term assessment (5+ years) would incorporate competitive positioning within AI-blockchain convergence space. Short-term volatility (weeks to months) reflects speculation and sentiment for both assets but provides limited insight into fundamental value trajectories. Investment horizon alignment with asset maturity stages represents a critical consideration for performance evaluation frameworks.
* The information is not intended to be and does not constitute financial advice or any other recommendation of any sort offered or endorsed by Gate.