This comprehensive comparison examines POPCAT and QNT as distinct cryptocurrency investment opportunities. POPCAT, launched December 2023 on Solana, represents community-driven meme token dynamics with 137,647 holders and higher volatility characteristics. QNT, established August 2018 on Ethereum, focuses on enterprise blockchain interoperability infrastructure with 160,536 holders and institutional adoption positioning. The analysis covers historical price trends, tokenomics mechanisms, technological ecosystems, and risk profiles to guide investment decisions. POPCAT appeals to high-risk tolerance investors seeking speculative opportunities, while QNT suits those pursuing enterprise infrastructure exposure. Real-time pricing and detailed forecasts available on Gate facilitate informed portfolio allocation across different investor profiles and time horizons.
Introduction: Investment Comparison Between POPCAT and QNT
In the cryptocurrency market, the comparison between POPCAT vs QNT continues to be a topic of interest among investors. The two assets differ significantly in market cap ranking, application scenarios, and price performance, representing distinct positioning within the crypto asset landscape.
POPCAT (POPCAT): Launched in December 2023, this meme-inspired token has gained recognition in the market. As of January 17, 2026, it ranks #379 by market capitalization with a circulating supply of approximately 980 million tokens.
QNT (QNT): Introduced in August 2018, Quant Network positions itself as a technology provider enabling trusted digital interaction through its Overledger operating system. Currently ranked #77 by market cap, it has established presence among enterprise blockchain adoption initiatives.
This article will examine historical price trends, supply mechanisms, institutional adoption, technological ecosystems, and future outlook to provide a comprehensive analysis of POPCAT vs QNT investment considerations, addressing the question that concerns investors:
"Which asset presents different risk-return profiles for consideration?"
Note: Market rankings and data referenced are as of January 17, 2026. Both assets carry distinct characteristics - POPCAT operates on the Solana blockchain with approximately 137,647 holders, while QNT functions on Ethereum with around 160,536 holders. Their different technological foundations and market positions suggest varying investment profiles that warrant careful evaluation.
I. Historical Price Comparison and Current Market Status
POPCAT and QNT Historical Price Trends
- 2024: POPCAT reached a peak price of $2.0847 on November 17, 2024, demonstrating notable volatility in the meme token sector.
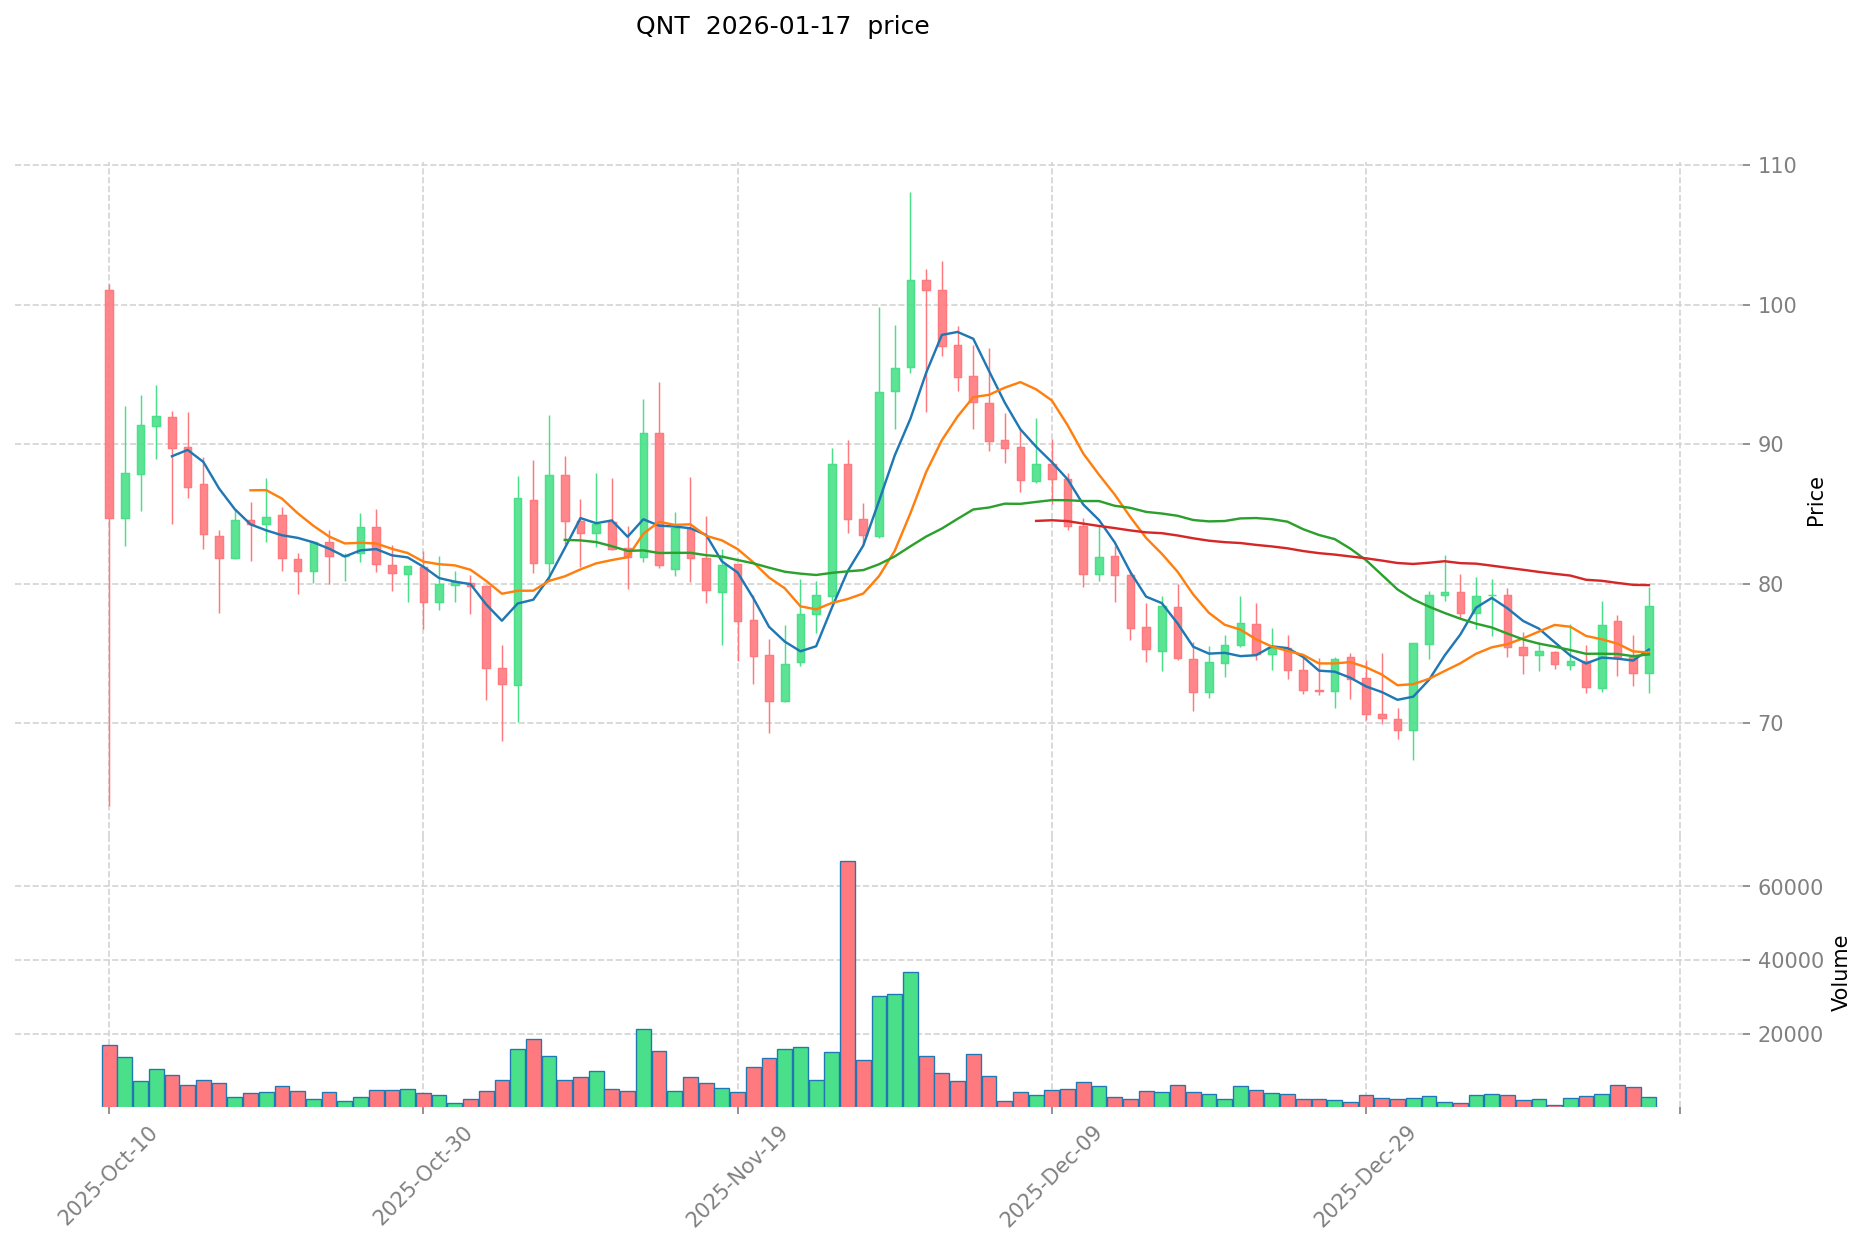
- 2021: QNT achieved its all-time high of $427.42 on September 11, 2021, driven by growing enterprise adoption of blockchain interoperability solutions.
- Comparative Analysis: During the 2024-2025 market cycle, POPCAT experienced a decline from $2.0847 to a low of $0.0684 (recorded on October 10, 2025), representing a significant correction. In contrast, QNT declined from $427.42 to $0.215773 (recorded on August 23, 2018), with its recent trading range showing relatively lower volatility compared to POPCAT's meme-driven price action.
Current Market Status (January 17, 2026)
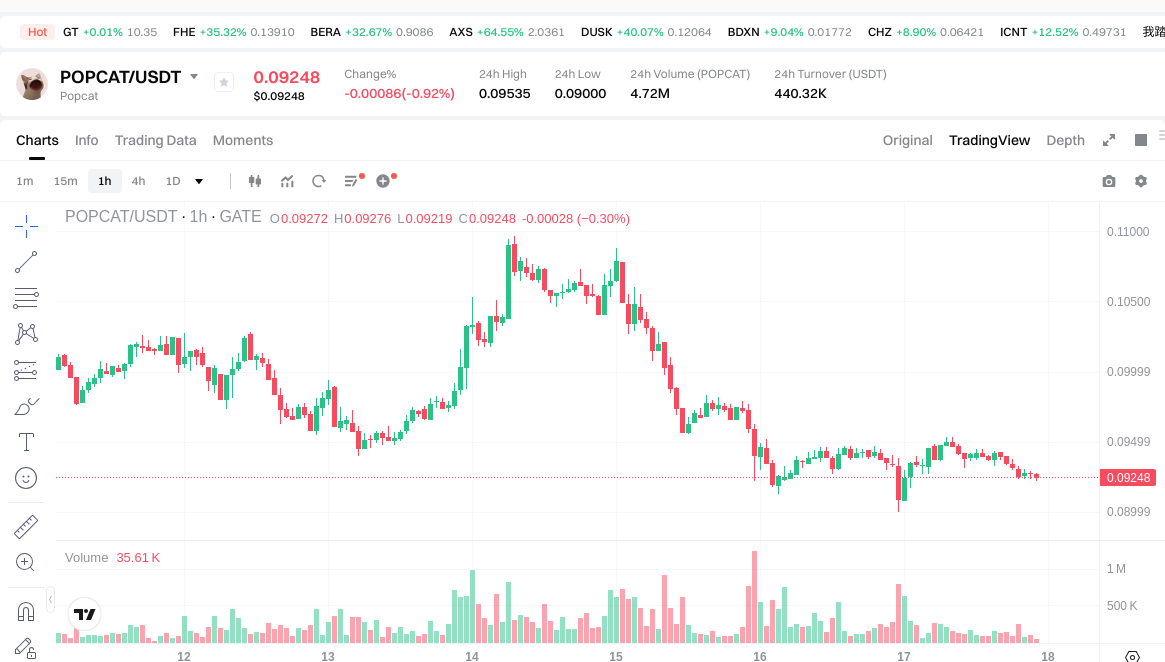
- POPCAT Current Price: $0.09272
- QNT Current Price: $81.18
- 24-Hour Trading Volume: POPCAT $443,107.02 vs QNT $918,672.23
- Market Sentiment Index (Fear & Greed Index): 50 (Neutral)
View Real-time Prices:
II. Core Factors Influencing POPCAT vs QNT Investment Value
Tokenomics Comparison
- POPCAT: As a meme-inspired cryptocurrency, POPCAT's supply mechanism is primarily driven by community engagement and market speculation. The token's distribution model reflects typical characteristics of meme tokens within the digital asset space.
- QNT: Features a structured supply mechanism designed to support enterprise-grade blockchain interoperability solutions. The token serves as a fundamental component within its ecosystem for facilitating cross-chain operations.
- 📌 Historical Pattern: Supply mechanisms have demonstrated their influence on price cycles through periods of heightened market activity and consolidation phases.
Institutional Adoption and Market Applications
- Institutional Holdings: QNT has shown stronger appeal among institutional participants due to its focus on enterprise blockchain solutions and cross-chain technology infrastructure.
- Enterprise Adoption: QNT is positioned within enterprise-focused blockchain interoperability frameworks, while POPCAT's applications center around community-driven initiatives and meme culture participation.
- Regulatory Environment: Different jurisdictions maintain varying approaches toward tokens with distinct use cases, with enterprise-focused assets typically subject to clearer regulatory frameworks.
Technology Development and Ecosystem Building
- POPCAT Technology: The token operates within the broader meme cryptocurrency ecosystem, with value proposition tied to community engagement and cultural relevance in digital asset markets.
- QNT Technology: Focuses on blockchain interoperability technology development, enabling cross-chain communication and data exchange across different blockchain networks.
- Ecosystem Comparison: QNT demonstrates stronger integration within DeFi protocols and enterprise blockchain applications, while POPCAT's ecosystem centers around community participation and speculative trading activities.
Macroeconomic Environment and Market Cycles
- Performance During Inflationary Periods: QNT's value proposition as enterprise infrastructure may provide different risk-return characteristics compared to POPCAT's community-driven model during various economic conditions.
- Macroeconomic Monetary Policy: Interest rate changes and U.S. dollar index movements can influence investment attractiveness across different cryptocurrency categories.
- Geopolitical Factors: Uncertainty in international relations and cross-border transaction requirements may influence demand patterns for different types of digital assets, with enterprise-focused tokens potentially benefiting from increased adoption of blockchain technology in international commerce.
III. 2026-2031 Price Prediction: POPCAT vs QNT
Short-term Forecast (2026)
- POPCAT: Conservative $0.0536-$0.0925 | Optimistic $0.0925-$0.1369
- QNT: Conservative $66.86-$80.56 | Optimistic $80.56-$111.98
Mid-term Forecast (2028-2029)
- POPCAT may enter a consolidation phase with projected price range of $0.0966-$0.1407 in 2028, potentially extending to $0.1066-$0.1612 by 2029
- QNT may enter an expansion phase with projected price range of $90.36-$174.77 in 2028, potentially adjusting to $101.31-$165.92 by 2029
- Key drivers: institutional capital flows, ETF developments, ecosystem expansion
Long-term Forecast (2030-2031)
- POPCAT: Baseline scenario $0.0830-$0.1456 | Optimistic scenario $0.1456-$0.1791 by 2030, extending to $0.0942-$0.1623 baseline and $0.1623-$0.1883 optimistic by 2031
- QNT: Baseline scenario $120.41-$156.38 | Optimistic scenario $156.38-$162.63 by 2030, extending to $119.63-$159.50 baseline and $159.50-$236.07 optimistic by 2031
View detailed price predictions for POPCAT and QNT
Disclaimer: Price predictions are based on historical data analysis and market trends. Cryptocurrency markets are highly volatile and subject to numerous unpredictable factors. These forecasts should not be considered as investment advice, and actual prices may vary significantly from projections.
POPCAT:
| Year |
Predicted High Price |
Predicted Average Price |
Predicted Low Price |
Price Change |
| 2026 |
0.1368704 |
0.09248 |
0.0536384 |
0 |
| 2027 |
0.123849216 |
0.1146752 |
0.075685632 |
23 |
| 2028 |
0.14072940544 |
0.119262208 |
0.09660238848 |
28 |
| 2029 |
0.1611948003328 |
0.12999580672 |
0.1065965615104 |
40 |
| 2030 |
0.179082223337472 |
0.1455953035264 |
0.082989323010048 |
57 |
| 2031 |
0.188312965581045 |
0.162338763431936 |
0.094156482790522 |
75 |
QNT:
| Year |
Predicted High Price |
Predicted Average Price |
Predicted Low Price |
Price Change |
| 2026 |
111.9784 |
80.56 |
66.8648 |
0 |
| 2027 |
141.515724 |
96.2692 |
62.57498 |
18 |
| 2028 |
174.77191914 |
118.892462 |
90.35827112 |
46 |
| 2029 |
165.9203753441 |
146.83219057 |
101.3142114933 |
80 |
| 2030 |
162.631334275332 |
156.37628295705 |
120.4097378769285 |
92 |
| 2031 |
236.06563675196268 |
159.503808616191 |
119.62785646214325 |
96 |
IV. Investment Strategy Comparison: POPCAT vs QNT
Long-term vs Short-term Investment Strategies
- POPCAT: May appeal to investors with higher risk tolerance seeking exposure to meme-driven market dynamics and community-based digital assets. The token's price volatility characteristics suggest suitability for short to medium-term tactical allocation approaches.
- QNT: May appeal to investors interested in enterprise blockchain infrastructure and cross-chain interoperability technology development. The asset's positioning within institutional adoption frameworks suggests potential consideration for longer-term strategic allocation approaches.
Risk Management and Asset Allocation
- Conservative Investors: POPCAT 10-15% vs QNT 20-30% (within overall cryptocurrency portfolio allocation)
- Aggressive Investors: POPCAT 25-35% vs QNT 35-45% (within overall cryptocurrency portfolio allocation)
- Hedging Instruments: Stablecoin allocation for liquidity management, derivatives for downside protection, cross-asset diversification across different cryptocurrency categories
V. Potential Risk Comparison
Market Risk
- POPCAT: Subject to heightened volatility associated with meme token market dynamics, community sentiment shifts, and speculative trading patterns. Price movements may exhibit significant correlation with broader meme cryptocurrency sector trends.
- QNT: Exposed to enterprise adoption cycle variations, institutional capital flow changes, and competitive developments in blockchain interoperability solutions. Price performance may reflect enterprise technology adoption rates and regulatory clarity developments.
Technology Risk
- POPCAT: Dependent on underlying blockchain infrastructure stability and smart contract functionality. Network congestion and transaction cost fluctuations on the Solana blockchain may impact token utility and holder experience.
- QNT: Faces considerations related to cross-chain technology implementation complexity, network security maintenance, and competitive technological developments in blockchain interoperability space. System architecture updates and protocol modifications may introduce transitional risks.
Regulatory Risk
- Global regulatory frameworks continue to evolve regarding digital asset classification and compliance requirements. Meme tokens and enterprise-focused blockchain infrastructure tokens may face different regulatory considerations across jurisdictions. QNT's enterprise positioning may encounter clearer regulatory pathways in certain markets, while POPCAT's community-driven model may face varying interpretations under emerging digital asset regulations. Both assets remain subject to potential policy changes affecting cryptocurrency trading, custody, and cross-border transactions.
VI. Conclusion: Which Is the Better Buy?
📌 Investment Value Summary:
- POPCAT Characteristics: Community-driven market dynamics, meme culture participation, established presence within Solana ecosystem with approximately 137,647 holders, and demonstrated price volatility patterns that may present opportunities for active trading strategies.
- QNT Characteristics: Enterprise blockchain interoperability focus, institutional adoption positioning, established market presence since 2018 with approximately 160,536 holders, and technology infrastructure supporting cross-chain communication capabilities.
✅ Investment Considerations:
- New Investors: Consider beginning with smaller position sizes and prioritizing understanding of fundamental differences between meme tokens and enterprise-focused digital assets. Educational resources regarding blockchain technology, tokenomics, and risk management principles may support informed decision-making.
- Experienced Investors: May evaluate allocation strategies based on individual risk tolerance, portfolio diversification objectives, and assessment of technological development trajectories. Consideration of correlation patterns with broader cryptocurrency market movements and sector-specific dynamics may inform position sizing decisions.
- Institutional Investors: May assess alignment with investment mandates, regulatory compliance frameworks, and due diligence requirements. Evaluation of custody solutions, liquidity profiles, and integration capabilities within existing portfolio management systems may guide allocation considerations.
⚠️ Risk Disclaimer: Cryptocurrency markets exhibit significant volatility and are subject to numerous unpredictable factors including technological changes, regulatory developments, macroeconomic conditions, and market sentiment shifts. This analysis does not constitute investment advice, financial guidance, or recommendations to buy, sell, or hold any digital assets. Investors should conduct independent research, consult with qualified financial advisors, and carefully consider their financial situation, investment objectives, and risk tolerance before making any investment decisions. Past performance does not guarantee future results, and all cryptocurrency investments carry the risk of partial or total capital loss.
VII. FAQ
Q1: What are the fundamental differences between POPCAT and QNT as investment assets?
POPCAT is a meme-inspired token launched in December 2023 on the Solana blockchain, driven primarily by community engagement and speculative trading, while QNT is an enterprise-focused blockchain interoperability solution launched in August 2018 on Ethereum, designed for institutional adoption and cross-chain communication. The key distinctions lie in their market positioning (meme culture vs. enterprise infrastructure), holder base (137,647 vs. 160,536 holders), and value propositions (community-driven speculation vs. technology infrastructure utility). These fundamental differences result in contrasting volatility profiles, with POPCAT demonstrating higher price fluctuations characteristic of meme tokens, while QNT exhibits relatively lower volatility aligned with enterprise technology adoption cycles.
Q2: How do the tokenomics and supply mechanisms differ between POPCAT and QNT?
POPCAT operates with approximately 980 million tokens in circulation and follows a supply mechanism typical of meme tokens, driven by community dynamics and market speculation without structured enterprise utility requirements. QNT features a more structured supply mechanism designed to support enterprise-grade blockchain interoperability solutions, with the token serving as a fundamental component for facilitating cross-chain operations. The distinct tokenomics models reflect their different value propositions: POPCAT's supply dynamics are influenced by community sentiment and meme culture trends, while QNT's supply framework is structured around enterprise adoption requirements and cross-chain transaction functionality. These differences significantly impact price behavior patterns, with POPCAT showing correlation with broader meme cryptocurrency sector movements and QNT reflecting enterprise technology adoption rates.
Q3: What are the projected price ranges for POPCAT and QNT through 2031?
According to historical data analysis and market trend projections, POPCAT's conservative scenario ranges from $0.0536-$0.0925 in 2026, potentially extending to $0.0942-$0.1623 by 2031, with optimistic scenarios reaching $0.1883. QNT's conservative projections range from $66.86-$80.56 in 2026, potentially extending to $119.63-$159.50 by 2031, with optimistic scenarios reaching $236.07. These forecasts incorporate different growth trajectories: POPCAT may experience consolidation phases influenced by meme token market cycles and community engagement levels, while QNT's projections reflect potential enterprise adoption expansion and blockchain interoperability infrastructure development. However, cryptocurrency markets are highly volatile and subject to numerous unpredictable factors including regulatory changes, technological developments, and macroeconomic conditions, making actual prices potentially vary significantly from these projections.
Q4: What allocation strategies are appropriate for different investor profiles when considering POPCAT vs QNT?
Conservative investors may consider allocating 10-15% to POPCAT and 20-30% to QNT within their overall cryptocurrency portfolio, reflecting QNT's relatively lower volatility profile and enterprise positioning. Aggressive investors might increase allocations to 25-35% for POPCAT and 35-45% for QNT, accepting higher risk exposure for potentially greater returns. The allocation differences reflect distinct risk-return profiles: POPCAT suits investors with higher risk tolerance seeking exposure to meme-driven market dynamics and community-based assets, while QNT appeals to those interested in enterprise blockchain infrastructure and institutional adoption potential. Risk management strategies should include stablecoin allocation for liquidity management, derivatives for downside protection, and cross-asset diversification across different cryptocurrency categories. New investors should begin with smaller position sizes while prioritizing education about fundamental differences between meme tokens and enterprise-focused digital assets.
Q5: What are the primary technological risks associated with POPCAT and QNT?
POPCAT faces technology risks primarily related to its dependence on Solana blockchain infrastructure stability, including potential network congestion, transaction cost fluctuations, and smart contract functionality. These factors may impact token utility and holder experience, particularly during periods of high network activity. QNT's technological risks center around cross-chain technology implementation complexity, network security maintenance across multiple blockchain protocols, and competitive developments in the blockchain interoperability space. System architecture updates and protocol modifications may introduce transitional risks during implementation phases. Both assets are subject to broader blockchain technology evolution, with POPCAT vulnerable to Solana-specific technical challenges and QNT exposed to interoperability protocol competition and integration complexity. Understanding these technological dependencies is essential for evaluating long-term viability and potential technical obstacles that could impact price performance.
Q6: How do regulatory considerations differ between POPCAT and QNT investments?
POPCAT and QNT face distinct regulatory considerations due to their different positioning within the digital asset landscape. QNT's enterprise blockchain infrastructure focus may encounter clearer regulatory pathways in certain jurisdictions, as institutional technology solutions often benefit from more defined compliance frameworks. Conversely, POPCAT's community-driven meme token model may face varying interpretations under emerging digital asset regulations, with different jurisdictions potentially classifying meme tokens differently for taxation, trading, and compliance purposes. Both assets remain subject to evolving global regulatory frameworks regarding digital asset classification, custody requirements, and cross-border transaction regulations. Enterprise-focused tokens like QNT may benefit from regulatory clarity developments targeting institutional blockchain adoption, while meme tokens like POPCAT may experience greater regulatory uncertainty as authorities develop frameworks for community-driven digital assets. Investors should monitor regulatory developments across relevant jurisdictions and consider consulting qualified legal and tax advisors.
Q7: What market conditions historically favor POPCAT versus QNT performance?
Historical price patterns suggest POPCAT performance correlates strongly with meme cryptocurrency sector sentiment, social media engagement trends, and broader risk-on market conditions characterized by speculative capital flows into community-driven assets. POPCAT reached its peak of $2.0847 in November 2024 during a period of heightened meme token market activity. QNT historically demonstrates stronger performance during periods of institutional blockchain adoption expansion, enterprise technology investment cycles, and risk-adjusted allocation periods when investors seek exposure to infrastructure-focused digital assets. QNT achieved its all-time high of $427.42 in September 2021 amid growing enterprise interest in blockchain interoperability solutions. Market cycle analysis indicates POPCAT may outperform during retail-driven bull markets with strong social media momentum, while QNT may demonstrate relative strength during institutional adoption phases and periods favoring fundamental technology value propositions over speculative meme culture dynamics.
Q8: How should investors evaluate the long-term sustainability of POPCAT versus QNT?
Long-term sustainability evaluation requires examining distinct factors for each asset. POPCAT's sustainability depends on sustained community engagement, continued cultural relevance within meme cryptocurrency space, ongoing development activity maintaining token utility, and the Solana ecosystem's long-term viability. The meme token sector's historical patterns show varying longevity, with sustainability tied to community strength and cultural staying power. QNT's long-term sustainability relates to enterprise blockchain interoperability technology adoption rates, competitive positioning within cross-chain solution markets, continued development of the Overledger operating system, and successful integration into enterprise infrastructure frameworks. QNT's established presence since 2018 and institutional focus may provide different sustainability characteristics compared to newer meme tokens. Investors should assess community activity metrics for POPCAT (holder growth, social engagement) and enterprise adoption indicators for QNT (partnership announcements, technology integration developments) when evaluating long-term viability. Both assets require ongoing monitoring of development activity, competitive landscape changes, and evolving market demand patterns.
* The information is not intended to be and does not constitute financial advice or any other recommendation of any sort offered or endorsed by Gate.