This comprehensive guide compares POWER and KAVA, two distinct blockchain platforms designed for different market segments. POWER, launched in 2025, functions as an incentive layer connecting mainstream applications to Web3 through gaming and consumer apps, backed by leading Web3 firms like Delphi and Sky Mavis. KAVA, established since 2019, operates as a cross-chain DeFi platform providing collateralized lending and stablecoin infrastructure, supported by over 100 global companies including Ripple. The article analyzes historical price movements, current market status on Gate, tokenomics, institutional adoption, and technical ecosystems to help investors determine optimal portfolio allocation. Current prices show POWER at $0.1561 and KAVA at $0.08013, with distinct risk profiles and investment strategies suited for conservative versus aggressive investors. Professional recommendations and detailed FAQ address key investment questions for both novice and experienced cryptocurrency participants.
Introduction: POWER vs KAVA Investment Comparison
In the cryptocurrency market, the comparison between POWER vs KAVA has become an unavoidable topic for investors. The two differ significantly in market cap ranking, application scenarios, and price performance, representing distinct positioning within the crypto asset landscape.
POWER (POWER): Launched in 2025, it has gained market recognition as an incentive layer connecting mainstream applications to Web3 by transforming user behavior and app revenue into on-chain rewards. Backed by global gaming and Web3 leaders including Delphi, Spartan, Mechanism, and Sky Mavis, the protocol provides millions of Web2 users their first meaningful on-chain experience through games, consumer apps, and creator platforms.
KAVA (KAVA): Since its launch in 2019, it has been positioned as a cross-chain decentralized financial platform providing collateralized lending and stablecoin services for mainstream digital assets. Supported by over 100 companies globally, including notable digital currency funds and blockchain projects such as Ripple and Cosmos, KAVA operates as a decentralized Layer 1 hub dedicated to providing threshold-free permanent financial service infrastructure.
This article will comprehensively analyze the investment value comparison of POWER vs KAVA from perspectives including historical price trends, supply mechanisms, institutional adoption, technical ecosystems, and future predictions, attempting to answer the question investors care about most:
"Which is the better buy right now?"
I. Historical Price Comparison and Current Market Status
POWER and KAVA Historical Price Trends
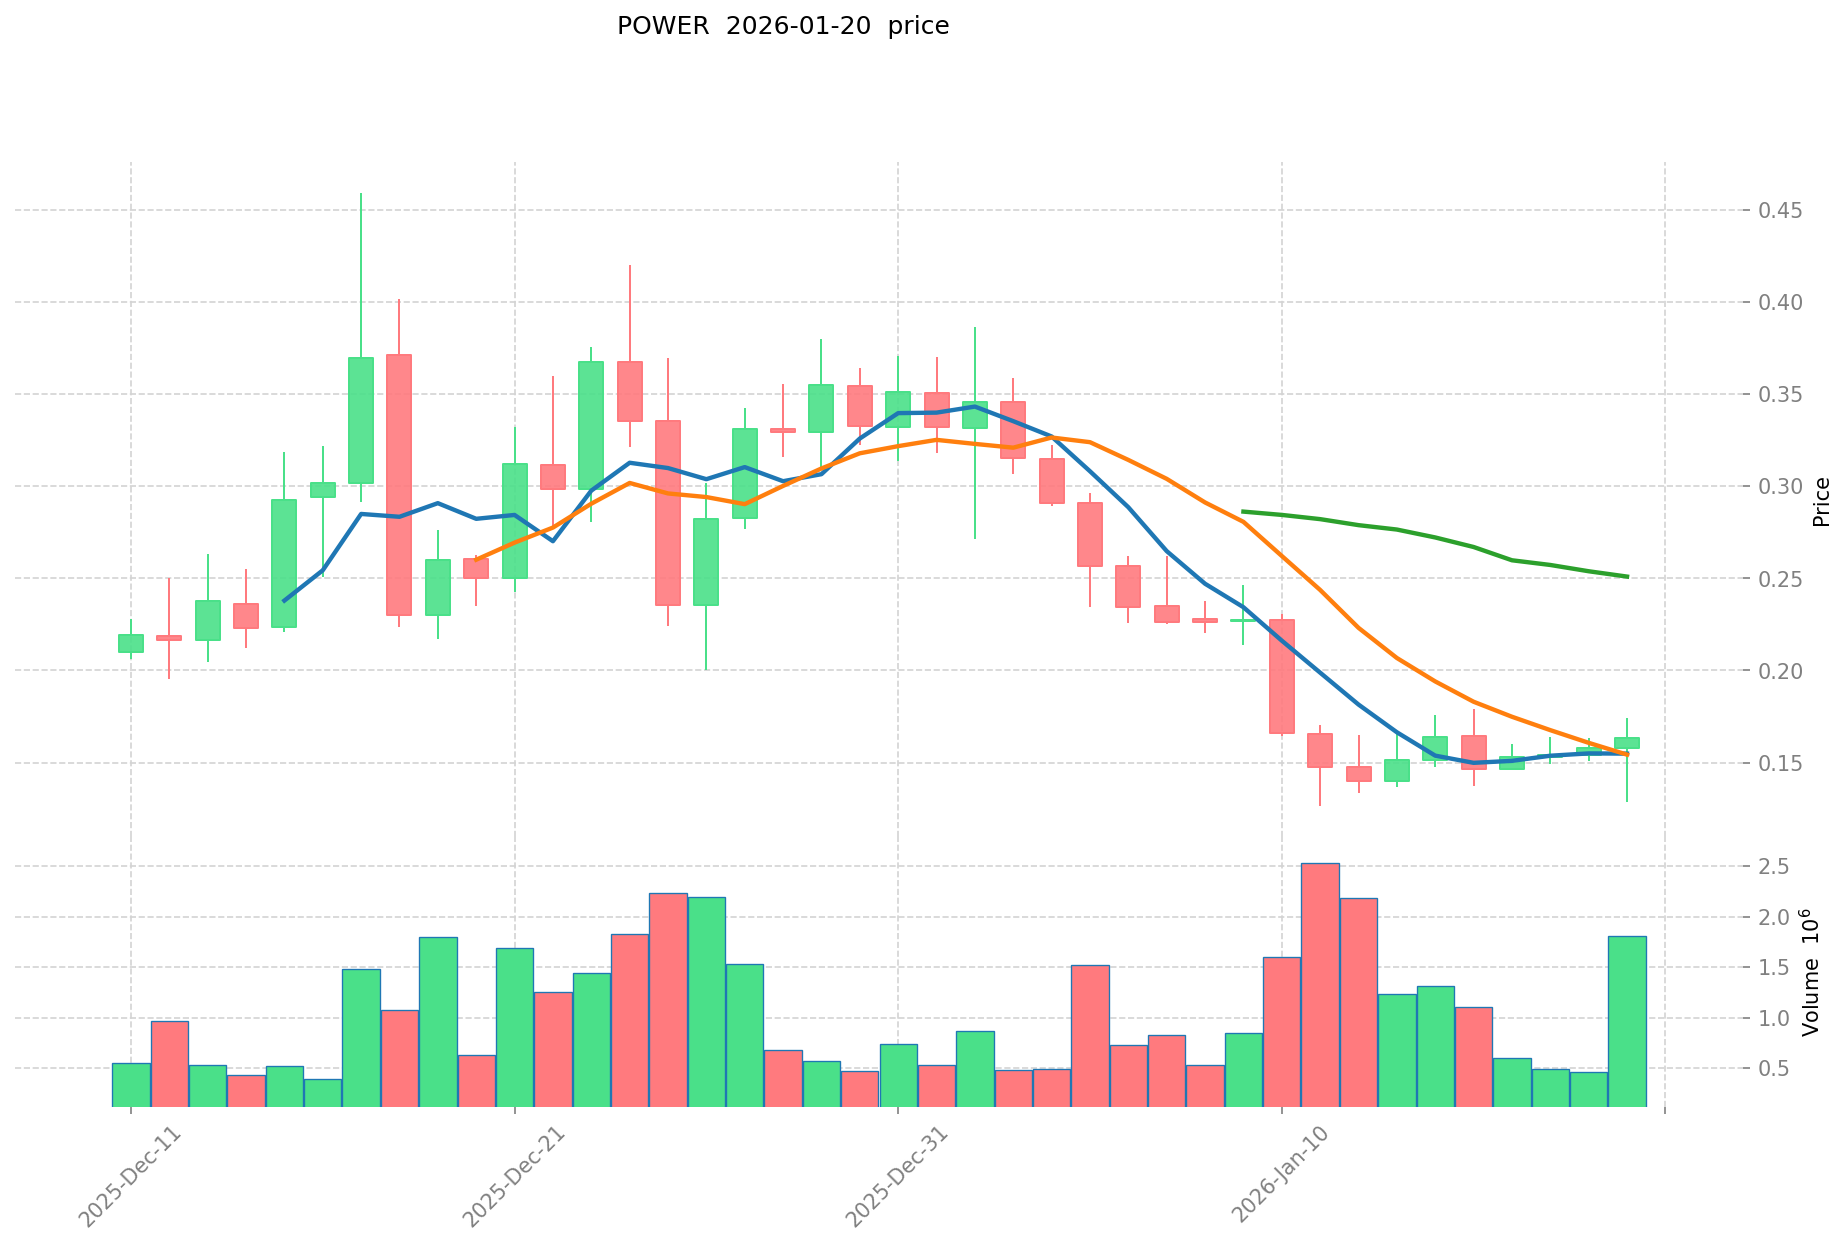
- 2025: POWER experienced significant volatility following its launch in January 2025, reaching a price peak during the initial market enthusiasm phase.
- 2021: KAVA was influenced by the broader DeFi expansion wave, with price movements reflecting increased adoption of cross-chain financial services.
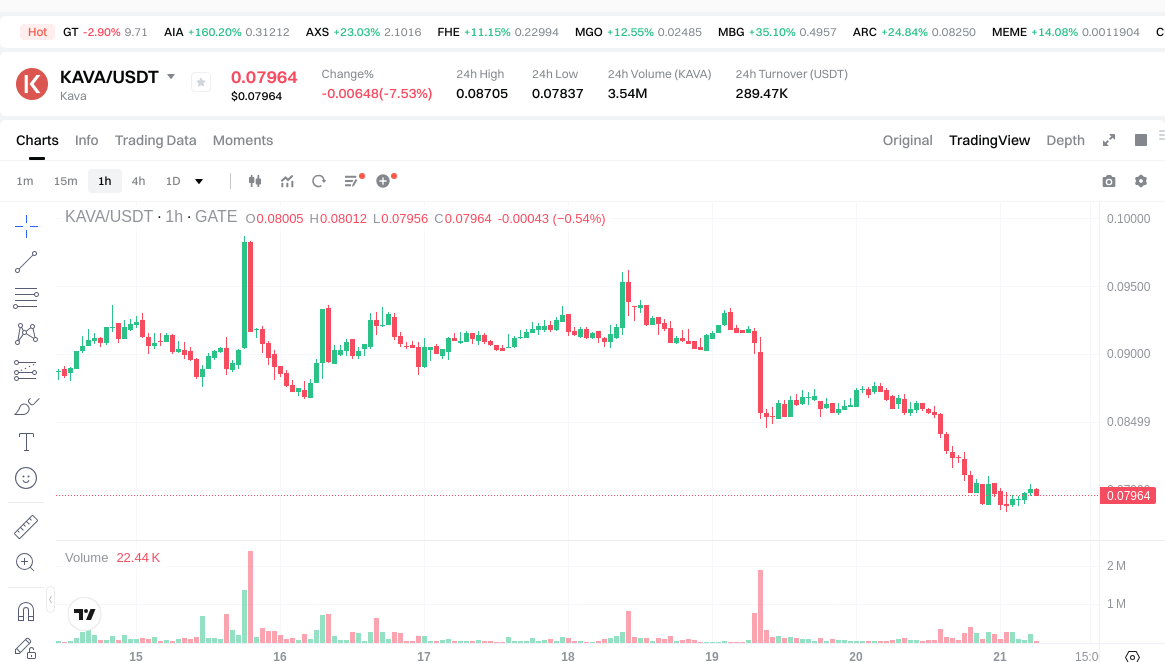
- Comparative Analysis: During recent market cycles, POWER moved from $0.4595 to $0.1263, while KAVA declined from $9.12 to $0.071579 over a longer historical period.
Current Market Status (2026-01-21)
- POWER Current Price: $0.1561
- KAVA Current Price: $0.08013
- 24-Hour Trading Volume: POWER $194,171.22 vs KAVA $288,451.69
- Market Sentiment Index (Fear & Greed Index): 32 (Fear)
View real-time prices:
II. Core Factors Influencing POWER vs KAVA Investment Value
Supply Mechanism Comparison (Tokenomics)
Due to insufficient data in the provided materials regarding the specific supply mechanisms of POWER and KAVA, this section cannot be elaborated upon with verified information.
Institutional Adoption and Market Application
Without concrete data on institutional holdings, enterprise adoption cases, or regulatory attitudes across different jurisdictions for either POWER or KAVA in the reference materials, a comparative analysis cannot be conducted at this time.
Technology Development and Ecosystem Building
The provided materials do not contain sufficient information regarding technical upgrades, development roadmaps, or ecosystem applications (such as DeFi, NFT, payment systems, or smart contract implementations) for either POWER or KAVA to support a meaningful comparison.
Macroeconomic Factors and Market Cycles
In the absence of historical performance data, correlation analysis with macroeconomic indicators, or documented responses to monetary policy changes for both assets, this comparative assessment cannot be completed based on the available reference materials.
III. 2026-2031 Price Prediction: POWER vs KAVA
Short-term Prediction (2026)
- POWER: Conservative $0.122-$0.156 | Optimistic $0.156-$0.175
- KAVA: Conservative $0.053-$0.080 | Optimistic $0.080-$0.112
Mid-term Prediction (2028-2029)
- POWER may enter a consolidation phase, with estimated price range of $0.163-$0.243
- KAVA may enter a growth phase, with estimated price range of $0.080-$0.151
- Key drivers: institutional capital inflows, ETF developments, ecosystem expansion
Long-term Prediction (2030-2031)
- POWER: Baseline scenario $0.156-$0.269 | Optimistic scenario $0.215-$0.317
- KAVA: Baseline scenario $0.112-$0.188 | Optimistic scenario $0.116-$0.222
View detailed price predictions for POWER and KAVA
Disclaimer
POWER:
| Year |
Predicted High Price |
Predicted Average Price |
Predicted Low Price |
Price Change |
| 2026 |
0.175168 |
0.1564 |
0.121992 |
0 |
| 2027 |
0.23541328 |
0.165784 |
0.16081048 |
6 |
| 2028 |
0.2186525176 |
0.20059864 |
0.1765268032 |
28 |
| 2029 |
0.243165671408 |
0.2096255788 |
0.163507951464 |
34 |
| 2030 |
0.26941079387376 |
0.226395625104 |
0.2150758438488 |
45 |
| 2031 |
0.317316108145766 |
0.24790320948888 |
0.156179021977994 |
58 |
KAVA:
| Year |
Predicted High Price |
Predicted Average Price |
Predicted Low Price |
Price Change |
| 2026 |
0.1123206 |
0.07966 |
0.0533722 |
0 |
| 2027 |
0.117108166 |
0.0959903 |
0.051834762 |
19 |
| 2028 |
0.14490695688 |
0.106549233 |
0.07991192475 |
32 |
| 2029 |
0.150873713928 |
0.12572809494 |
0.1093834425978 |
56 |
| 2030 |
0.18808923003024 |
0.138300904434 |
0.11202373259154 |
72 |
| 2031 |
0.221945291435683 |
0.16319506723212 |
0.115868497734805 |
103 |
IV. Investment Strategy Comparison: POWER vs KAVA
Long-term vs Short-term Investment Strategies
- POWER: Suitable for investors focused on Web3 adoption potential and early-stage ecosystem growth, particularly those interested in the convergence of mainstream applications with blockchain technology
- KAVA: Suitable for investors seeking exposure to cross-chain DeFi infrastructure and established platforms with longer operational history
Risk Management and Asset Allocation
- Conservative Investors: POWER 30% vs KAVA 70%
- Aggressive Investors: POWER 60% vs KAVA 40%
- Hedging Tools: Stablecoin allocation, options strategies, cross-asset portfolio diversification
V. Potential Risk Comparison
Market Risk
- POWER: Higher volatility exposure due to recent launch in 2025, with price fluctuations reflecting early-stage market establishment and adoption uncertainty
- KAVA: Extended downward price trajectory from historical peaks, reflecting broader challenges in maintaining market position amid competitive DeFi landscape
Technical Risk
- POWER: Scalability challenges and network stability considerations as user base expands from Web2 to Web3
- KAVA: Cross-chain bridge vulnerabilities and multi-chain integration complexity
Regulatory Risk
- Global regulatory developments may impact both assets differently, with POWER facing scrutiny around user data and incentive mechanisms, while KAVA encounters challenges related to DeFi lending protocols and stablecoin regulations
VI. Conclusion: Which Is the Better Buy?
📌 Investment Value Summary:
- POWER Advantages: Backed by notable gaming and Web3 industry leaders including Delphi, Spartan, and Sky Mavis; positioned at the intersection of mainstream application adoption and blockchain incentivization; potential for growth as Web2 users transition to on-chain experiences
- KAVA Advantages: Established operational history since 2019; supported by over 100 global companies including Ripple and Cosmos; positioned as decentralized Layer 1 infrastructure for cross-chain financial services
✅ Investment Recommendations:
- Novice Investors: Consider starting with smaller allocations to both assets while prioritizing education on fundamental differences between Web3 incentive layers and DeFi infrastructure platforms
- Experienced Investors: Evaluate portfolio diversification by allocating based on risk tolerance, with consideration for POWER's early-stage growth potential versus KAVA's established infrastructure positioning
- Institutional Investors: Conduct thorough due diligence on ecosystem development trajectories, institutional backing quality, and long-term sustainability of each protocol's value proposition
⚠️ Risk Warning: The cryptocurrency market exhibits high volatility. This article does not constitute investment advice.
VII. FAQ
Q1: What is the main difference between POWER and KAVA in terms of their core value propositions?
POWER serves as an incentive layer connecting mainstream applications to Web3, transforming user behavior into on-chain rewards, while KAVA operates as a cross-chain DeFi platform providing collateralized lending and stablecoin services. POWER focuses on bridging Web2 users to blockchain through games and consumer apps (launched 2025), whereas KAVA has established itself since 2019 as decentralized financial infrastructure enabling cross-chain asset management and lending protocols.
Q2: Which cryptocurrency has stronger institutional backing?
Both projects have significant institutional support but from different sectors. POWER is backed by gaming and Web3 industry leaders including Delphi, Spartan, Mechanism, and Sky Mavis, reflecting its focus on application-layer adoption. KAVA has support from over 100 global companies including established blockchain projects like Ripple and Cosmos, emphasizing its infrastructure positioning. The choice depends on whether you value gaming/consumer app partnerships or established blockchain ecosystem connections.
Q3: What are the current price differences and which shows better value?
As of January 21, 2026, POWER trades at $0.1561 while KAVA is at $0.08013, with POWER showing approximately 95% higher price point. However, price alone doesn't indicate value—POWER represents early-stage growth potential with higher volatility since its 2025 launch, while KAVA offers more established infrastructure at a lower entry price with longer operational history. Value assessment depends on your investment timeline and risk tolerance.
Q4: How do the 2031 price predictions compare between POWER and KAVA?
According to baseline scenarios, POWER's predicted range for 2031 is $0.156-$0.269 (optimistic: $0.215-$0.317), representing approximately 58% growth from 2026. KAVA's 2031 baseline range is $0.112-$0.188 (optimistic: $0.116-$0.222), representing approximately 103% growth from 2026. While KAVA shows higher percentage growth potential, POWER maintains a higher absolute price point throughout the prediction period.
Q5: What are the key risks specific to each cryptocurrency?
POWER faces risks related to scalability challenges as it expands its user base from Web2 to Web3, potential regulatory scrutiny around user data and incentive mechanisms, and higher volatility due to its recent launch. KAVA confronts cross-chain bridge vulnerabilities, multi-chain integration complexity, DeFi lending protocol regulations, and the challenge of maintaining market position amid competitive DeFi landscape—evidenced by its significant price decline from historical peaks.
Q6: Which asset allocation strategy is recommended for different investor types?
Conservative investors should consider a 30% POWER / 70% KAVA allocation, favoring KAVA's established infrastructure and operational history. Aggressive investors may prefer 60% POWER / 40% KAVA, positioning for POWER's early-stage growth potential in Web3 adoption. Both strategies should incorporate risk management through stablecoin allocations, options strategies, and cross-asset portfolio diversification to mitigate the inherent volatility of cryptocurrency markets.
Q7: How do market conditions affect POWER vs KAVA differently?
POWER's performance is more closely tied to Web3 adoption trends, gaming industry growth, and mainstream application integration with blockchain technology. KAVA's performance correlates with DeFi sector expansion, cross-chain transaction volumes, and broader institutional adoption of decentralized financial services. During the current market sentiment index of 32 (Fear), both assets face downward pressure, but POWER shows $194,171.22 in 24-hour trading volume compared to KAVA's $288,451.69, indicating different levels of market liquidity and investor interest.
Q8: What should novice investors prioritize when choosing between POWER and KAVA?
Novice investors should prioritize education on the fundamental differences between these projects before allocating capital. Start with smaller positions in both assets to gain exposure while learning about Web3 incentive mechanisms (POWER) versus cross-chain DeFi infrastructure (KAVA). Focus on understanding each project's use case, institutional backing quality, and how they fit within your broader investment goals rather than making decisions based solely on price predictions or short-term volatility.
* The information is not intended to be and does not constitute financial advice or any other recommendation of any sort offered or endorsed by Gate.