This comprehensive analysis compares QNT and SNX, two prominent cryptocurrency protocols operating in distinct market segments. QNT focuses on blockchain interoperability through its Overledger system, positioning itself as enterprise-grade infrastructure for cross-chain connectivity since 2018. SNX operates as a decentralized synthetic asset protocol enabling derivatives trading with over-collateralization mechanisms since 2018. The article examines historical price movements—QNT declining from $427.42 to $76.60 and SNX from $28.53 to $0.5103—alongside current market conditions with neutral sentiment. Core comparison factors include tokenomics, institutional adoption, technological ecosystems, and risk profiles. Investment strategy recommendations differentiate between conservative and aggressive portfolios, with allocation suggestions of 30-60% per asset. Price performance analysis, fee structures, and regulatory considerations provide investors with essential decision-making frameworks for evaluating these
Introduction: Investment Comparison Between QNT and SNX
In the cryptocurrency market, the comparison between QNT vs SNX remains a topic of significant interest among investors. Both assets exhibit notable differences in market capitalization ranking, application scenarios, and price performance, while representing distinct positioning within the crypto asset landscape.
QNT (Quant): Since its launch in 2018, Quant has gained market recognition through its focus on blockchain interoperability via the Overledger operating system, positioning itself as an enterprise-grade solution provider.
SNX (Synthetix): Introduced in 2018, Synthetix has established itself as a decentralized synthetic asset protocol, enabling exposure to various asset classes including fiat currencies, precious metals, and cryptocurrencies.
This article provides a comprehensive analysis of QNT vs SNX investment value comparison, examining historical price movements, supply mechanisms, institutional adoption, technological ecosystems, and future projections. The analysis aims to address investors' primary concern:
"Which represents a more suitable investment opportunity under current market conditions?"
I. Historical Price Comparison and Current Market Status
Historical Price Trends of QNT (Coin A) and SNX (Coin B)
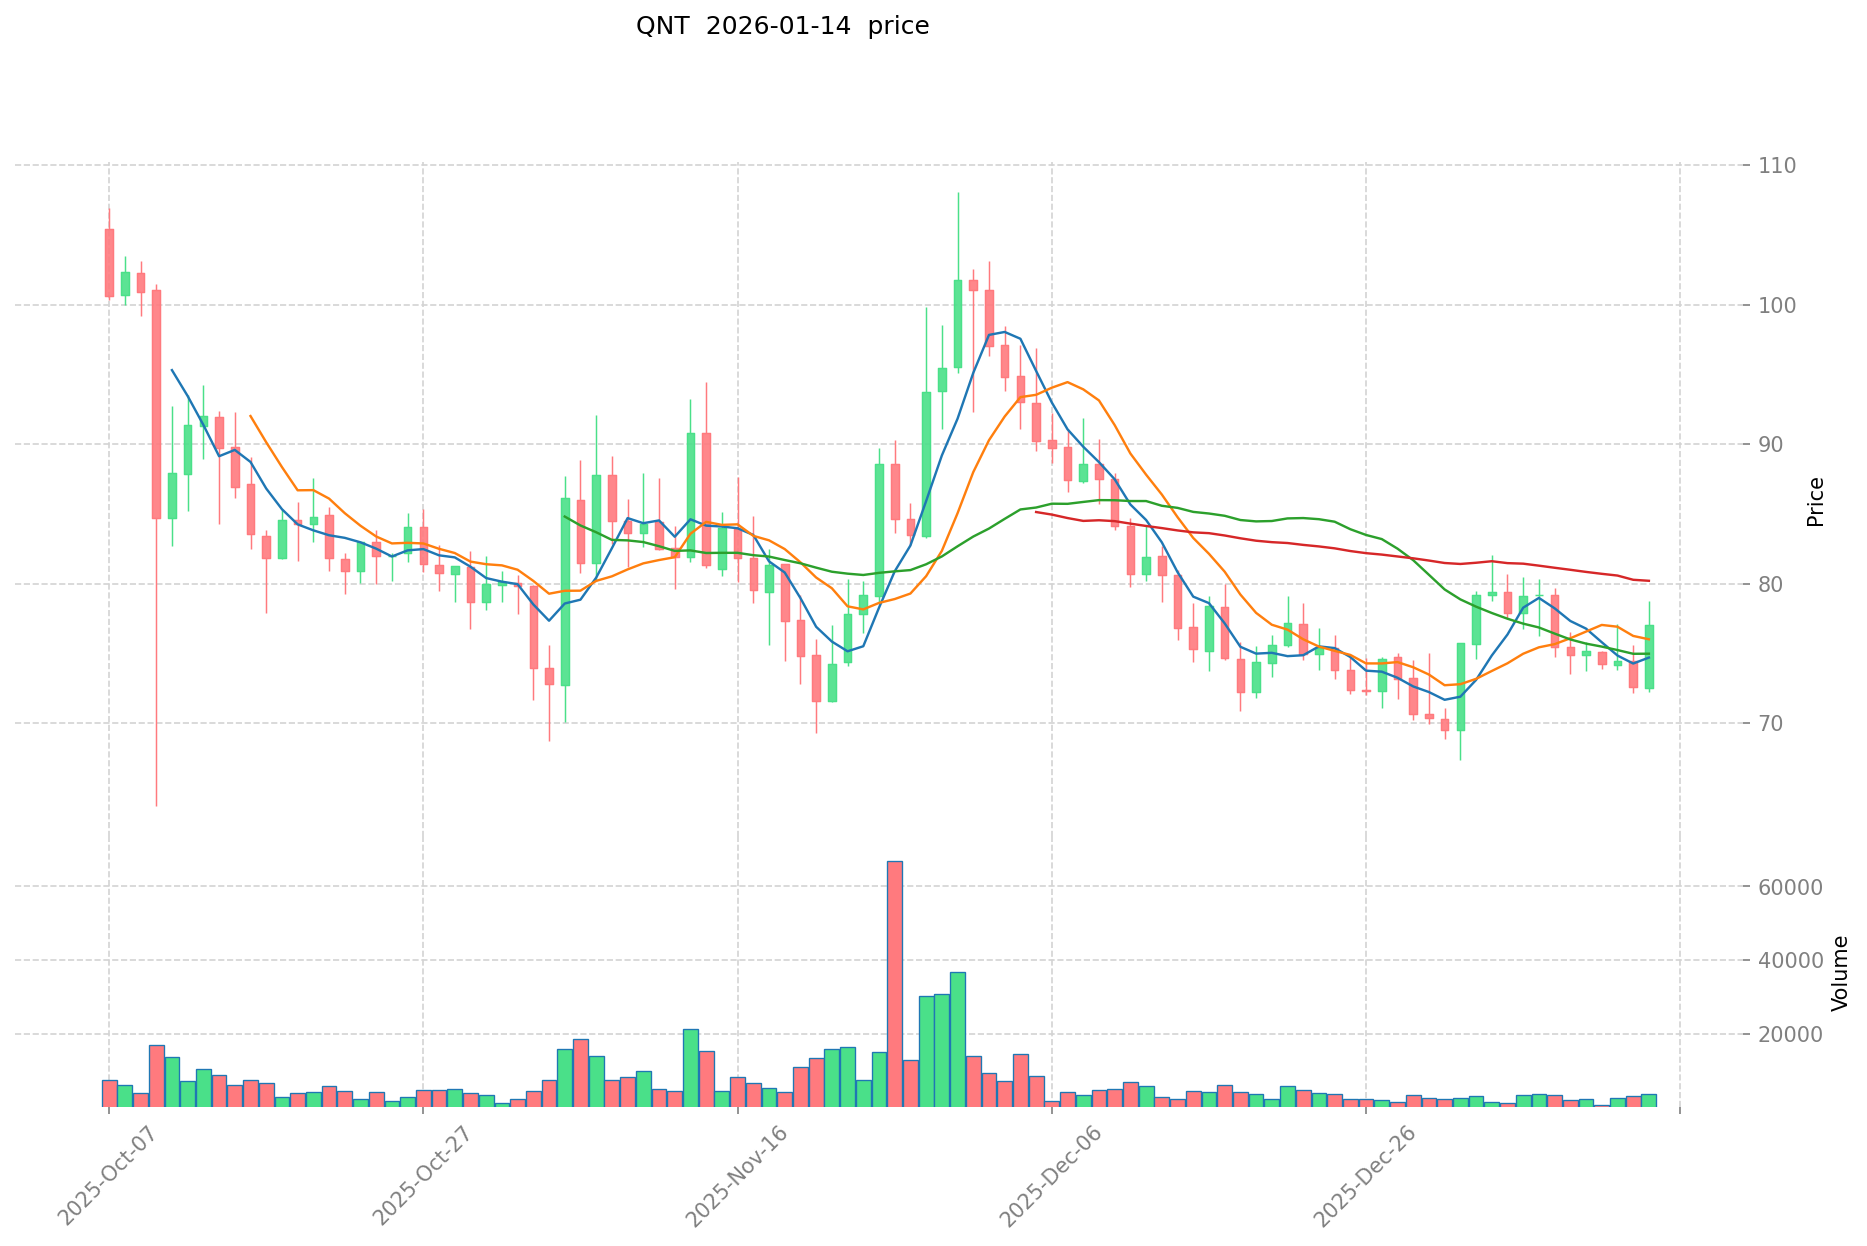
- 2021: QNT reached a significant milestone with its price approaching $427.42 on September 11, 2021, representing a period of strong market performance driven by growing enterprise blockchain adoption interest.
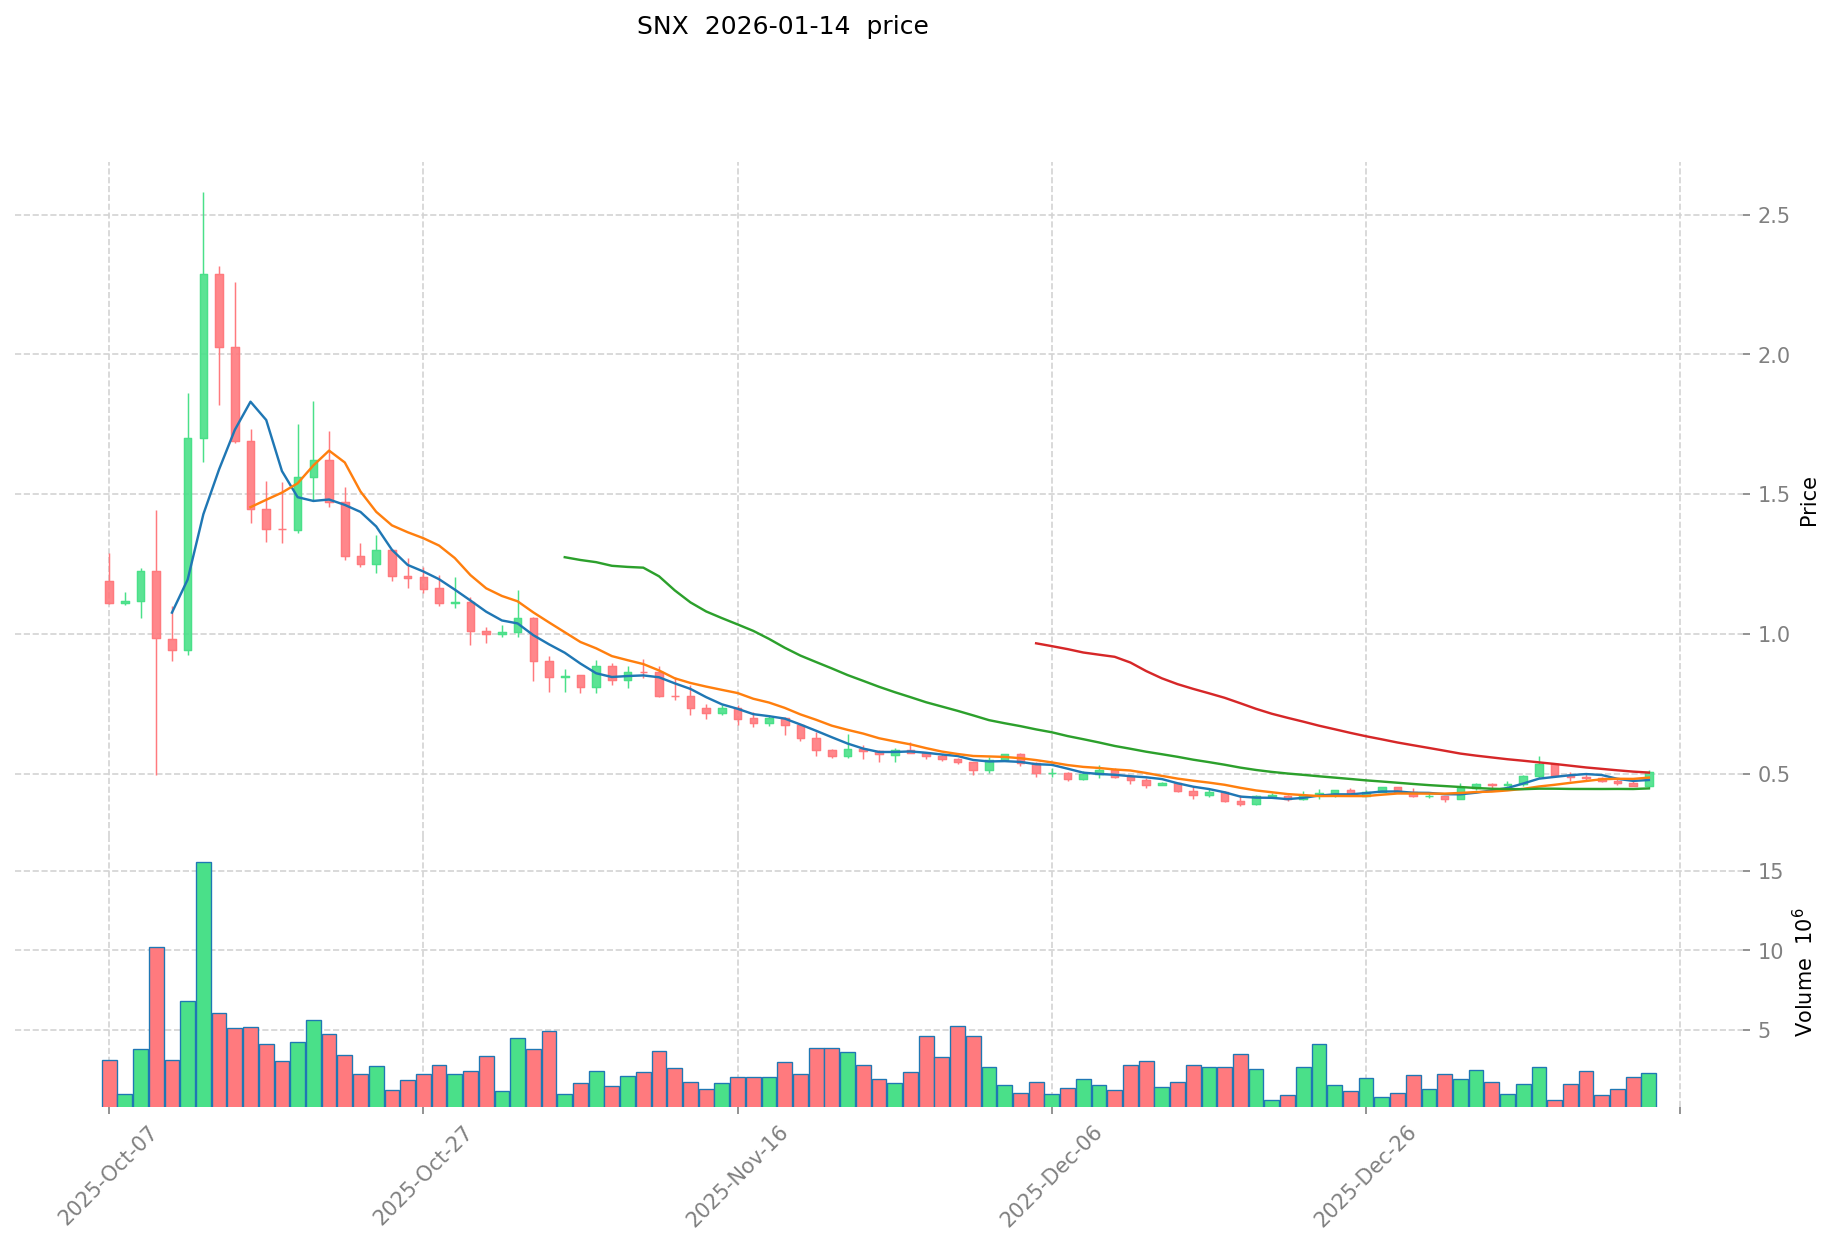
- 2021: SNX experienced notable volatility with its historical high of $28.53 recorded on February 14, 2021, reflecting the DeFi sector's expansion during that period.
- Comparative Analysis: During the recent market cycle, QNT declined from its all-time high of $427.42 to its current level of $76.60, representing a substantial correction, while SNX similarly decreased from $28.53 to $0.5103, showing proportionally greater downward movement relative to its peak.
Current Market Status (January 14, 2026)
- QNT Current Price: $76.60
- SNX Current Price: $0.5103
- 24-Hour Trading Volume: QNT recorded $295,796.97 compared to SNX's $1,064,132.59
- Market Sentiment Index (Fear & Greed Index): 48 (Neutral)
View real-time prices:
II. Core Factors Influencing QNT vs SNX Investment Value
Supply Mechanism Comparison (Tokenomics)
- SNX: The token features an inflationary supply model designed to incentivize staking and collateralization within the Synthetix protocol. SNX tokens can be locked and unlocked based on collateralization ratios, with a target threshold of 750%. When SNX value increases, tokens can be unlocked accordingly, or additional synthetic assets can be issued.
- QNT: Supply mechanism details were not available in the provided materials.
- 📌 Historical Pattern: Supply mechanisms play a role in shaping token price cycles, particularly through staking incentives and collateralization requirements that affect circulating supply dynamics.
Institutional Adoption and Market Application
- Market Application: SNX serves as the collateral backbone for Synthetix's synthetic asset platform, enabling users to mint and trade synthetic assets that track real-world asset prices. The growth of the synthetic asset market directly impacts SNX demand.
- Ecosystem Usage: SNX value correlates with the adoption and usage rate of the Synthetix network, as increased platform activity drives demand for the native token.
- QNT Application: Materials indicate QNT's value may be influenced by DeFi lending market developments, though specific institutional adoption details were not provided.
Technology Development and Ecosystem Building
- SNX Technology: The Synthetix protocol employs an over-collateralization mechanism where synthetic assets are backed by SNX at ratios around 750%. This design allows for flexible asset creation and unlocking mechanisms tied to token value fluctuations.
- Ecosystem Comparison: SNX operates within the DeFi synthetic assets space, facilitating the creation and trading of derivatives and synthetic instruments. The platform's growth depends on synthetic asset market expansion and protocol usage rates.
- QNT Technology: Specific technical upgrades and ecosystem developments were not detailed in the available materials.
Macroeconomic Factors and Market Cycles
- Market Environment: The investment value of both tokens depends on broader crypto market conditions, including risk asset sentiment and liquidity environments.
- Network Activity: Token valuations are influenced by the underlying blockchain network activity levels and market demand for their respective use cases.
- Development Focus: Investors should monitor technological progress, market acceptance rates, and ecosystem maturation for both networks when evaluating investment potential.
III. 2026-2031 Price Forecast: QNT vs SNX
Short-term Forecast (2026)
- QNT: Conservative $39.69-$76.32 | Optimistic $76.32-$100.74
- SNX: Conservative $0.44-$0.50 | Optimistic $0.50-$0.64
Medium-term Forecast (2028-2029)
- QNT may enter a growth phase, with estimated price range of $73.56-$148.19
- SNX may enter a consolidation phase, with estimated price range of $0.40-$0.88
- Key drivers: institutional capital inflows, ETF developments, ecosystem expansion
Long-term Forecast (2030-2031)
- QNT: Baseline scenario $75.37-$132.49 | Optimistic scenario $127.40-$141.64
- SNX: Baseline scenario $0.42-$0.88 | Optimistic scenario $0.71-$0.87
View detailed price predictions for QNT and SNX
Disclaimer
QNT:
| Year |
Predicted High Price |
Predicted Average Price |
Predicted Low Price |
Price Change |
| 2026 |
100.7424 |
76.32 |
39.6864 |
0 |
| 2027 |
102.696192 |
88.5312 |
61.97184 |
15 |
| 2028 |
117.60484608 |
95.613696 |
90.8330112 |
24 |
| 2029 |
148.1868867456 |
106.60927104 |
73.5603970176 |
39 |
| 2030 |
132.494002048512 |
127.3980788928 |
90.452636013888 |
66 |
| 2031 |
141.64118411301504 |
129.946040470656 |
75.36870347298048 |
69 |
SNX:
| Year |
Predicted High Price |
Predicted Average Price |
Predicted Low Price |
Price Change |
| 2026 |
0.640588 |
0.5044 |
0.443872 |
-1 |
| 2027 |
0.61256858 |
0.572494 |
0.39502086 |
12 |
| 2028 |
0.7880666157 |
0.59253129 |
0.4029212772 |
16 |
| 2029 |
0.8766796701195 |
0.69029895285 |
0.483209266995 |
35 |
| 2030 |
0.87750802886292 |
0.78348931148475 |
0.705140380336275 |
53 |
| 2031 |
0.872023603682526 |
0.830498670173835 |
0.423554321788655 |
62 |
IV. Investment Strategy Comparison: QNT vs SNX
Long-term vs Short-term Investment Strategies
-
QNT: May appeal to investors focused on enterprise blockchain interoperability solutions and seeking exposure to institutional-grade infrastructure development. The token's positioning in the blockchain connectivity space suggests relevance for those monitoring cross-chain technology adoption trends.
-
SNX: May suit investors interested in DeFi synthetic asset protocols and decentralized derivatives markets. The token's role in collateralizing synthetic assets positions it for consideration by those tracking DeFi innovation and synthetic asset market expansion.
Risk Management and Asset Allocation
-
Conservative Investors: A balanced approach might consider moderate exposure to both assets, such as QNT: 30-40% vs SNX: 30-40%, with remaining allocation to stablecoins or established digital assets to manage volatility.
-
Aggressive Investors: Higher risk tolerance portfolios could explore QNT: 50-60% vs SNX: 40-50% allocation, recognizing the elevated volatility characteristics of both tokens and their respective market segments.
-
Hedging Tools: Portfolio risk management may incorporate stablecoin reserves for liquidity management, derivatives instruments where available, and cross-asset diversification across multiple crypto sectors to mitigate concentrated exposure.
V. Potential Risk Comparison
Market Risk
-
QNT: The token demonstrates sensitivity to enterprise blockchain adoption cycles and interoperability solution demand. Historical price movements indicate substantial volatility, with significant corrections observed from peak levels. Market liquidity considerations arise from the token's trading volume characteristics.
-
SNX: Exhibits correlation with DeFi sector trends and synthetic asset market development. Price movements reflect the broader DeFi market cycle dynamics, with notable volatility during market transitions. The token's performance links to protocol usage rates and synthetic asset trading activity levels.
Technical Risk
-
QNT: Considerations include the adoption trajectory of blockchain interoperability solutions and the competitive landscape within the cross-chain infrastructure space. Network effect development and enterprise integration timelines represent areas for monitoring.
-
SNX: Technical considerations involve the over-collateralization mechanism sustainability, synthetic asset peg stability, and protocol security architecture. The collateralization ratio requirements and token unlocking mechanisms introduce complexity that warrants evaluation.
Regulatory Risk
- Global regulatory developments present differentiated implications for both assets. Enterprise-focused blockchain solutions may face institutional compliance requirements, while DeFi synthetic asset protocols encounter evolving regulatory frameworks for derivatives and synthetic instruments. Jurisdictional variations in digital asset classification and securities law interpretation could impact both tokens differently based on their respective use cases and market positioning.
VI. Conclusion: Which Is the Better Buy?
📌 Investment Value Summary:
-
QNT Characteristics: Positioning in blockchain interoperability infrastructure, enterprise-grade solution focus, and cross-chain connectivity use case. The token represents exposure to institutional blockchain adoption trends and network interconnectivity development.
-
SNX Characteristics: Foundation in DeFi synthetic asset protocols, collateralization mechanism innovation, and decentralized derivatives market participation. The token provides access to synthetic asset market growth and DeFi infrastructure evolution.
✅ Investment Considerations:
-
Novice Investors: Consider establishing foundational knowledge of both blockchain interoperability and DeFi synthetic assets before allocation. Starting with smaller position sizes while monitoring ecosystem developments and market dynamics may support informed decision-making.
-
Experienced Investors: May evaluate both assets based on portfolio diversification objectives, risk tolerance parameters, and conviction in respective technology sectors. Assessment of historical volatility patterns, ecosystem maturation stages, and market cycle positioning could inform allocation strategies.
-
Institutional Investors: Due diligence may encompass comprehensive evaluation of technology infrastructure, regulatory compliance frameworks, liquidity profiles, and ecosystem sustainability metrics for both assets. Consideration of institutional custody solutions and risk management protocols remains relevant.
⚠️ Risk Disclosure: The cryptocurrency market exhibits extreme volatility characteristics. This content does not constitute investment advice. Market participants should conduct independent research and consult qualified financial professionals before making investment decisions.
VII. FAQ
Q1: What are the primary differences between QNT and SNX in terms of their core use cases?
QNT focuses on blockchain interoperability solutions through its Overledger operating system, positioning itself as enterprise-grade infrastructure for cross-chain connectivity, while SNX operates as a decentralized synthetic asset protocol enabling users to create and trade derivatives tracking various asset classes including fiat currencies, precious metals, and cryptocurrencies. QNT targets institutional blockchain adoption and network interconnectivity, whereas SNX serves the DeFi synthetic assets market with its over-collateralization mechanism requiring approximately 750% collateralization ratios for minting synthetic assets.
Q2: How have QNT and SNX performed since their historical price peaks?
QNT has declined from its all-time high of $427.42 (September 11, 2021) to its current level of $76.60, representing an approximately 82% correction, while SNX decreased from its peak of $28.53 (February 14, 2021) to $0.5103, reflecting an approximately 98% decline from its historical high. Both tokens experienced substantial corrections following their respective peak periods, with SNX showing proportionally greater downward movement relative to its all-time high compared to QNT.
Q3: What supply mechanisms distinguish QNT and SNX tokenomics?
SNX features an inflationary supply model designed to incentivize staking and collateralization within the Synthetix protocol, where tokens can be locked and unlocked based on collateralization ratios with a target threshold of 750%. When SNX value increases, tokens can be unlocked accordingly, or additional synthetic assets can be issued. QNT's specific supply mechanism details were not comprehensively documented in available materials, though the token operates within the blockchain interoperability infrastructure space with enterprise-focused positioning.
Q4: What are the price projections for QNT and SNX through 2031?
For 2026, QNT forecasts range from conservative estimates of $39.69-$76.32 to optimistic scenarios of $76.32-$100.74, while SNX projections span $0.44-$0.50 conservatively and $0.50-$0.64 optimistically. By 2031, QNT's baseline scenario projects $75.37-$132.49 with optimistic estimates of $127.40-$141.64, whereas SNX baseline forecasts indicate $0.42-$0.88 with optimistic projections of $0.71-$0.87. These projections reflect differentiated growth trajectories influenced by institutional capital inflows, ecosystem expansion, and respective market segment developments.
Q5: Which allocation strategy suits different investor profiles for QNT vs SNX?
Conservative investors might consider a balanced approach with QNT comprising 30-40% and SNX representing 30-40% of crypto allocation, with remaining positions in stablecoins or established digital assets for volatility management. Aggressive investors with higher risk tolerance could explore QNT allocation of 50-60% versus SNX at 40-50%, recognizing elevated volatility characteristics. Portfolio risk management may incorporate stablecoin reserves for liquidity, derivatives instruments where available, and cross-asset diversification across multiple crypto sectors to mitigate concentrated exposure risks.
Q6: What technical risks differentiate QNT and SNX investments?
QNT faces considerations including blockchain interoperability solution adoption trajectories, competitive landscape within cross-chain infrastructure, network effect development timelines, and enterprise integration progress. SNX technical risks involve over-collateralization mechanism sustainability, synthetic asset peg stability, protocol security architecture, collateralization ratio requirements sustainability, and token unlocking mechanism complexity. Both assets require monitoring of their respective ecosystem maturation stages, though they operate in fundamentally different technical domains—enterprise blockchain connectivity versus DeFi synthetic derivatives infrastructure.
Q7: How do current market conditions affect QNT and SNX trading activity?
As of January 14, 2026, QNT recorded 24-hour trading volume of $295,796.97 compared to SNX's $1,064,132.59, indicating relatively higher liquidity for SNX despite its lower absolute price point. The current Market Sentiment Index (Fear & Greed Index) stands at 48 (Neutral), suggesting neither extreme fear nor greed dominates market psychology. Both tokens exhibit sensitivity to broader crypto market conditions, with SNX demonstrating correlation with DeFi sector trends and QNT showing responsiveness to enterprise blockchain adoption cycles.
Q8: What regulatory considerations apply differently to QNT versus SNX?
QNT's enterprise-focused blockchain interoperability solutions may encounter institutional compliance requirements and corporate blockchain adoption frameworks, potentially facing scrutiny related to enterprise technology infrastructure regulations. SNX's DeFi synthetic asset protocol confronts evolving regulatory frameworks for derivatives and synthetic instruments, with potential classification challenges under securities laws depending on jurisdiction. Jurisdictional variations in digital asset classification, derivatives regulation, and securities law interpretation could impact both tokens differently based on their respective use cases—enterprise infrastructure versus decentralized financial derivatives—creating differentiated regulatory risk profiles for investors to evaluate.
* The information is not intended to be and does not constitute financial advice or any other recommendation of any sort offered or endorsed by Gate.