This article provides an in-depth comparison of RAI and XLM, two stablecoin solutions popular in cross-border payments, examining factors such as historical price trends, supply mechanisms, and institutional adoption. The comparison aids investors in identifying "which is the better buy right now?" by assessing market conditions, technical ecosystems, and investment strategies. It addresses the interests of both new and experienced investors through detailed analysis, while considering potential risks. Explore diverse perspectives on price predictions, regulatory impacts, and ecosystem developments to tailor investment strategies. Access detailed price comparisons on Gate.
Introduction: RAI vs XLM Investment Comparison
In the cryptocurrency market, the comparison between RAI vs XLM has always been a topic that investors can't avoid. The two not only have significant differences in market cap ranking, application scenarios, and price performance, but also represent different cryptocurrency asset positioning.
RAI (RAI): Since its launch in 2021, it has gained market recognition for its position as a non-pegged, ETH-backed stable asset.
XLM (XLM): Since its inception in 2014, it has been hailed as a decentralized gateway for transmitting digital and fiat currencies, and is one of the cryptocurrencies with the highest global trading volume and market capitalization.
This article will comprehensively analyze the investment value comparison between RAI vs XLM, focusing on historical price trends, supply mechanisms, institutional adoption, technical ecosystems, and future predictions, and attempt to answer the question that investors are most concerned about:
"Which is the better buy right now?"
I. Price History Comparison and Current Market Status
RAI and XLM Historical Price Trends
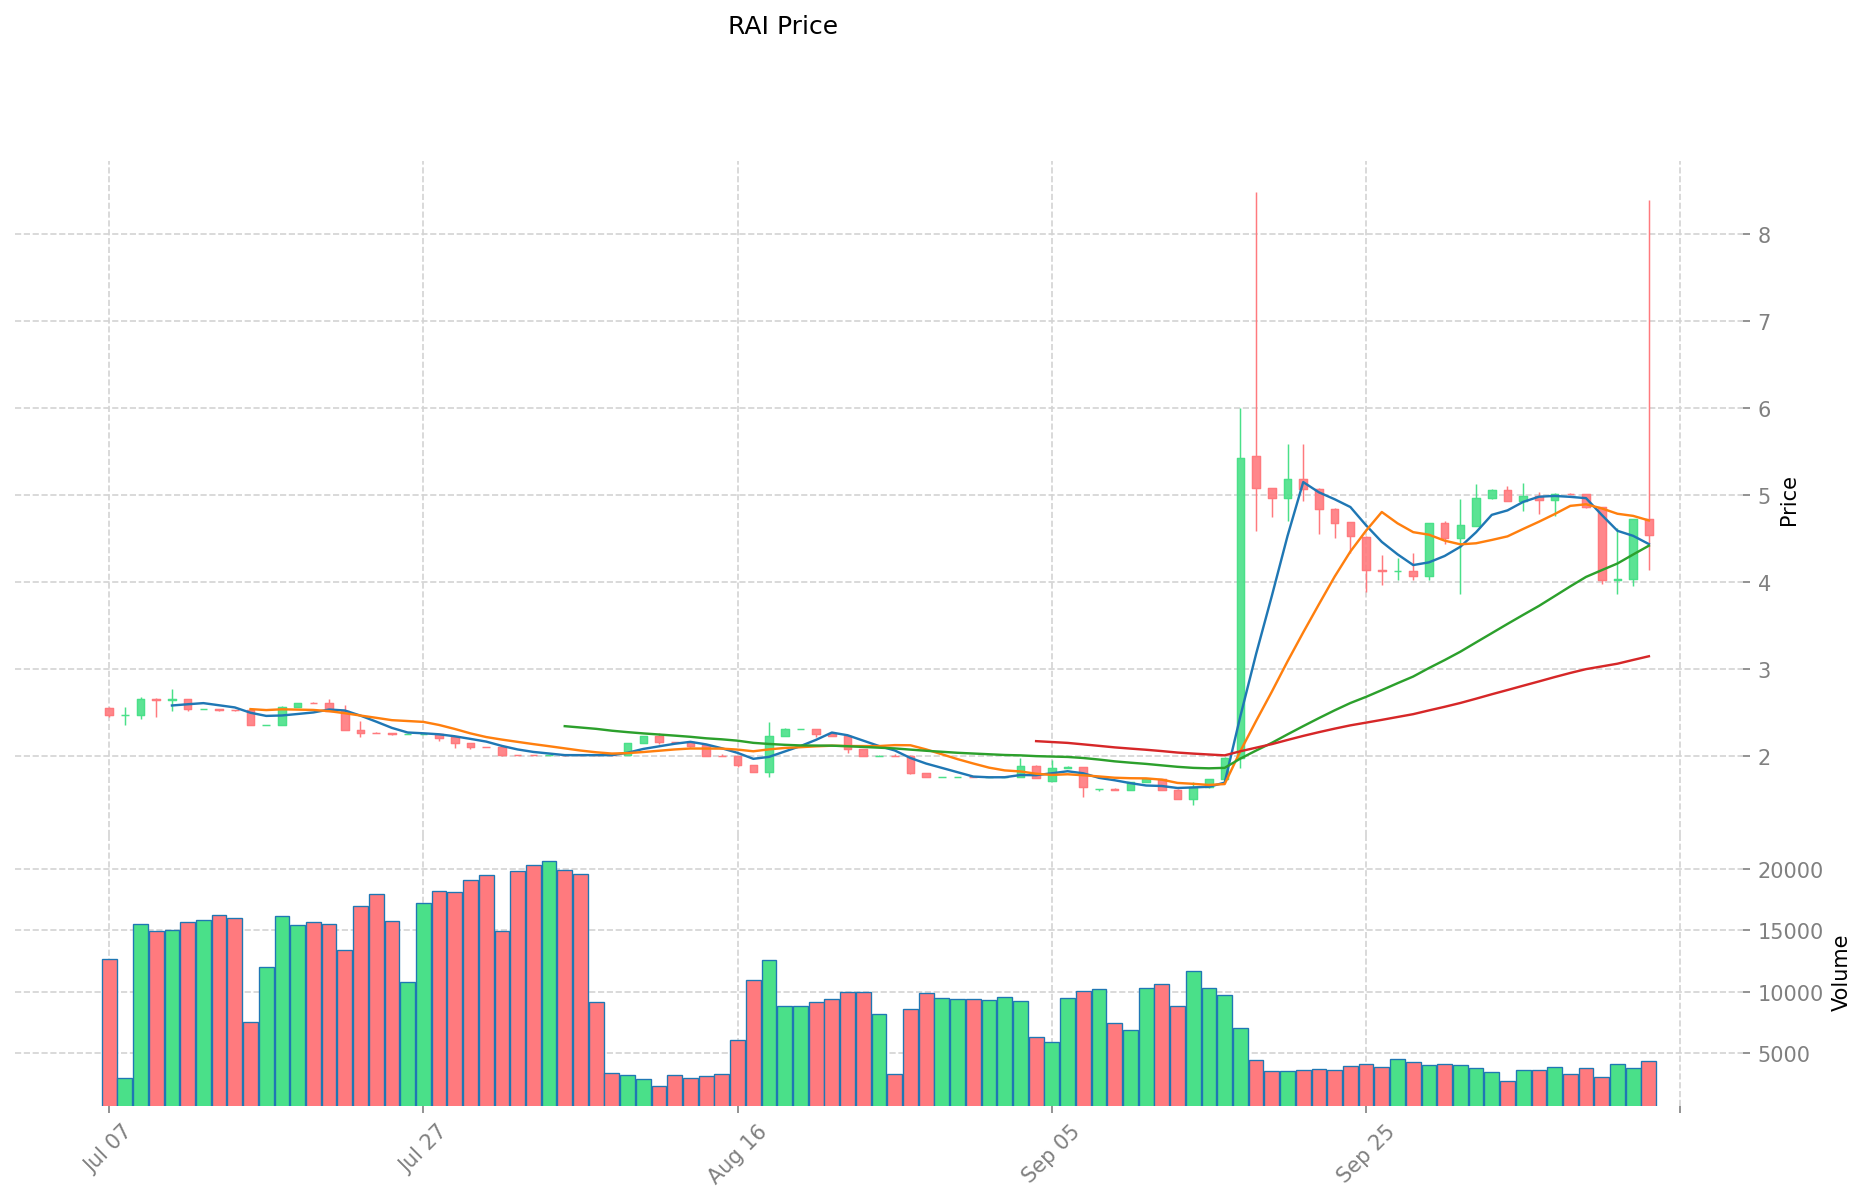
- 2023: RAI reached its all-time low of $2.44 on October 8, 2023.
- 2025: RAI achieved its all-time high of $5.8 on August 25, 2025.
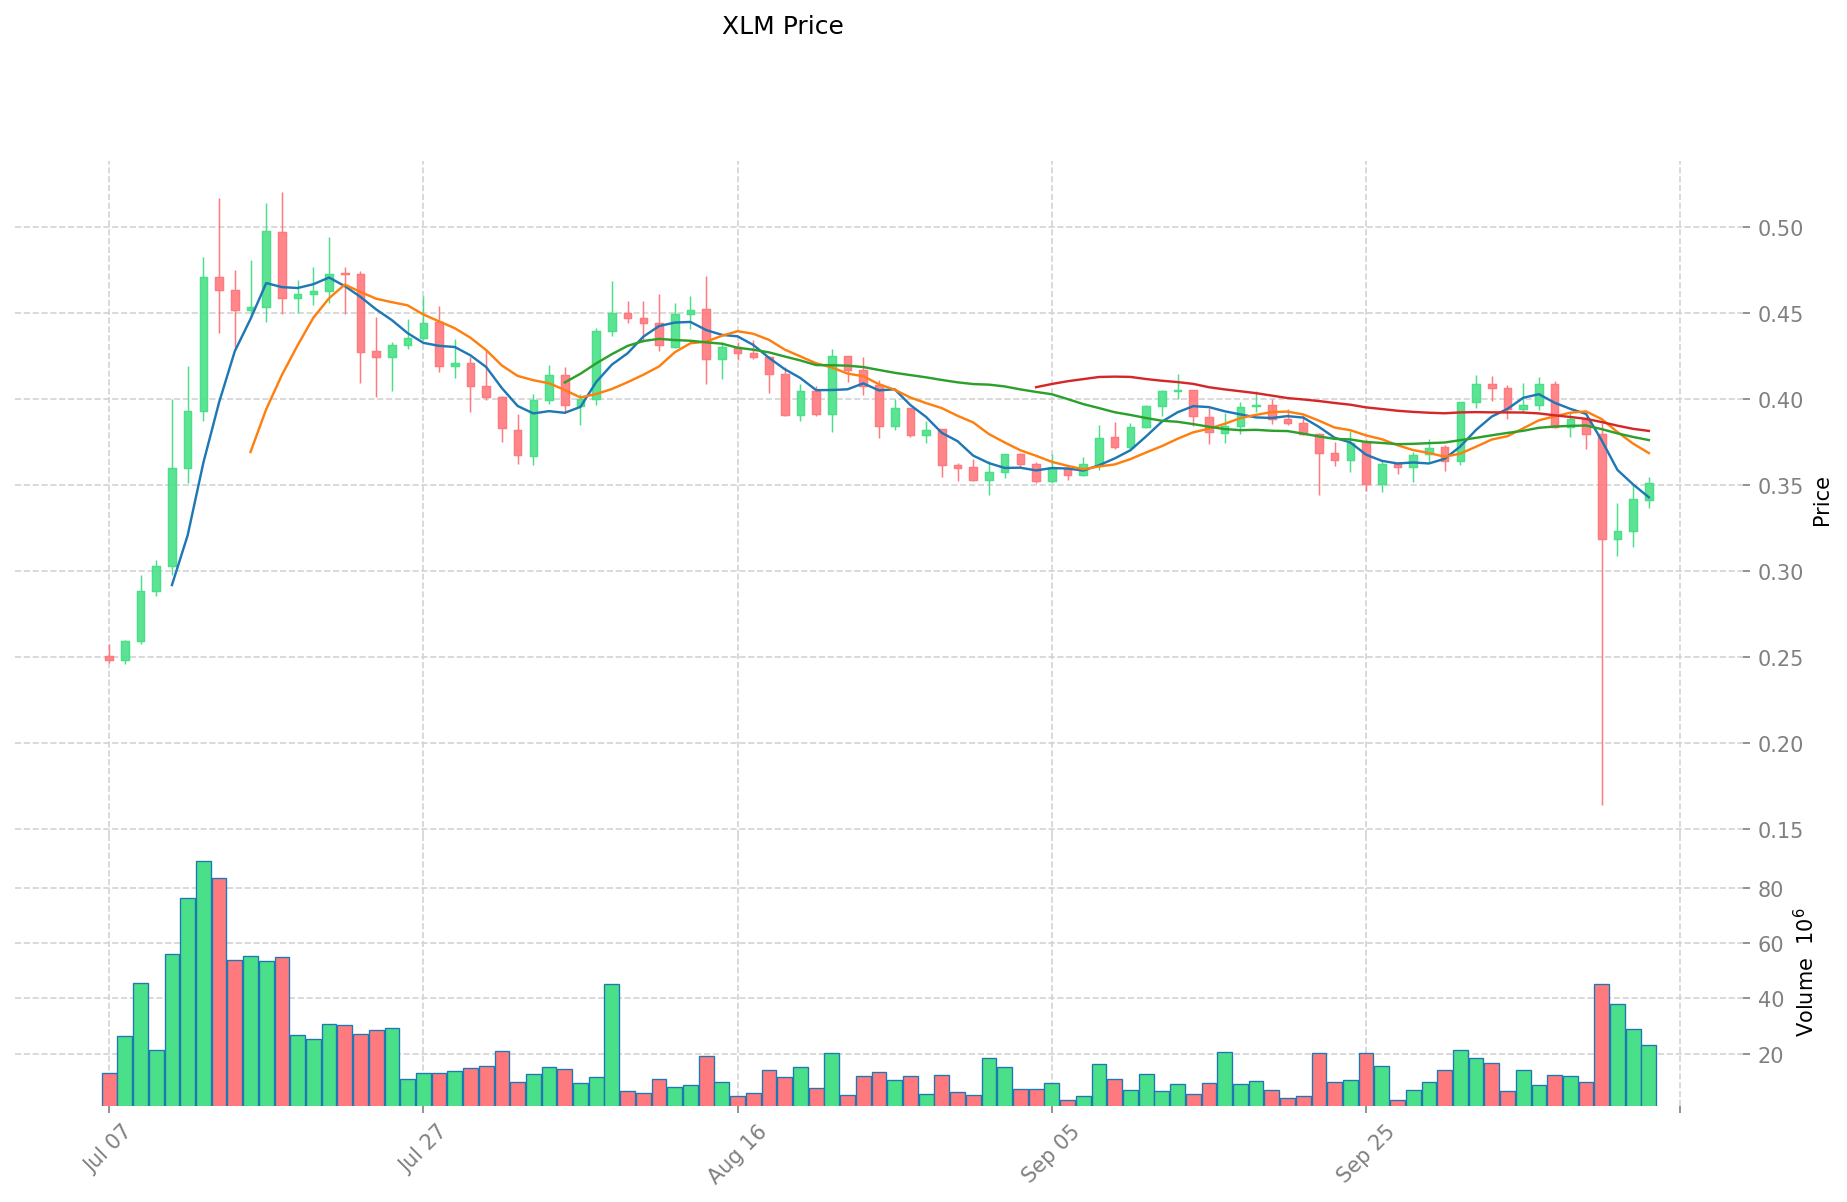
- 2018: XLM reached its all-time high of $0.875563 on January 3, 2018.
- 2015: XLM hit its all-time low of $0.00047612 on March 5, 2015.
- Comparative Analysis: Over the past year, RAI has seen a 50.38% increase, while XLM has experienced a significant 288.4% growth.
Current Market Situation (2025-10-14)
- RAI current price: $4.537
- XLM current price: $0.35115
- 24-hour trading volume: RAI $20,764.10203 vs XLM $7,892,892.3770812
- Market Sentiment Index (Fear & Greed Index): 38 (Fear)
Click to view real-time prices:
II. Core Factors Affecting RAI vs XLM Investment Value
Supply Mechanism Comparison (Tokenomics)
- RAI: Algorithmic stablecoin with reflexive index that maintains relative stability without being pegged to fiat currency, managed by autonomous feedback mechanisms
- XLM: Fixed total supply of 50 billion tokens with no further issuance, with approximately 26 billion XLM currently in circulation
- 📌 Historical Pattern: RAI's algorithmic stability mechanism aims to reduce volatility while XLM's fixed supply model creates potential scarcity value as adoption increases.
Institutional Adoption and Market Applications
- Institutional Holdings: XLM has gained more institutional traction through Stellar Development Foundation partnerships with financial institutions and payment providers
- Enterprise Adoption: XLM has stronger positioning in cross-border payments and remittances through the Stellar network, while RAI remains primarily within DeFi applications
- Regulatory Attitudes: XLM benefits from Stellar's compliance-focused approach and partnerships with regulated entities, while RAI operates in more experimental DeFi regulatory territory
Technical Development and Ecosystem Building
- RAI Technical Upgrades: Continuous improvement of stability mechanisms and integration with Ethereum DeFi protocols
- XLM Technical Development: Focus on scalability, low transaction costs, and interoperability features through the Stellar Consensus Protocol
- Ecosystem Comparison: XLM has broader adoption in payment systems and cross-border transfers, while RAI has deeper integration within Ethereum-based DeFi lending and borrowing platforms
Macroeconomic and Market Cycles
- Performance in Inflationary Environment: RAI designed specifically to maintain purchasing power regardless of fiat inflation, potentially offering stronger inflation resistance than XLM
- Macroeconomic Monetary Policy: Interest rate changes may impact XLM more directly through effects on cross-border payment volumes, while RAI's algorithmic design aims to minimize such external influences
- Geopolitical Factors: XLM benefits from increasing global demand for alternative cross-border payment rails, while RAI may gain from financial uncertainty driving demand for non-fiat-pegged stability
III. 2025-2030 Price Prediction: RAI vs XLM
Short-term Prediction (2025)
- RAI: Conservative $3.76 - $4.54 | Optimistic $4.54 - $5.22
- XLM: Conservative $0.32 - $0.35 | Optimistic $0.35 - $0.41
Mid-term Prediction (2027)
- RAI may enter a growth phase, with an estimated price range of $2.88 - $6.62
- XLM may enter a growth phase, with an estimated price range of $0.37 - $0.60
- Key drivers: Institutional capital inflow, ETF, ecosystem development
Long-term Prediction (2030)
- RAI: Base scenario $4.45 - $7.54 | Optimistic scenario $7.54 - $9.80
- XLM: Base scenario $0.36 - $0.58 | Optimistic scenario $0.58 - $0.81
View detailed price predictions for RAI and XLM
Disclaimer
RAI:
| 年份 |
预测最高价 |
预测平均价格 |
预测最低价 |
涨跌幅 |
| 2025 |
5.2164 |
4.536 |
3.76488 |
0 |
| 2026 |
5.071248 |
4.8762 |
4.047246 |
7 |
| 2027 |
6.61505292 |
4.973724 |
2.88475992 |
9 |
| 2028 |
6.7214906136 |
5.79438846 |
3.186913653 |
27 |
| 2029 |
8.823694746888 |
6.2579395368 |
5.256669210912 |
37 |
| 2030 |
9.8030622843972 |
7.540817141844 |
4.44908211368796 |
66 |
XLM:
| 年份 |
预测最高价 |
预测平均价格 |
预测最低价 |
涨跌幅 |
| 2025 |
0.408552 |
0.3522 |
0.31698 |
0 |
| 2026 |
0.42982488 |
0.380376 |
0.28147824 |
8 |
| 2027 |
0.5995486512 |
0.40510044 |
0.3726924048 |
15 |
| 2028 |
0.57767322744 |
0.5023245456 |
0.47720831832 |
42 |
| 2029 |
0.6155987306328 |
0.53999888652 |
0.3671992428336 |
53 |
| 2030 |
0.814696320092724 |
0.5777988085764 |
0.364013249403132 |
64 |
IV. Investment Strategy Comparison: RAI vs XLM
Long-term vs Short-term Investment Strategy
- RAI: Suitable for investors seeking stability and inflation resistance
- XLM: Suitable for investors focused on payment scenarios and ecosystem potential
Risk Management and Asset Allocation
- Conservative investors: RAI: 60% vs XLM: 40%
- Aggressive investors: RAI: 40% vs XLM: 60%
- Hedging tools: Stablecoin allocation, options, cross-currency portfolios
V. Potential Risk Comparison
Market Risk
- RAI: Potential volatility due to algorithmic nature and DeFi market fluctuations
- XLM: Susceptibility to broader cryptocurrency market trends and adoption rates
Technical Risk
- RAI: Smart contract vulnerabilities, algorithmic stability mechanism failures
- XLM: Network congestion, potential scalability issues
Regulatory Risk
- Global regulatory policies may impact both differently, with XLM potentially facing more scrutiny due to its focus on cross-border payments
VI. Conclusion: Which Is the Better Buy?
📌 Investment Value Summary:
- RAI advantages: Non-pegged stability, potential inflation hedge, DeFi integration
- XLM advantages: Established cross-border payment network, institutional partnerships, fixed supply
✅ Investment Advice:
- New investors: Consider a balanced approach with a slight bias towards XLM for its more established ecosystem
- Experienced investors: Explore opportunities in both, with RAI for DeFi exposure and XLM for payment network potential
- Institutional investors: Evaluate XLM for its regulatory compliance and cross-border payment applications, while considering RAI for portfolio diversification in the DeFi space
⚠️ Risk Warning: The cryptocurrency market is highly volatile. This article does not constitute investment advice.
None
VII. FAQ
Q1: What are the main differences between RAI and XLM?
A: RAI is an algorithmic stablecoin designed for stability without being pegged to fiat currency, while XLM is a cryptocurrency focused on cross-border payments and remittances. RAI is primarily used in DeFi applications, while XLM has broader adoption in payment systems.
Q2: Which cryptocurrency has shown better price performance recently?
A: Over the past year, XLM has experienced more significant growth, with a 288.4% increase compared to RAI's 50.38% increase.
Q3: How do the supply mechanisms of RAI and XLM differ?
A: RAI uses an algorithmic stability mechanism to maintain relative stability, while XLM has a fixed total supply of 50 billion tokens with no further issuance.
Q4: Which cryptocurrency is more suitable for long-term investment?
A: RAI may be more suitable for investors seeking stability and inflation resistance, while XLM might appeal to those focused on payment scenarios and ecosystem potential.
Q5: What are the main risks associated with investing in RAI and XLM?
A: RAI faces risks related to smart contract vulnerabilities and DeFi market fluctuations, while XLM is susceptible to broader cryptocurrency market trends and potential regulatory scrutiny due to its focus on cross-border payments.
Q6: How do institutional adoptions compare between RAI and XLM?
A: XLM has gained more institutional traction through Stellar Development Foundation partnerships with financial institutions and payment providers, while RAI remains primarily within DeFi applications.
Q7: What are the long-term price predictions for RAI and XLM by 2030?
A: By 2030, RAI is predicted to reach a base scenario of $4.45 - $7.54 and an optimistic scenario of $7.54 - $9.80. XLM is predicted to reach a base scenario of $0.36 - $0.58 and an optimistic scenario of $0.58 - $0.81.
* The information is not intended to be and does not constitute financial advice or any other recommendation of any sort offered or endorsed by Gate.


