This comprehensive comparison analyzes RBNT versus NEAR as blockchain investment opportunities, examining two distinct platforms with different maturity levels and use cases. RBNT, launched in December 2024, is a formally verified blockchain focused on asset tokenization developed by University of Sydney and CSIRO. NEAR, operational since 2020, functions as an established Layer 1 protocol for scalable decentralized application development. The article evaluates both through multiple dimensions including historical price performance, trading volumes, technical architecture, and institutional adoption. Current market data shows RBNT at $0.005886 with limited $22,282.96 daily volume, while NEAR trades at $1.4966 with $2.21M volume. The analysis provides allocation strategies for different investor profiles, price projections through 2031, and comprehensive risk assessments. Investment recommendations favor NEAR for conservative investors prioritizing liquidity and track record, while experienced investors may al
Introduction: Investment Comparison Between RBNT and NEAR
In the cryptocurrency market, the comparison between RBNT vs NEAR continues to be a key topic for investors. Both demonstrate notable differences in market cap ranking, application scenarios, and price performance, representing distinct positioning within the crypto asset landscape.
RBNT (Redbelly Network Token): Launched in 2024, this formally verified blockchain developed at the University of Sydney in collaboration with CSIRO has positioned itself around asset tokenization and digital registry solutions for financial products.
NEAR (NEAR Protocol): Since its 2020 launch, NEAR has established itself as a highly scalable Layer 1 protocol designed for decentralized application development, particularly focused on mobile DApp deployment and cross-platform usability.
This article will examine the investment value comparison of RBNT vs NEAR through multiple dimensions including historical price trends, supply mechanisms, institutional adoption, technical ecosystem, and future outlook, while attempting to address the question most relevant to investors:
"Which is the better buy right now?"
I. Price History Comparison and Market Status
RBNT (Coin A) and NEAR (Coin B) Historical Price Trends
- 2024: RBNT was listed on December 17, 2024, with an initial offering price of $0.19. Shortly after launch, the token experienced significant volatility, reaching an all-time high of $0.449 on December 29, 2024.
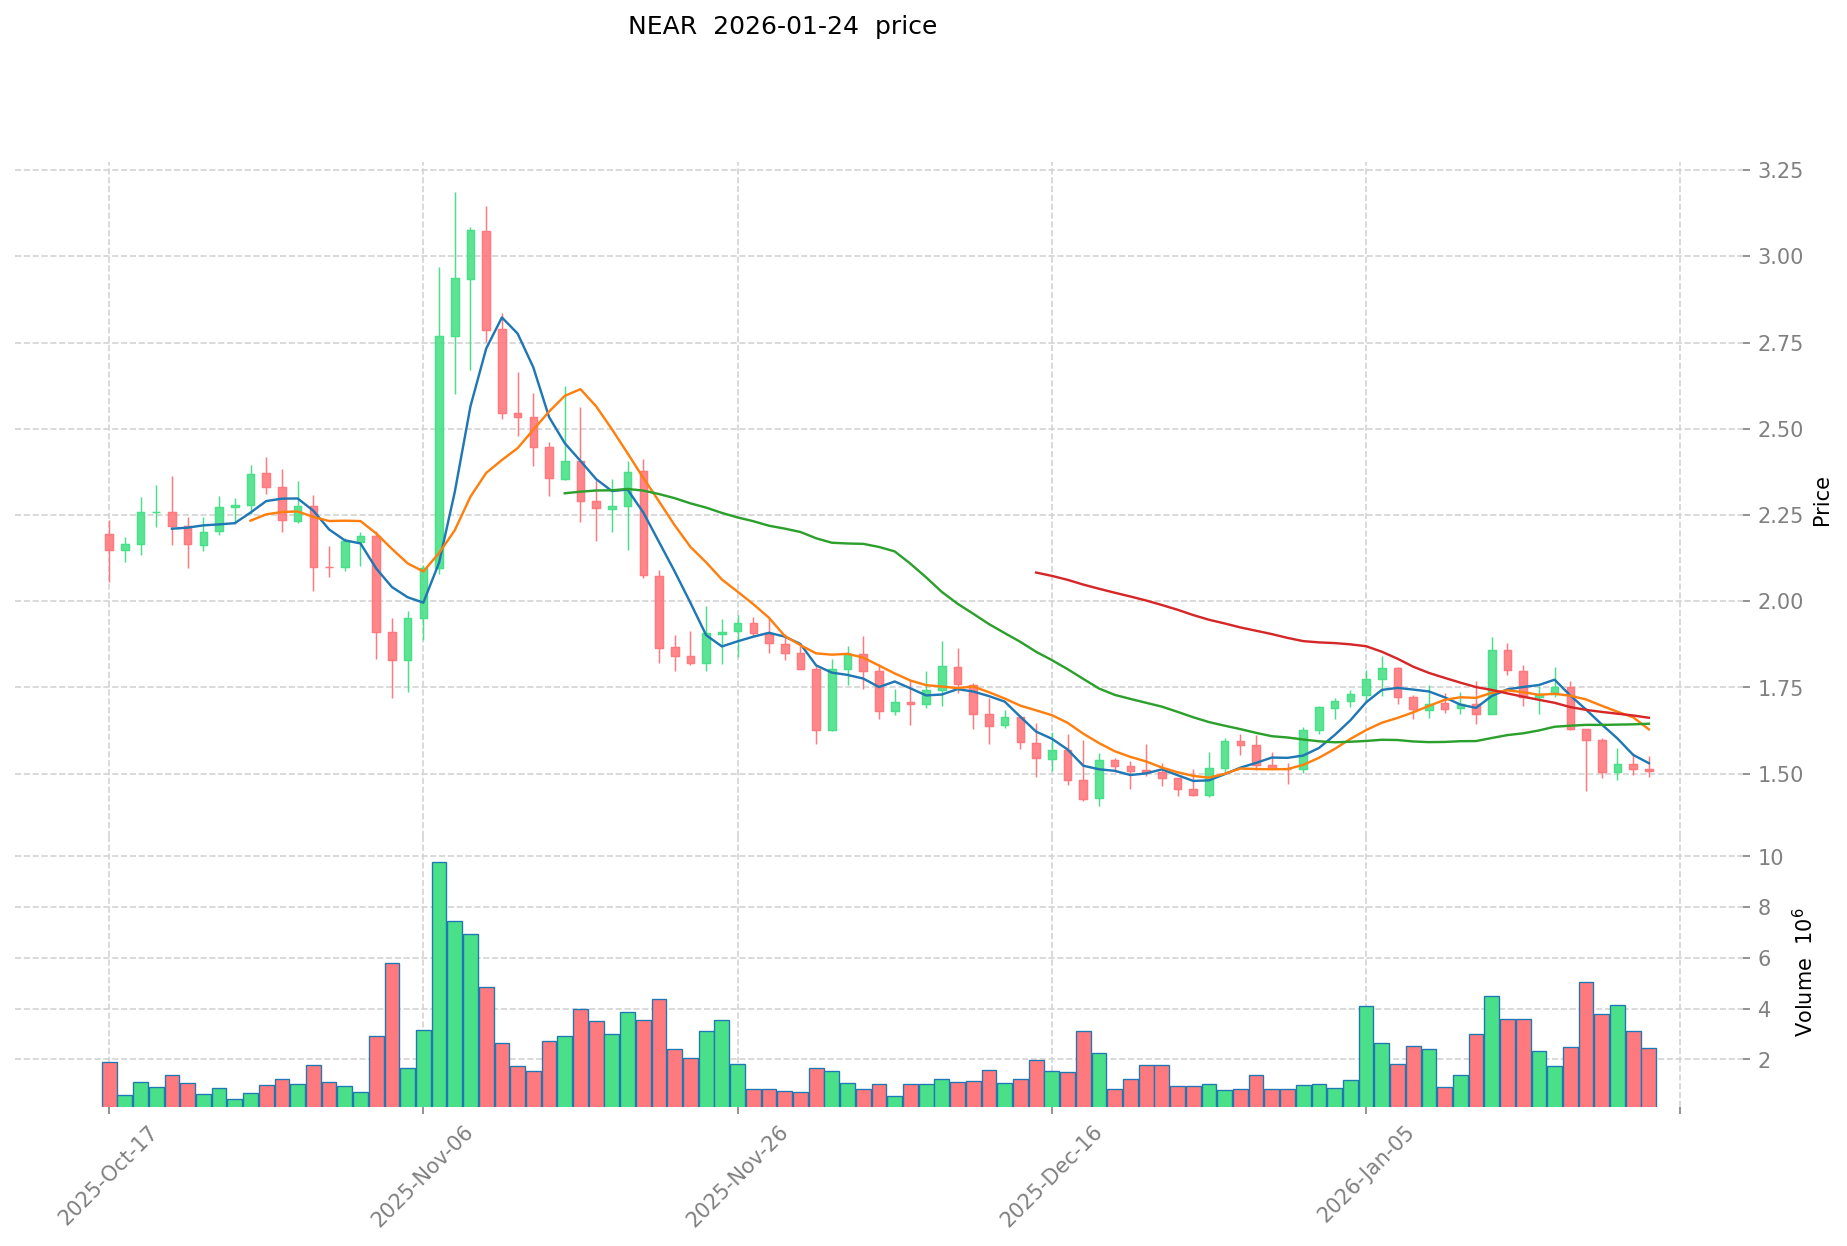
- 2022: NEAR reached its all-time high of $20.44 on January 17, 2022, during a period of broader market expansion. However, subsequent market corrections led to substantial price decline.
- 2020: NEAR recorded its all-time low of $0.526762 on November 5, 2020, in the early stages of its mainnet launch.
- Comparative Analysis: RBNT has experienced a sharp decline from its peak of $0.449 to a low of $0.00453 recorded on January 22, 2026, representing a decline of approximately 98.99%. In contrast, NEAR has declined from its peak of $20.44 to current levels around $1.4966, showing a decline of approximately 92.68% from its historical high.
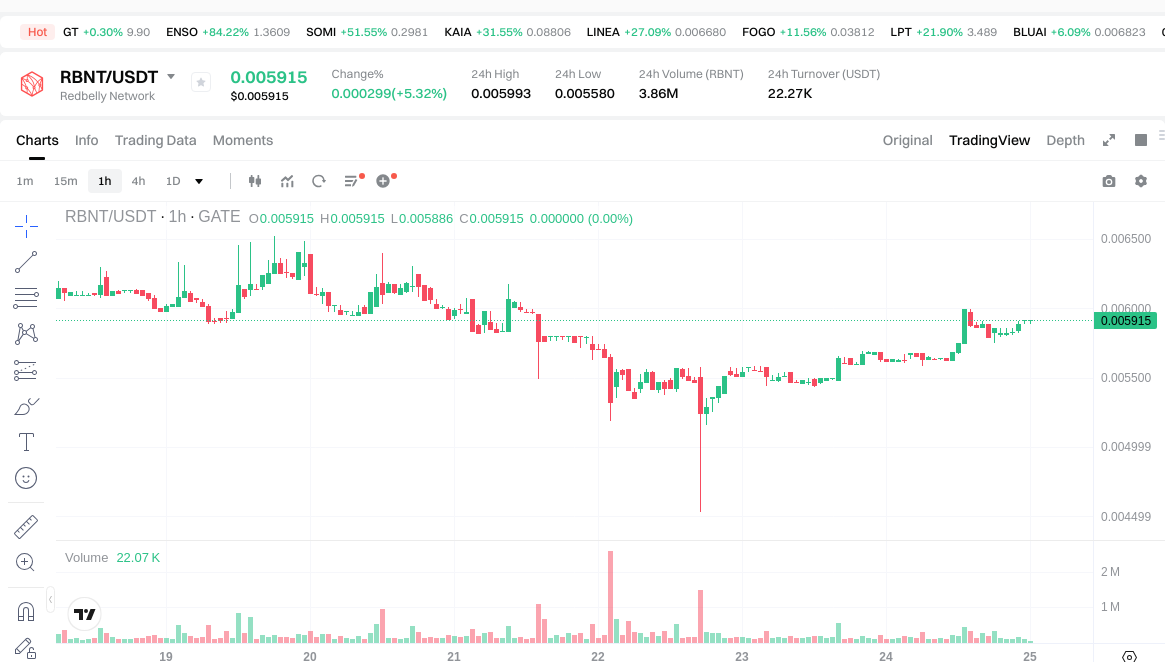
Current Market Status (January 25, 2026)
- RBNT Current Price: $0.005886
- NEAR Current Price: $1.4966
- 24-Hour Trading Volume: RBNT recorded $22,282.96 compared to NEAR's $2,211,655.12
- Market Sentiment Index (Fear & Greed Index): 25 (Extreme Fear)
View real-time prices:
II. Core Factors Affecting RBNT vs NEAR Investment Value
Supply Mechanism Comparison (Tokenomics)
Due to insufficient reference materials, detailed supply mechanism information for RBNT and NEAR cannot be provided at this time.
Institutional Adoption and Market Application
Institutional Holdings
Comprehensive data on institutional preference between RBNT and NEAR is not available in the provided materials.
Enterprise Adoption
Specific information regarding RBNT and NEAR adoption in cross-border payments, settlements, and investment portfolios is not included in the reference materials.
National Policies
Detailed regulatory attitudes from different countries toward RBNT and NEAR are not documented in the available sources.
Technical Development and Ecosystem Construction
RBNT Technical Upgrades
Information about RBNT's technical development and potential impact is not available in the provided materials.
NEAR Technical Development
Specific details about NEAR's technical advancements and their potential influence are not included in the reference sources.
Ecosystem Comparison
Comparative data on DeFi, NFT, payment solutions, and smart contract implementation for RBNT and NEAR is not available in the provided materials.
Macroeconomic Environment and Market Cycles
Analysis of anti-inflation characteristics for RBNT versus NEAR cannot be conducted based on the available reference materials.
Macroeconomic Monetary Policy
Specific information regarding the impact of interest rates and dollar index movements on RBNT and NEAR is not documented in the provided sources.
Geopolitical Factors
Data on cross-border transaction demand and international circumstances affecting RBNT and NEAR is not available in the reference materials.
III. 2026-2031 Price Projection: RBNT vs NEAR
Short-term Outlook (2026)
- RBNT: Conservative $0.0042-$0.0059 | Optimistic $0.0059-$0.0086
- NEAR: Conservative $0.82-$1.50 | Optimistic $1.50-$1.77
Medium-term Outlook (2028-2029)
- RBNT may enter a consolidation phase with projected price range of $0.0066-$0.0093
- NEAR may enter a growth phase with projected price range of $1.22-$2.43
- Key drivers: institutional capital inflows, ETF developments, ecosystem expansion
Long-term Outlook (2030-2031)
- RBNT: Baseline scenario $0.0055-$0.0087 | Optimistic scenario $0.0087-$0.010
- NEAR: Baseline scenario $1.95-$2.24 | Optimistic scenario $2.53-$3.28
View detailed price predictions for RBNT and NEAR
Disclaimer
RBNT:
| Year |
Predicted High Price |
Predicted Average Price |
Predicted Low Price |
Price Change |
| 2026 |
0.00857675 |
0.005915 |
0.00419965 |
0 |
| 2027 |
0.0079704625 |
0.007245875 |
0.00601407625 |
23 |
| 2028 |
0.0085972306875 |
0.00760816875 |
0.0066191068125 |
29 |
| 2029 |
0.009318104676562 |
0.00810269971875 |
0.007373456744062 |
37 |
| 2030 |
0.009407234373468 |
0.008710402197656 |
0.005487553384523 |
47 |
| 2031 |
0.009964700114118 |
0.009058818285562 |
0.00869646555414 |
53 |
NEAR:
| Year |
Predicted High Price |
Predicted Average Price |
Predicted Low Price |
Price Change |
| 2026 |
1.765752 |
1.4964 |
0.82302 |
0 |
| 2027 |
2.21826336 |
1.631076 |
1.28855004 |
8 |
| 2028 |
2.1941234352 |
1.92466968 |
1.7129560152 |
28 |
| 2029 |
2.430087937968 |
2.0593965576 |
1.215043968984 |
37 |
| 2030 |
2.80592780973 |
2.244742247784 |
1.95292575557208 |
49 |
| 2031 |
3.2829355373841 |
2.525335028757 |
2.17178812473102 |
68 |
IV. Investment Strategy Comparison: RBNT vs NEAR
Long-term vs Short-term Investment Strategies
- RBNT: May suit investors focused on early-stage blockchain infrastructure projects with asset tokenization applications, particularly those with higher risk tolerance for emerging protocols
- NEAR: May suit investors seeking exposure to established Layer 1 protocols with demonstrated ecosystem development and decentralized application deployment capabilities
Risk Management and Asset Allocation
- Conservative Investors: RBNT 10-15% vs NEAR 85-90%
- Aggressive Investors: RBNT 30-40% vs NEAR 60-70%
- Hedging Tools: stablecoin allocation, options strategies, cross-asset portfolio diversification
V. Potential Risk Comparison
Market Risk
- RBNT: Limited trading volume of $22,282.96 may present liquidity challenges; newly launched token with limited historical price data; significant volatility evidenced by 98.99% decline from peak
- NEAR: Higher trading volume of $2,211,655.12 provides better liquidity; established market presence since 2020; experienced 92.68% decline from historical high indicating substantial market risk exposure
Technical Risk
- RBNT: Early-stage blockchain platform with limited proven scalability at production level; network stability requires further observation
- NEAR: Established protocol architecture with operational history; ongoing requirements for technical maintenance and ecosystem security
Regulatory Risk
- Global regulatory developments may impact both assets differently based on their specific use cases, with asset tokenization platforms and Layer 1 protocols potentially subject to varying compliance frameworks across jurisdictions
VI. Conclusion: Which Is the Better Buy?
📌 Investment Value Summary:
- RBNT Advantages: Early-stage positioning in asset tokenization sector; formal verification approach; academic research foundation from University of Sydney collaboration
- NEAR Advantages: Established Layer 1 protocol with operational history since 2020; demonstrated ecosystem development; higher liquidity with substantially greater trading volume
✅ Investment Recommendations:
- Beginner Investors: Consider NEAR for its established market presence, higher liquidity, and longer operational track record; limit exposure to speculative early-stage assets
- Experienced Investors: May allocate modest position to RBNT as speculative holding while maintaining core position in NEAR; implement strict risk management protocols
- Institutional Investors: NEAR may align better with institutional risk parameters given liquidity profile and established ecosystem; RBNT requires additional due diligence given limited market history
⚠️ Risk Disclosure: Cryptocurrency markets demonstrate extreme volatility. This analysis does not constitute investment advice.
VII. FAQ
Q1: What are the main differences between RBNT and NEAR in terms of blockchain technology?
RBNT is a formally verified blockchain platform focused on asset tokenization and digital registry solutions, while NEAR is an established Layer 1 protocol designed for scalable decentralized application development. RBNT launched in 2024 as an early-stage project developed through collaboration between the University of Sydney and CSIRO, positioning itself primarily around financial product tokenization. In contrast, NEAR has been operational since 2020, offering a mature ecosystem with proven scalability for mobile DApp deployment and cross-platform usability. The fundamental distinction lies in their developmental maturity and primary use cases: RBNT targets specialized financial infrastructure while NEAR provides general-purpose blockchain functionality for diverse applications.
Q2: Which cryptocurrency shows better liquidity for trading purposes?
NEAR demonstrates significantly superior liquidity compared to RBNT. As of January 25, 2026, NEAR recorded a 24-hour trading volume of $2,211,655.12, while RBNT registered only $22,282.96 in the same period. This substantial difference—approximately 99 times greater volume for NEAR—indicates that NEAR offers substantially easier entry and exit positions with minimal price slippage. The limited trading volume of RBNT presents potential challenges for investors seeking to execute larger transactions without significantly impacting market prices, whereas NEAR's established market presence provides more reliable execution conditions for both retail and institutional participants.
Q3: How have RBNT and NEAR performed since their respective launches?
Both tokens have experienced significant declines from their all-time highs, though at different magnitudes and timeframes. RBNT reached its peak of $0.449 on December 29, 2024, shortly after its December 17, 2024 listing, but has since declined approximately 98.99% to $0.00453 recorded on January 22, 2026. NEAR achieved its all-time high of $20.44 on January 17, 2022, and has declined approximately 92.68% to current levels around $1.4966. While both assets have experienced substantial corrections, NEAR's performance reflects broader cryptocurrency market cycles over a four-year period, whereas RBNT's sharp decline occurred within approximately one year, suggesting different volatility profiles and market dynamics.
Q4: What allocation strategy should investors consider for RBNT vs NEAR?
Investment allocation should align with individual risk tolerance and investment objectives. Conservative investors may consider allocating 10-15% to RBNT and 85-90% to NEAR, prioritizing the established protocol with proven liquidity and operational history. Aggressive investors with higher risk tolerance might allocate 30-40% to RBNT and 60-70% to NEAR, accepting greater exposure to the early-stage project's potential upside while maintaining substantial position in the more established asset. Beginner investors should prioritize NEAR given its superior liquidity, longer operational track record, and established ecosystem, while limiting or avoiding exposure to highly speculative early-stage assets like RBNT until gaining more market experience.
Q5: What are the projected price ranges for RBNT and NEAR through 2031?
Price projections indicate different trajectories for both assets across various timeframes. For 2026, RBNT shows conservative projections of $0.0042-$0.0059 and optimistic projections of $0.0059-$0.0086, while NEAR projects conservative range of $0.82-$1.50 and optimistic range of $1.50-$1.77. By 2031, RBNT's baseline scenario suggests $0.0055-$0.0087 with optimistic scenario reaching $0.0087-$0.010, whereas NEAR's baseline scenario indicates $1.95-$2.24 with optimistic scenario extending to $2.53-$3.28. These projections assume various factors including institutional capital inflows, ETF developments, and ecosystem expansion, though actual performance may vary significantly based on market conditions and project execution.
Q6: What are the primary risks associated with investing in RBNT compared to NEAR?
RBNT presents several heightened risk factors compared to NEAR. Market risk for RBNT includes extremely limited liquidity with only $22,282.96 in 24-hour trading volume, newly launched status with minimal historical price data, and demonstrated extreme volatility with a 98.99% decline from peak. Technical risks involve early-stage platform development with limited proven scalability at production level and network stability requiring further observation. NEAR, while also subject to market risks including its own 92.68% decline from historical high, benefits from substantially higher liquidity of $2,211,655.12, established operational history since 2020, and proven protocol architecture. Both assets face regulatory uncertainty, though potentially different compliance frameworks may apply based on their distinct use cases in asset tokenization versus general-purpose blockchain applications.
Q7: Which cryptocurrency is better suited for institutional investors?
NEAR appears better aligned with institutional investment parameters compared to RBNT. The substantially higher trading volume of $2,211,655.12 versus RBNT's $22,282.96 provides institutional-grade liquidity necessary for executing larger positions without excessive market impact. NEAR's operational history since 2020 offers established track record for due diligence purposes, while its demonstrated ecosystem development provides tangible metrics for investment evaluation. RBNT, despite its academic research foundation and formal verification approach, requires additional comprehensive due diligence given its limited market history since December 2024 launch and extremely low liquidity profile. Institutional investors typically prioritize established projects with proven operational metrics, regulatory clarity, and sufficient market depth—characteristics currently better demonstrated by NEAR than the early-stage RBNT protocol.
Q8: What role does the current market sentiment play in evaluating RBNT vs NEAR investment decisions?
The current market sentiment, reflected by a Fear & Greed Index of 25 indicating "Extreme Fear," significantly impacts investment considerations for both RBNT and NEAR. During periods of extreme fear, cryptocurrency markets typically experience heightened volatility, reduced liquidity, and risk-averse investor behavior that disproportionately affects smaller-cap and newly launched assets like RBNT. NEAR's established market presence and higher liquidity may provide relatively better resilience during such conditions, though both assets remain vulnerable to broader market sentiment shifts. Investors should recognize that extreme fear conditions historically present both heightened risks and potential long-term accumulation opportunities, though timing market sentiment remains inherently challenging. The extreme fear reading suggests careful position sizing, enhanced risk management protocols, and avoiding overleveraged positions regardless of which asset is selected for investment allocation.
* The information is not intended to be and does not constitute financial advice or any other recommendation of any sort offered or endorsed by Gate.