This comprehensive guide compares RDNT and CRO, two leading DeFi tokens, across price performance, market liquidity, and investment potential through 2031. RDNT, an omnichain money market on LayerZero, currently trades at $0.008216 with limited liquidity of $22,304.72 daily volume, appealing to risk-tolerant investors seeking cross-chain lending exposure. CRO, the Cronos ecosystem token backed by Crypto.com's 100+ million users, trades at $0.08771 with superior liquidity at $858,966.47 daily volume, suiting conservative investors. Price forecasts through 2031 suggest CRO reaching $0.137-$0.203 in optimistic scenarios while RDNT targets $0.0123-$0.0164. The article analyzes tokenomics, institutional adoption, technical risks, and regulatory considerations to help investors determine optimal allocation strategies on Gate.
Introduction: Investment Comparison Between RDNT and CRO
In the cryptocurrency market, the comparison between RDNT vs CRO has become an ongoing topic among investors. Both assets differ significantly in market cap ranking, application scenarios, and price performance, representing distinct positioning within the crypto ecosystem.
Radiant (RDNT): Since its emergence, it has positioned itself as the first omnichain money market built on LayerZero, enabling users to deposit major assets on any primary chain and borrow various supported assets across multiple chains.
Cronos (CRO): Since its launch in 2018, it has been recognized as a leading blockchain ecosystem partnering with Crypto.com and over 500 application developers, representing an addressable user base of more than 100 million people globally, with a focus on Decentralized Finance and Gaming.
This article will comprehensively analyze the investment value comparison between RDNT vs CRO through historical price trends, supply mechanisms, institutional adoption, technological ecosystems, and future forecasts, attempting to answer the question investors care most about:
"Which is the better buy right now?"
I. Historical Price Comparison and Current Market Status
Historical Price Trends of RDNT (Coin A) and CRO (Coin B)
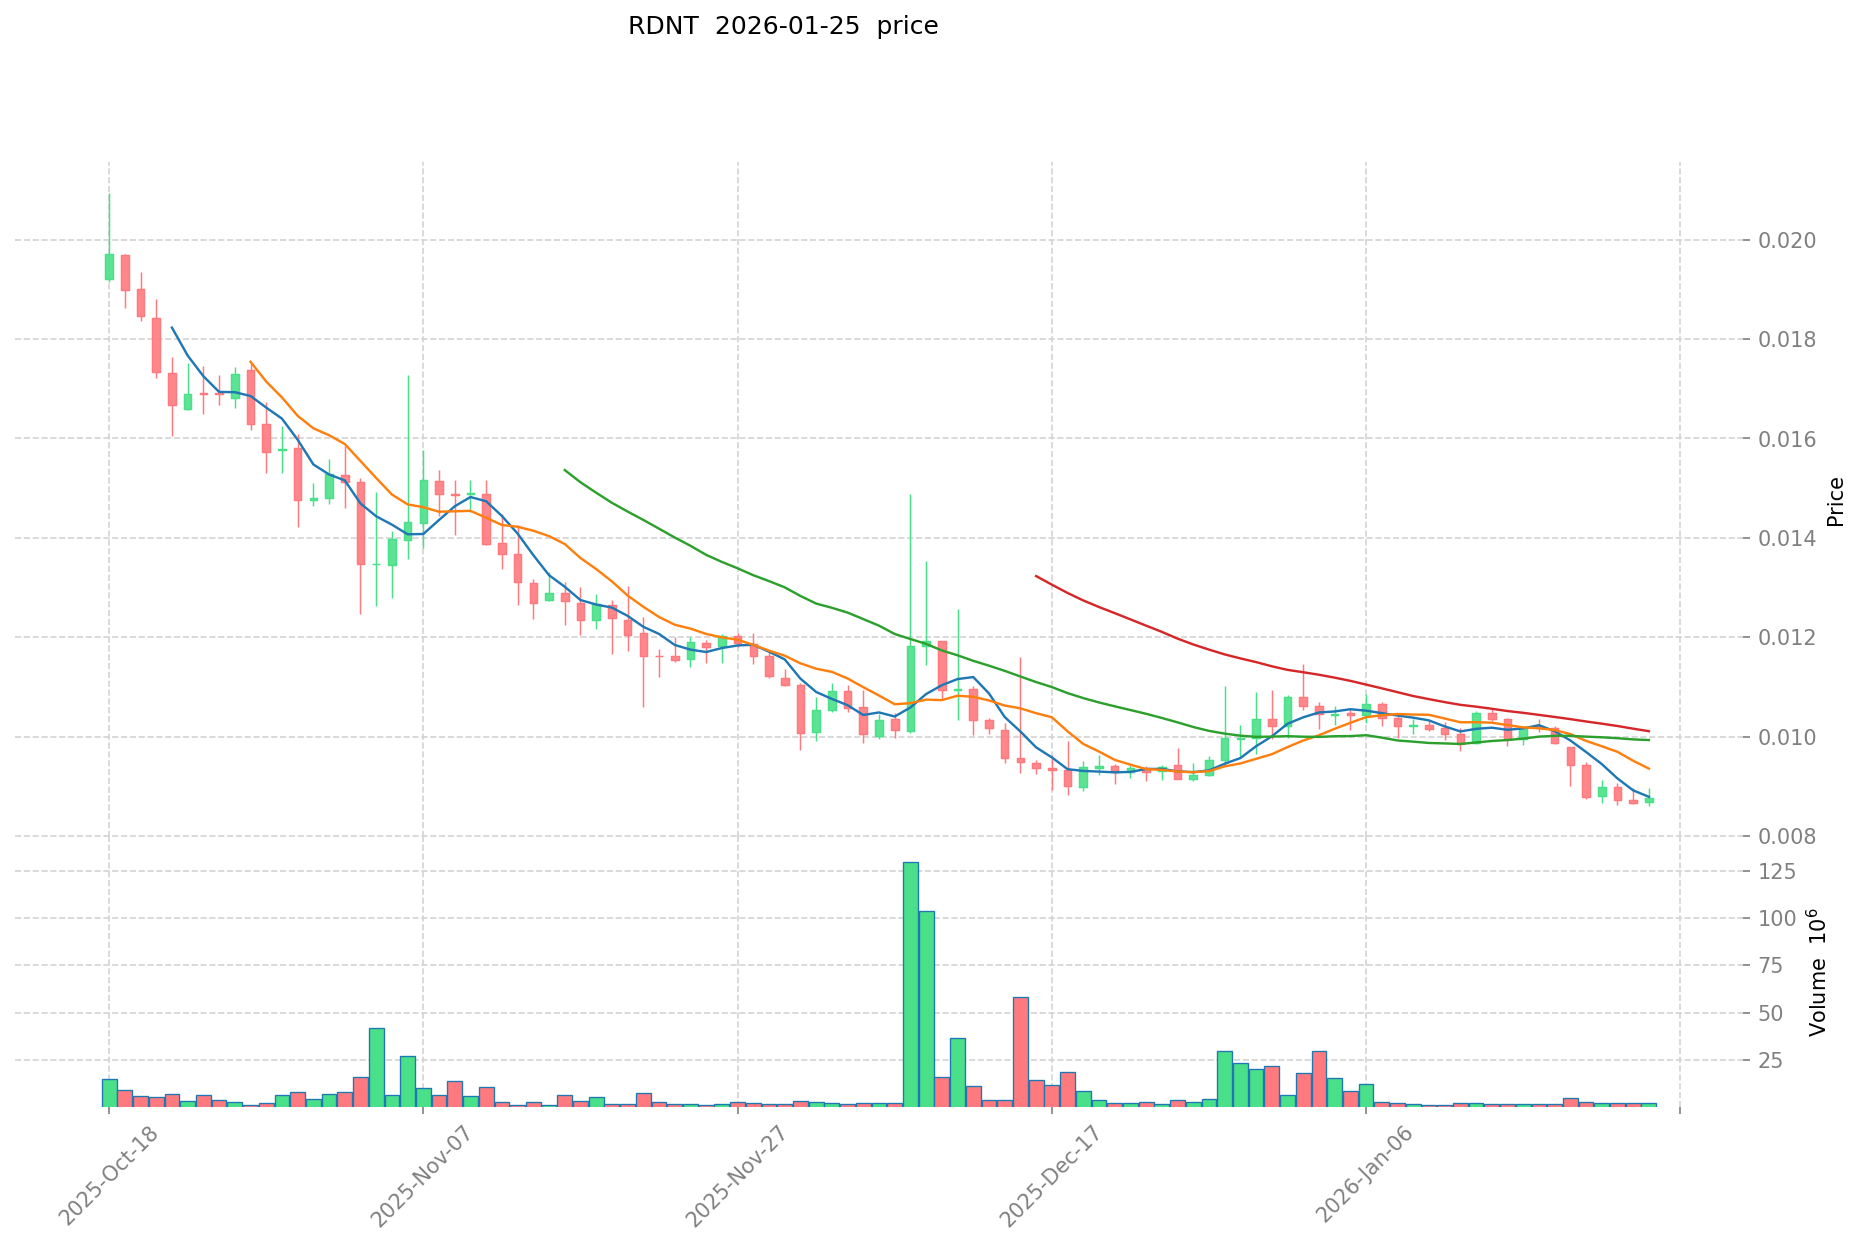
- 2022: RDNT reached a peak price during the early expansion phase of the LayerZero-based omnichain lending protocol, with the price climbing to approximately $0.585 in September 2022.
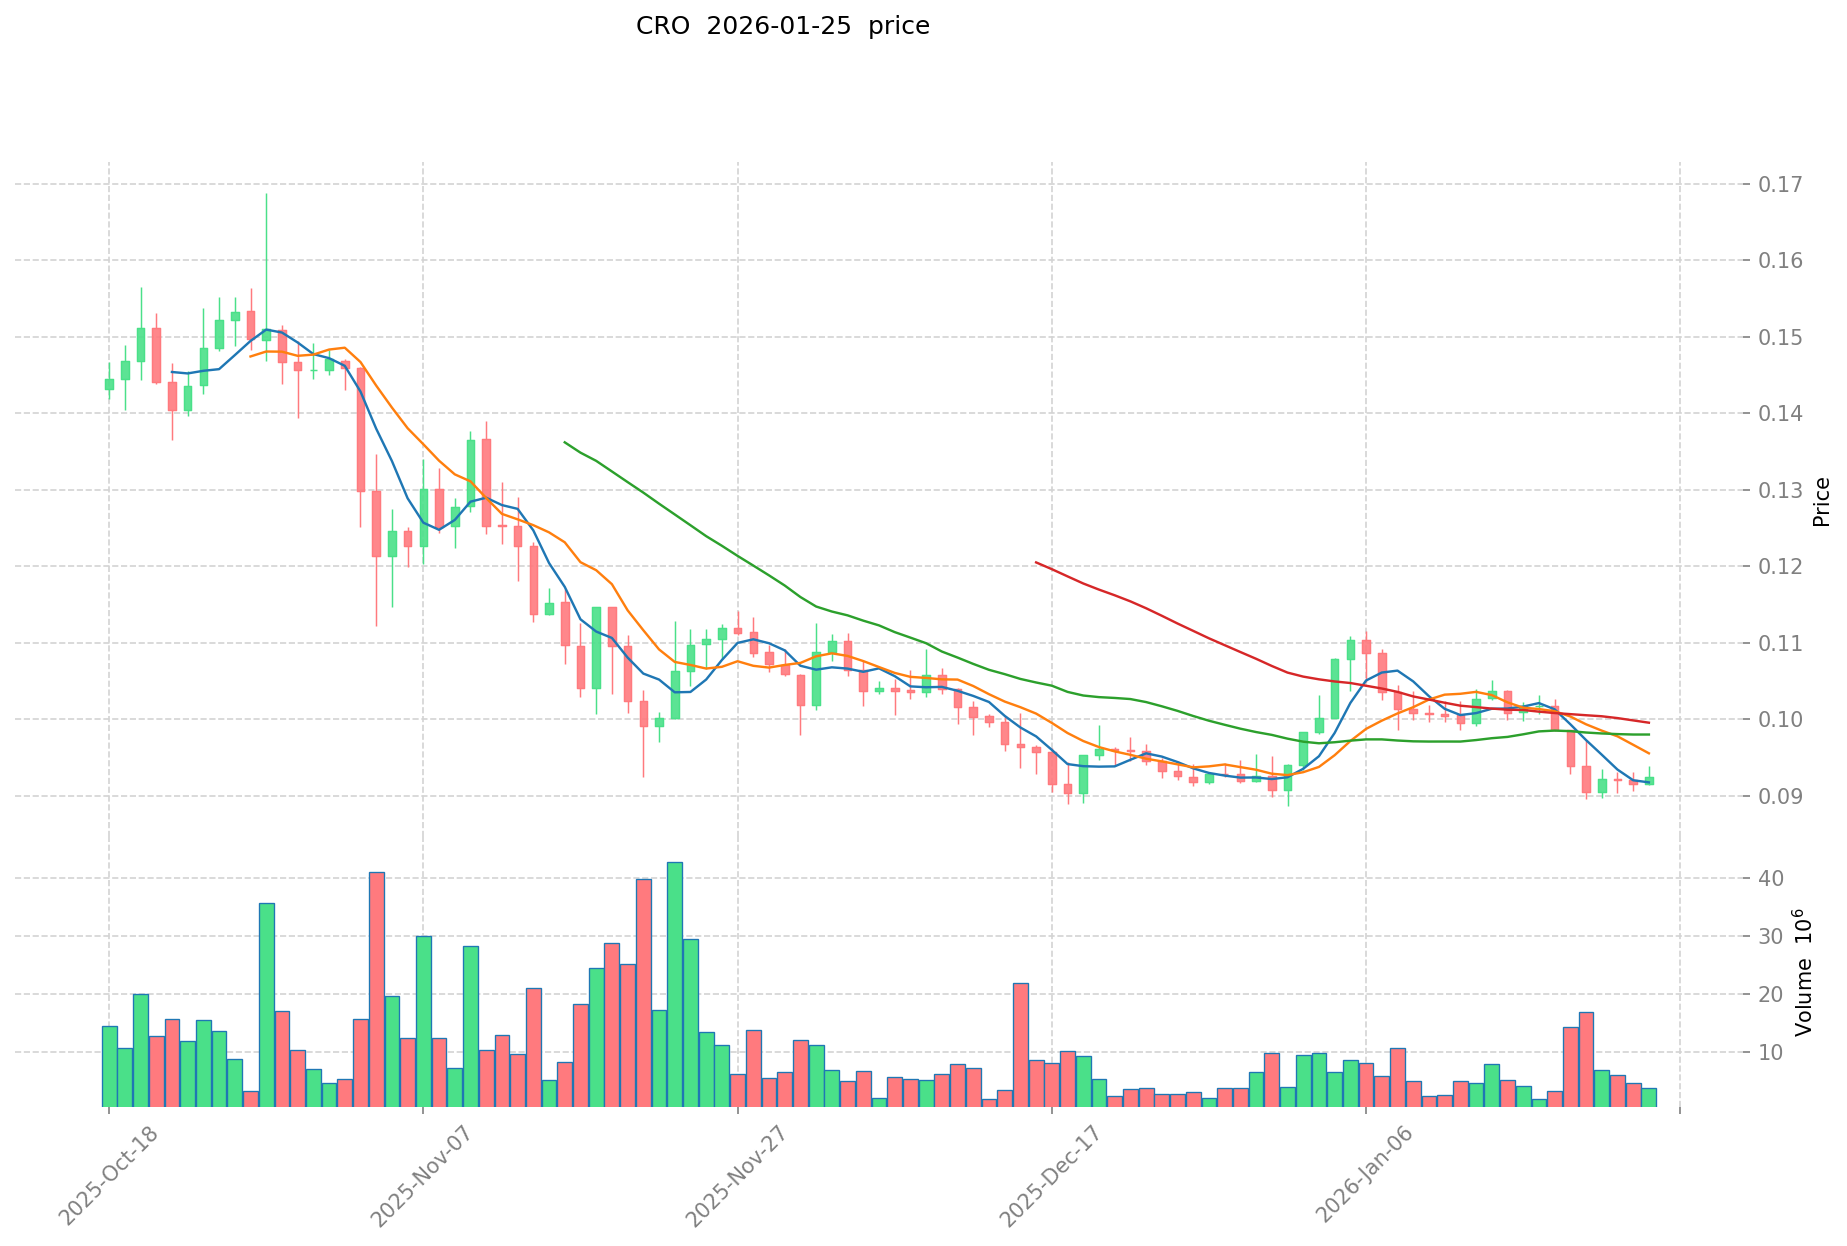
- 2021: CRO experienced significant growth driven by Crypto.com's ecosystem expansion and strategic partnerships, reaching an all-time high of approximately $0.965 in November 2021.
- Comparative Analysis: Throughout recent market cycles, RDNT has declined from its peak of $0.585268 (September 2022) to current levels near $0.008216, while CRO has decreased from its high of $0.965407 (November 2021) to approximately $0.08771.
Current Market Status (January 26, 2026)
- RDNT Current Price: $0.008216
- CRO Current Price: $0.08771
- 24-Hour Trading Volume: RDNT at $22,304.72 vs CRO at $858,966.47
- Market Sentiment Index (Fear & Greed Index): 25 (Extreme Fear)
View real-time prices:
II. Core Factors Influencing RDNT vs CRO Investment Value
Supply Mechanism Comparison (Tokenomics)
Due to the absence of detailed supply mechanism information in the provided materials, a comprehensive comparison of RDNT and CRO tokenomics cannot be presented at this time. Supply mechanisms, including issuance schedules, burn mechanisms, and circulation models, typically play significant roles in long-term price dynamics.
Institutional Adoption and Market Applications
Without specific data on institutional holdings, enterprise adoption patterns, or regulatory stances across different jurisdictions for RDNT and CRO, this section cannot provide a substantive comparison. Institutional interest and real-world application scenarios remain important considerations for evaluating digital assets.
Technology Development and Ecosystem Building
The provided materials do not contain information regarding recent technical upgrades, protocol improvements, or ecosystem developments for either RDNT or CRO. Technology roadmaps and ecosystem expansion across DeFi, NFT, payment solutions, and smart contract implementations would typically inform this analysis.
Macroeconomic Environment and Market Cycles
Without reference data on historical performance during various macroeconomic conditions, comparative analysis of RDNT and CRO under inflationary environments, monetary policy shifts, interest rate fluctuations, or geopolitical events cannot be established. These macro factors generally influence digital asset valuations through investor risk appetite and cross-border transaction demand.
III. 2026-2031 Price Forecast: RDNT vs CRO
Short-term Forecast (2026)
- RDNT: Conservative $0.0070-$0.0082 | Optimistic $0.0082-$0.0090
- CRO: Conservative $0.069-$0.088 | Optimistic $0.088-$0.102
Mid-term Forecast (2028-2029)
- RDNT may enter a gradual growth phase, with projected prices ranging from $0.0073 to $0.0119
- CRO may enter a consolidation and expansion phase, with projected prices ranging from $0.075 to $0.149
- Key drivers: institutional capital flows, ETF developments, ecosystem expansion
Long-term Forecast (2030-2031)
- RDNT: Baseline scenario $0.0068-$0.0110 | Optimistic scenario $0.0123-$0.0164
- CRO: Baseline scenario $0.096-$0.132 | Optimistic scenario $0.137-$0.203
View detailed price predictions for RDNT and CRO
Disclaimer
RDNT:
| Year |
Predicted High Price |
Predicted Average Price |
Predicted Low Price |
Price Change |
| 2026 |
0.00895326 |
0.008214 |
0.0069819 |
0 |
| 2027 |
0.009441993 |
0.00858363 |
0.0070385766 |
4 |
| 2028 |
0.011085758145 |
0.0090128115 |
0.007300377315 |
9 |
| 2029 |
0.01185815609055 |
0.0100492848225 |
0.008943863492025 |
22 |
| 2030 |
0.013692150570656 |
0.010953720456525 |
0.008324827546959 |
33 |
| 2031 |
0.016389504233075 |
0.01232293551359 |
0.006777614532474 |
49 |
CRO:
| Year |
Predicted High Price |
Predicted Average Price |
Predicted Low Price |
Price Change |
| 2026 |
0.1021728 |
0.08808 |
0.0687024 |
0 |
| 2027 |
0.100833984 |
0.0951264 |
0.048514464 |
8 |
| 2028 |
0.13325306112 |
0.097980192 |
0.08230336128 |
11 |
| 2029 |
0.1491454482624 |
0.11561662656 |
0.075150807264 |
31 |
| 2030 |
0.141647710029984 |
0.1323810374112 |
0.096638157310176 |
50 |
| 2031 |
0.202781273106476 |
0.137014373720592 |
0.095910061604414 |
56 |
IV. Investment Strategy Comparison: RDNT vs CRO
Long-term vs Short-term Investment Strategies
- RDNT: May appeal to investors focused on omnichain lending infrastructure and cross-chain interoperability developments within the DeFi sector, with expectations tied to LayerZero ecosystem expansion
- CRO: May suit investors interested in established blockchain ecosystems with connections to centralized exchange platforms and diverse application developer networks spanning DeFi and gaming sectors
Risk Management and Asset Allocation
- Conservative Investors: RDNT 20-30% vs CRO 70-80%
- Aggressive Investors: RDNT 40-50% vs CRO 50-60%
- Hedging Tools: stablecoin allocations, options instruments, cross-asset portfolio diversification
V. Potential Risk Comparison
Market Risk
- RDNT: Exposure to lower liquidity conditions with 24-hour trading volume at $22,304.72, alongside volatility associated with emerging omnichain protocols and current extreme fear market sentiment (Fear & Greed Index: 25)
- CRO: Subject to market fluctuations influenced by broader cryptocurrency cycles and ecosystem performance metrics, with relatively higher trading volume at $858,966.47 indicating comparatively improved liquidity conditions
Technical Risk
- RDNT: Scalability considerations related to cross-chain architecture, network stability across multiple blockchain integrations
- CRO: Network capacity management across partnered applications, potential security vulnerabilities within ecosystem infrastructure
Regulatory Risk
- Global regulatory developments may affect both assets differently based on their respective use cases, with decentralized lending protocols and centralized exchange-associated blockchain networks potentially facing distinct compliance requirements across jurisdictions
VI. Conclusion: Which Is the Better Buy?
📌 Investment Value Summary:
- RDNT Advantages: Positioning within omnichain money market innovation, cross-chain asset borrowing functionality, LayerZero infrastructure integration
- CRO Advantages: Established ecosystem with over 500 application developers, connection to significant user base through Crypto.com partnership, diversified presence across DeFi and gaming sectors
✅ Investment Recommendations:
- Novice Investors: Consider prioritizing CRO for exposure to more established ecosystem infrastructure with higher trading volumes, while limiting RDNT allocation to smaller exploratory positions given current liquidity conditions
- Experienced Investors: Evaluate portfolio positioning based on cross-chain DeFi thesis (RDNT) versus established ecosystem growth potential (CRO), with attention to risk-adjusted returns and correlation with broader market cycles
- Institutional Investors: Conduct comprehensive due diligence on both assets' regulatory standing, technical architecture sustainability, and alignment with institutional risk parameters before establishing positions
⚠️ Risk Disclosure: Cryptocurrency markets exhibit high volatility. This content does not constitute investment advice.
VII. FAQ
Q1: What are the main differences between RDNT and CRO in terms of their core functions?
RDNT is an omnichain money market protocol built on LayerZero that enables cross-chain lending and borrowing, while CRO serves as the native token of the Cronos blockchain ecosystem partnered with Crypto.com. RDNT focuses specifically on decentralized lending infrastructure allowing users to deposit assets on one chain and borrow on another, whereas CRO powers a broader ecosystem encompassing over 500 application developers across DeFi and gaming sectors, with an addressable user base exceeding 100 million people globally.
Q2: Which asset has better liquidity based on current market data?
CRO demonstrates significantly better liquidity with a 24-hour trading volume of $858,966.47 compared to RDNT's $22,304.72. This approximately 38-times difference in trading volume indicates that CRO offers substantially easier entry and exit opportunities for investors, lower slippage on trades, and generally more stable price discovery mechanisms. The higher liquidity also suggests broader market participation and institutional interest in CRO.
Q3: How do the price trajectories of RDNT and CRO compare historically?
RDNT reached its peak price of approximately $0.585 in September 2022 and has declined to current levels near $0.008216, representing a decrease of approximately 98.6%. CRO achieved its all-time high of approximately $0.965 in November 2021 and currently trades around $0.08771, representing a decline of approximately 90.9%. While both assets have experienced significant corrections from their peaks, CRO has demonstrated relatively better price retention and currently trades at a substantially higher absolute price point.
Q4: What are the projected price ranges for RDNT and CRO through 2031?
For RDNT, conservative projections estimate prices ranging from $0.0070-$0.0082 in 2026, potentially reaching $0.0068-$0.0110 by 2030, with optimistic scenarios projecting $0.0123-$0.0164 by 2031. For CRO, conservative estimates suggest $0.069-$0.088 in 2026, expanding to $0.096-$0.132 by 2030, with optimistic projections of $0.137-$0.203 by 2031. These forecasts indicate CRO maintains higher absolute price expectations while RDNT shows percentage growth potential from its current lower base.
Q5: Which asset is more suitable for conservative investors?
CRO appears more suitable for conservative investors based on several factors: established ecosystem with proven partnerships, significantly higher trading volume providing better liquidity, broader market adoption through Crypto.com's user base, and relatively better historical price retention. Conservative portfolio allocation models suggest 70-80% CRO versus 20-30% RDNT for risk-averse investors, reflecting CRO's more mature market position and reduced exposure to the extreme volatility associated with newer protocols.
Q6: What are the primary risks associated with investing in RDNT versus CRO?
RDNT faces liquidity risk due to low trading volumes, technical risks related to cross-chain architecture scalability and multi-blockchain integration stability, and market positioning risk as an emerging omnichain protocol. CRO confronts ecosystem concentration risk through its Crypto.com partnership dependency, network capacity challenges managing 500+ applications, and potential regulatory scrutiny given its association with a centralized exchange platform. Both assets face broader cryptocurrency market volatility and regulatory uncertainty across jurisdictions.
Q7: How does the current market sentiment affect investment decisions for these assets?
The current Fear & Greed Index reading of 25 (Extreme Fear) indicates heightened market pessimism that typically creates potential entry opportunities for long-term investors but suggests caution for short-term traders. In such conditions, CRO's higher liquidity and established ecosystem may provide relatively more stability, while RDNT's lower liquidity could amplify both downside risks and potential recovery gains. Experienced investors might consider this extreme fear environment as a potential accumulation phase, though risk management through proper position sizing remains essential.
Q8: What factors should institutional investors prioritize when choosing between RDNT and CRO?
Institutional investors should prioritize liquidity profiles (CRO's $858K daily volume versus RDNT's $22K), regulatory compliance status across operating jurisdictions, technical architecture sustainability and security audit histories, correlation with broader digital asset markets for portfolio diversification purposes, custody solution availability, and alignment with institutional risk parameters. The due diligence process should also examine governance mechanisms, tokenomics sustainability, ecosystem development roadmaps, and potential integration with existing institutional infrastructure before establishing positions in either asset.
* The information is not intended to be and does not constitute financial advice or any other recommendation of any sort offered or endorsed by Gate.