This comprehensive analysis compares RED and XTZ as two distinct cryptocurrency investment opportunities in the blockchain market. RED, launched in January 2025, positions itself as a rapidly growing oracle infrastructure provider specializing in Actively Validated Services with Restaking for yield-bearing assets including LRTs, LSTs, and stablecoins. XTZ, established since October 2017, operates as a self-amending blockchain platform with on-chain governance, demonstrating institutional adoption through partnerships with Ubisoft and Red Bull Racing Honda. The article evaluates both assets across historical price trends, supply mechanisms, institutional adoption, technical ecosystems, and forecasts through 2031, providing tailored investment strategies for conservative, aggressive, and institutional investors. Current market conditions show RED trading at $0.2512 with $18,014.76 daily volume, while XTZ trades at $0.6162 with $569,926.79 volume. Comprehensive risk analysis, macroeconomic considerations, and st
Introduction: Investment Comparison Between RED and XTZ
In the cryptocurrency market, the comparison between RED vs XTZ has been a topic that investors cannot ignore. The two differ significantly in market capitalization ranking, application scenarios, and price performance, representing different crypto asset positioning.
RedStone (RED): Launched in January 2025, it has gained market recognition with its positioning as the fastest-growing oracle and the only major player offering Actively Validated Services with Restaking. RedStone is also the oracle leader in the yield-bearing assets sector, covering LRTs, LSTs, and stablecoins like Ethena or Elixir.
Tezos (XTZ): Since its launch in October 2017, it has been regarded as a self-amending blockchain platform that simplifies formal verification through establishing a digital commonwealth, ranking among the established cryptocurrencies with broader market recognition.
This article will comprehensively analyze the investment value comparison between RED vs XTZ around historical price trends, supply mechanisms, institutional adoption, technological ecosystems, and future predictions, attempting to answer investors' most concerned question:
"Which is the better buy right now?"
I. Historical Price Comparison and Current Market Landscape
RedStone (RED) and Tezos (XTZ) Historical Price Movements
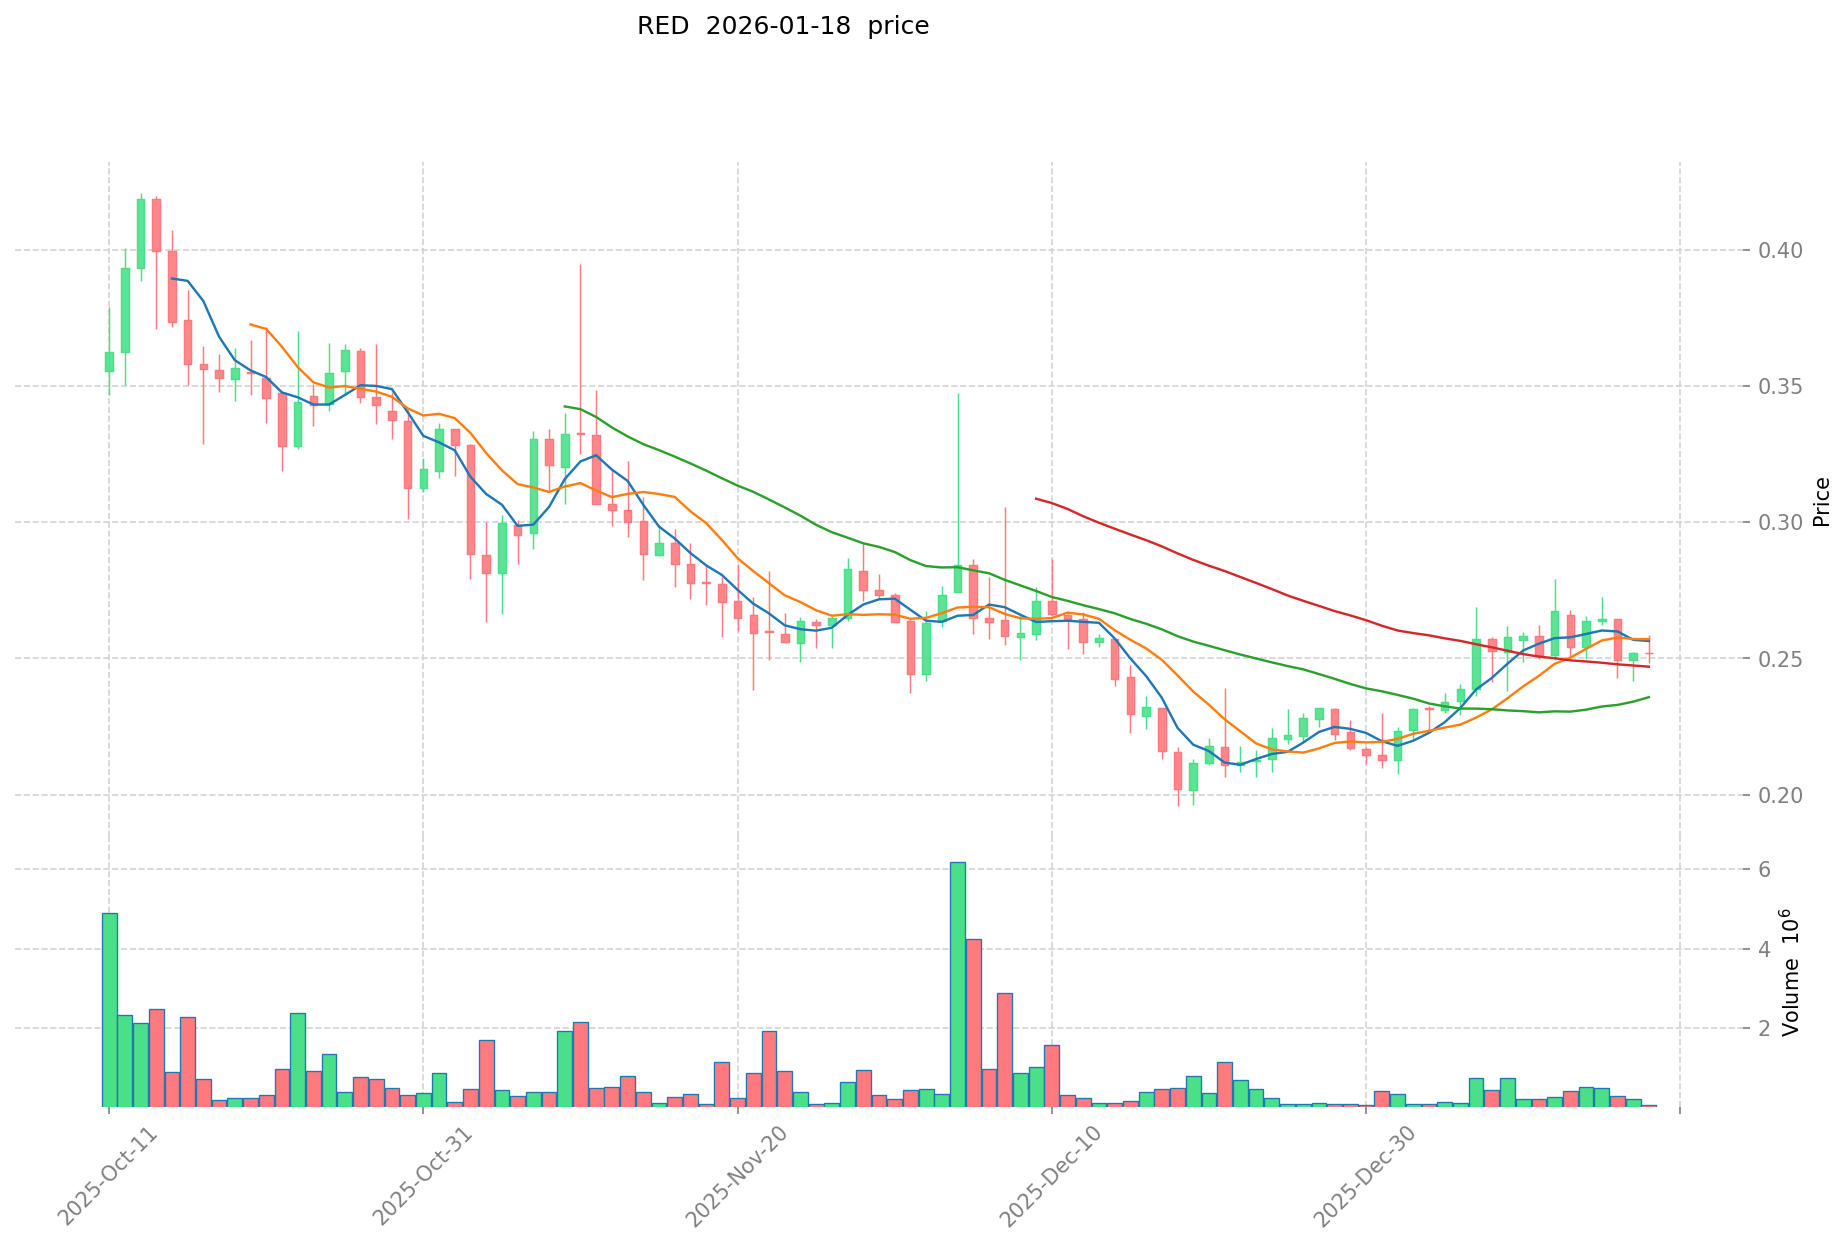
- 2025: RedStone reached a notable price level of $0.9771 on September 5, 2025, following its token launch earlier in the year. The asset experienced significant volatility during its initial trading period.
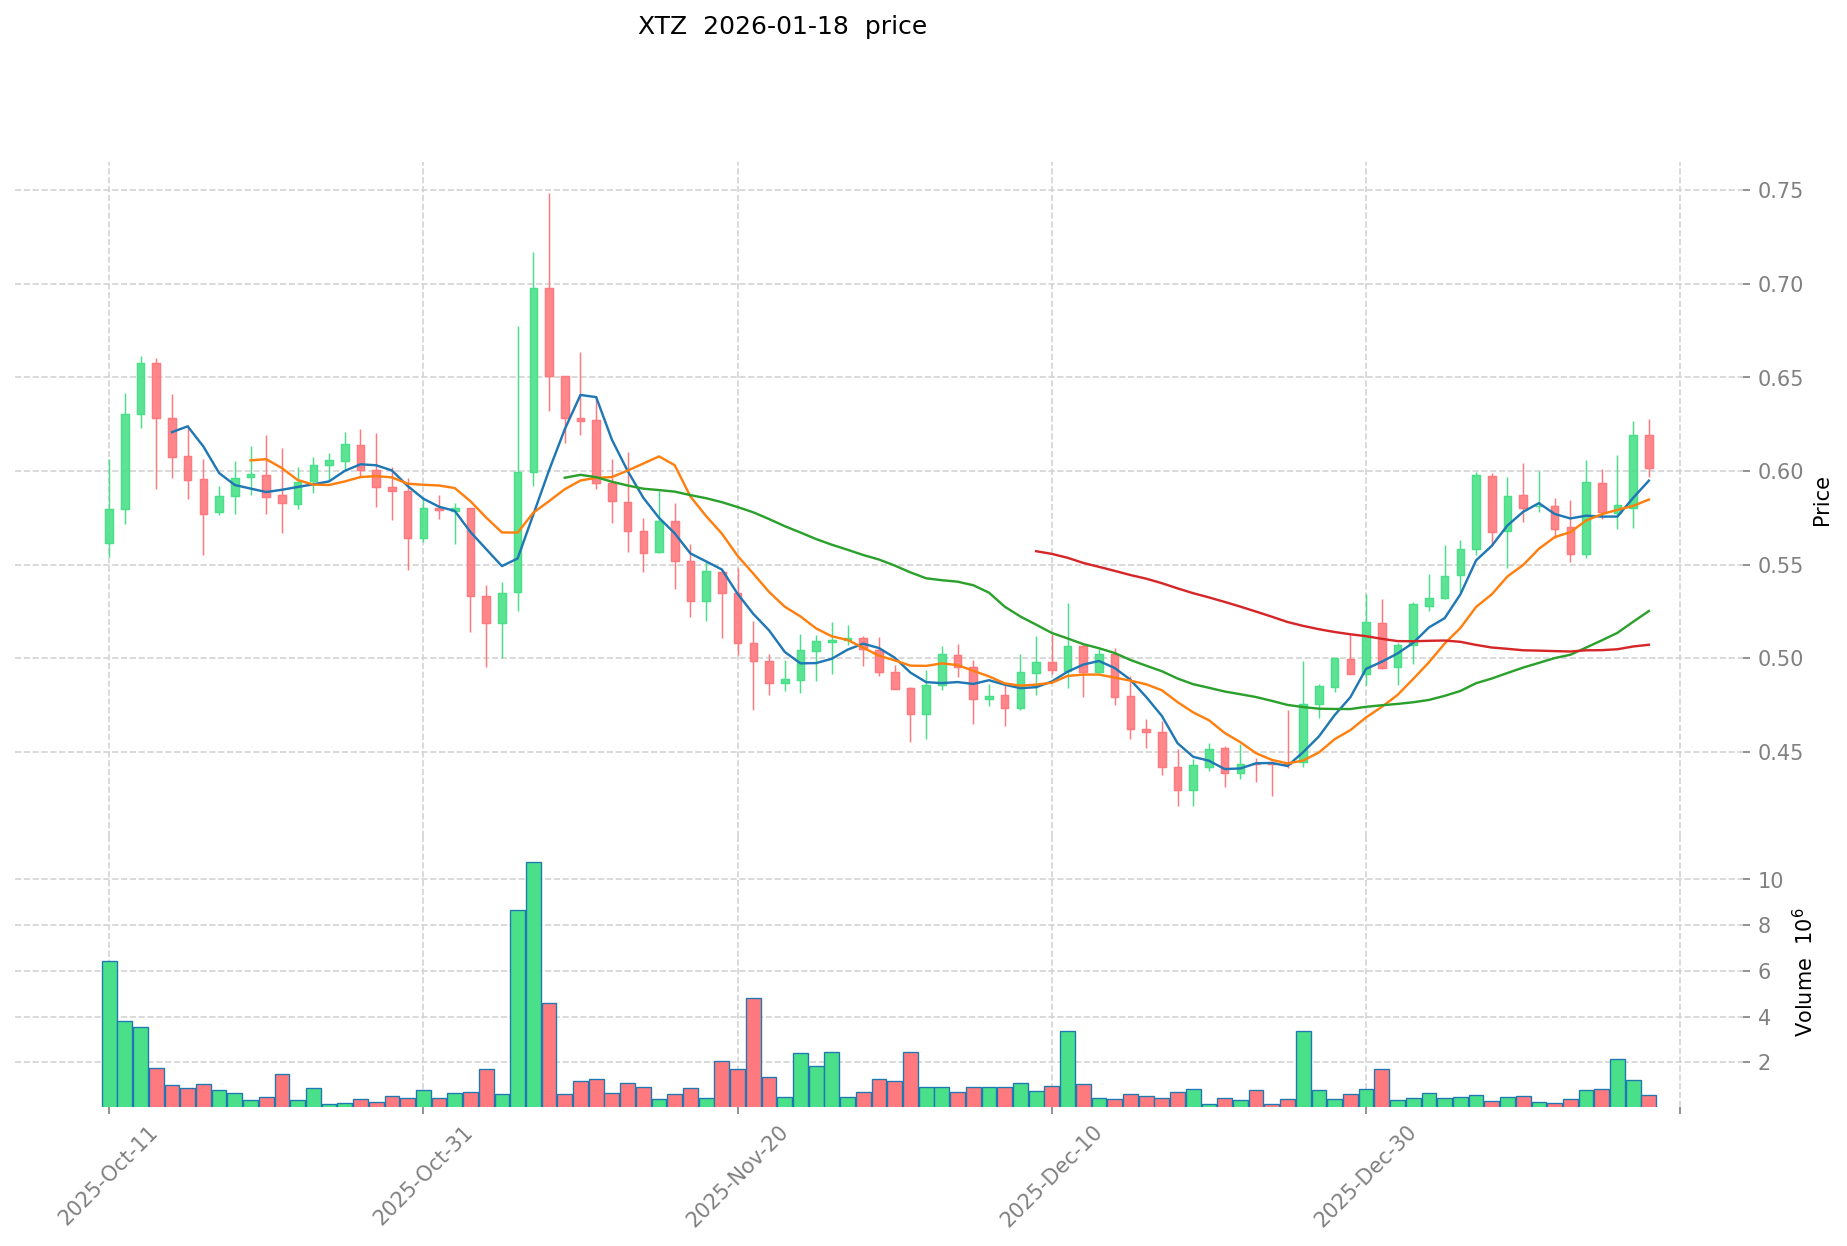
- 2021: Tezos achieved its all-time high of $9.12 on October 4, 2021, driven by increased adoption of its smart contract platform and partnerships with multiple institutional entities.
- Comparative Analysis: During the 2025-2026 market cycle, RedStone declined from its peak of $0.9771 to a low of $0.1958 recorded on December 18, 2025, representing substantial price compression. In contrast, Tezos has experienced a more extended downward trend, declining approximately 93.25% from its 2021 high to current levels.
Current Market Status (January 18, 2026)
- RedStone current price: $0.2512
- Tezos current price: $0.6162
- 24-hour trading volume: RedStone recorded $18,014.76 compared to Tezos' $569,926.79
- Market sentiment index (Fear & Greed Index): 49 (Neutral)
View real-time prices:
II. Core Factors Influencing RED vs XTZ Investment Value
Supply Mechanism Comparison (Tokenomics)
- RED: Supply mechanism details are not available in the provided materials.
- XTZ (Tezos): Inflationary model where new tokens are issued through baking (staking). The network employs a continuous issuance mechanism to reward validators and participants in the governance process.
- 📌 Historical Pattern: Supply mechanisms can influence price cycles, with inflationary models potentially creating selling pressure from new issuance, while staking rewards may incentivize long-term holding behavior.
Institutional Adoption and Market Application
- Institutional Holdings: XTZ has demonstrated appeal to institutional participants through its governance model and staking infrastructure, though specific comparative data with RED is not available.
- Enterprise Adoption: XTZ has established partnerships with entities including Ubisoft, Red Bull Racing Honda, and Kolibri, indicating adoption in gaming, sports marketing, and DeFi sectors. Cross-border payment and settlement applications for RED are not documented in available materials.
- National Policies: Regulatory attitudes toward these assets vary by jurisdiction, with XTZ benefiting from its decentralized governance structure in certain regulatory environments.
Technical Development and Ecosystem Building
- XTZ Technical Upgrades: Tezos features a self-amending blockchain protocol with an on-chain governance mechanism. The network shell architecture serves as a universal translator between different protocol versions, enabling seamless upgrades without hard forks. This technical infrastructure supports long-term ecosystem development.
- RED Technical Development: Technical development details are not available in the provided materials.
- Ecosystem Comparison: XTZ has established presence in DeFi applications and governance use cases. The platform's self-upgrading mechanism supports continuous ecosystem expansion. Comparative ecosystem data for RED in DeFi, NFT, payment, and smart contract applications is not available.
Macroeconomic and Market Cycles
- Performance in Inflationary Environments: Analysis of anti-inflation properties requires consideration of supply dynamics, adoption rates, and market positioning. Specific comparative performance data is not available in the provided materials.
- Macroeconomic Monetary Policy: Interest rates and USD index movements typically influence cryptocurrency valuations through their impact on risk appetite and capital flows. Both assets may experience correlation with broader market conditions.
- Geopolitical Factors: Cross-border transaction demand and international developments can affect adoption patterns, particularly for assets with established payment or settlement use cases.
III. 2026-2031 Price Forecast: RED vs XTZ
Short-term Forecast (2026)
- RED: Conservative $0.146-$0.252 | Optimistic $0.252-$0.262
- XTZ: Conservative $0.407-$0.617 | Optimistic $0.617-$0.752
Mid-term Forecast (2028-2029)
- RED may enter a consolidation phase, with projected prices ranging from $0.183 to $0.341 in 2028, potentially extending to $0.287-$0.360 by 2029
- XTZ may enter an expansion phase, with projected prices ranging from $0.556 to $1.246 in 2028, potentially reaching $0.626-$1.503 by 2029
- Key drivers: institutional capital flows, ETF developments, ecosystem expansion
Long-term Forecast (2030-2031)
- RED: Baseline scenario $0.189-$0.362 | Optimistic scenario $0.276-$0.392
- XTZ: Baseline scenario $0.739-$1.477 | Optimistic scenario $0.839-$1.788
View detailed price predictions for RED and XTZ
Disclaimer
RED:
| Year |
Predicted High Price |
Predicted Average Price |
Predicted Low Price |
Price Change |
| 2026 |
0.26156 |
0.2515 |
0.14587 |
0 |
| 2027 |
0.3257931 |
0.25653 |
0.2360076 |
2 |
| 2028 |
0.3406590135 |
0.29116155 |
0.1834317765 |
15 |
| 2029 |
0.360137721195 |
0.31591028175 |
0.2874783563925 |
25 |
| 2030 |
0.361685681575575 |
0.3380240014725 |
0.1892934408246 |
34 |
| 2031 |
0.391837422506922 |
0.349854841524037 |
0.276385324803989 |
39 |
XTZ:
| Year |
Predicted High Price |
Predicted Average Price |
Predicted Low Price |
Price Change |
| 2026 |
0.75213 |
0.6165 |
0.40689 |
1 |
| 2027 |
0.9990999 |
0.684315 |
0.34900065 |
12 |
| 2028 |
1.245727026 |
0.84170745 |
0.555526917 |
37 |
| 2029 |
1.50295282272 |
1.043717238 |
0.6262303428 |
71 |
| 2030 |
1.4770686352176 |
1.27333503036 |
0.7385343176088 |
108 |
| 2031 |
1.78776238262544 |
1.3752018327888 |
0.838873118001168 |
125 |
IV. Investment Strategy Comparison: RED vs XTZ
Long-term vs Short-term Investment Strategies
- RED: May suit investors focused on emerging oracle infrastructure and early-stage technology adoption. The asset's recent launch in January 2025 and positioning in the oracle sector suggests potential appeal for those seeking exposure to data infrastructure services, particularly in yield-bearing assets coverage.
- XTZ: May suit investors seeking established blockchain platforms with proven governance mechanisms and institutional adoption. The platform's self-amending protocol and track record since 2017 may appeal to those prioritizing technological maturity and decentralized governance structures.
Risk Management and Asset Allocation
- Conservative Investors: RED 20-30% vs XTZ 70-80%. This allocation reflects XTZ's longer operational history and broader market recognition compared to RED's nascent market position.
- Aggressive Investors: RED 50-60% vs XTZ 40-50%. Higher RED allocation may provide exposure to potential growth in the oracle sector, while XTZ offers relative stability through established ecosystem presence.
- Hedging Tools: Stablecoin allocation for liquidity management, options strategies for downside protection, cross-asset portfolio diversification to reduce concentration risk.
V. Potential Risk Comparison
Market Risks
- RED: Price volatility associated with recent market entry, demonstrated by the decline from $0.9771 to $0.1958 between September and December 2025. Trading volume of $18,014.76 indicates lower liquidity compared to established assets, potentially amplifying price movements during market stress.
- XTZ: Historical price compression of approximately 93.25% from 2021 peak to current levels reflects extended downward trend. Current trading volume of $569,926.79 suggests moderate liquidity. Price recovery depends on broader market conditions and ecosystem development progress.
Technical Risks
- RED: Technical infrastructure details and scalability characteristics are not extensively documented in available materials. Network stability and performance metrics require further evaluation as the platform matures.
- XTZ: The self-amending protocol design and network shell architecture provide upgradeability without hard forks. Technical risks relate primarily to governance coordination and adoption of protocol upgrades. Security considerations include validator participation rates and network consensus mechanisms.
Regulatory Risks
- Global regulatory developments may impact both assets differently based on their functional classifications. XTZ's governance token characteristics and staking mechanism may face scrutiny under evolving securities frameworks. RED's oracle service positioning may encounter different regulatory considerations related to data infrastructure and DeFi applications. Jurisdictional variations in cryptocurrency regulation present ongoing compliance challenges for both ecosystems.
VI. Conclusion: Which Is the Better Buy?
📌 Investment Value Summary:
- RED Advantages: Positioning in the oracle infrastructure sector with focus on yield-bearing assets coverage, including LRTs, LSTs, and stablecoins. Recent market entry provides potential for early-stage adoption growth in Actively Validated Services with Restaking functionality.
- XTZ Advantages: Established operational history since 2017 with proven self-amending blockchain protocol. Documented institutional partnerships including Ubisoft, Red Bull Racing Honda, and Kolibri demonstrate ecosystem adoption. On-chain governance mechanism supports continuous protocol evolution without contentious hard forks.
✅ Investment Recommendations:
- Beginning Investors: Consider XTZ for exposure to established blockchain platform with documented use cases and institutional adoption. The longer operational history may provide relative stability compared to recently launched assets. Portfolio allocation should prioritize risk management through diversification.
- Experienced Investors: Evaluate RED for potential oracle infrastructure exposure alongside XTZ for established platform benefits. Consider technical developments, ecosystem expansion metrics, and comparative valuation analysis when determining allocation ratios. Monitor trading volumes and liquidity conditions across both assets.
- Institutional Investors: Assess XTZ's governance framework and staking infrastructure for alignment with institutional requirements. RED's oracle positioning may complement infrastructure exposure strategies. Conduct comprehensive due diligence on custody solutions, regulatory compliance considerations, and risk management frameworks before deployment.
⚠️ Risk Disclosure: Cryptocurrency markets exhibit substantial volatility. Historical performance does not indicate future results. This content does not constitute investment advice. Conduct independent research and consult qualified financial professionals before making investment decisions.
VII. FAQ
Q1: What is the primary difference between RED and XTZ in terms of their blockchain functionality?
RED is an oracle infrastructure provider specializing in Actively Validated Services with Restaking, focusing on yield-bearing assets like LRTs, LSTs, and stablecoins. In contrast, XTZ is a self-amending blockchain platform with on-chain governance mechanisms that enable protocol upgrades without hard forks. While RED serves as a data infrastructure layer providing price feeds and validation services to DeFi applications, XTZ operates as a full-stack blockchain platform supporting smart contracts, decentralized applications, and governance-driven protocol evolution. The fundamental distinction lies in RED's specialized oracle service positioning versus XTZ's comprehensive blockchain platform architecture.
Q2: Why does XTZ have significantly higher trading volume compared to RED?
XTZ's 24-hour trading volume of $569,926.79 substantially exceeds RED's $18,014.76 primarily due to its longer market presence and broader exchange listings. Launched in October 2017, XTZ has established liquidity pools across major exchanges and accumulated a larger holder base over eight years of operation. RED, having launched in January 2025, is still in its early market development phase with limited liquidity establishment. Additionally, XTZ's institutional partnerships with entities like Ubisoft and Red Bull Racing Honda have contributed to sustained trading activity. The volume disparity reflects market maturity differences rather than necessarily indicating superior investment merit.
Q3: How do the supply mechanisms of RED and XTZ affect their long-term price potential?
XTZ operates with an inflationary supply model where new tokens are continuously issued through its baking (staking) mechanism to reward validators and governance participants. This creates ongoing selling pressure from new issuance but simultaneously incentivizes long-term holding through staking rewards. RED's supply mechanism details are not extensively documented in available materials, making comparative analysis challenging. Generally, inflationary models like XTZ's can suppress price appreciation during low-demand periods but support network security through validator incentives. The price impact of supply mechanisms depends significantly on adoption rates, staking participation levels, and overall market demand dynamics.
Q4: What role does institutional adoption play in the RED vs XTZ comparison?
Institutional adoption significantly differentiates these assets' market positioning. XTZ has demonstrated institutional appeal through documented partnerships including Ubisoft (gaming integration), Red Bull Racing Honda (sports marketing), and Kolibri (DeFi applications). These relationships provide use case validation and potential network effects from enterprise-scale adoption. RED's institutional adoption metrics are not extensively documented in available materials, though its oracle infrastructure positioning targets DeFi protocols requiring reliable price feeds. Institutional adoption typically correlates with increased liquidity, reduced volatility, and enhanced regulatory clarity, factors that may favor XTZ's current market position while RED's institutional relationships develop.
Q5: How should investors interpret the price forecasts for 2026-2031?
Price forecasts should be viewed as scenario-based projections rather than guaranteed outcomes. For RED, conservative 2026 projections range from $0.146-$0.252, while optimistic scenarios suggest $0.252-$0.262, reflecting uncertainty around early-stage adoption. XTZ's conservative 2026 forecast of $0.407-$0.617 and optimistic $0.617-$0.752 reflects its established market position. By 2031, projections diverge significantly based on ecosystem development assumptions, with RED potentially reaching $0.276-$0.392 and XTZ potentially reaching $0.839-$1.788. These forecasts incorporate assumptions about institutional capital flows, technological developments, and macroeconomic conditions that may not materialize as expected. Investors should use these projections as directional indicators within comprehensive risk management frameworks.
Q6: What specific risks should investors consider when comparing RED and XTZ?
RED's primary risks include limited operational history since January 2025, demonstrated price volatility from $0.9771 to $0.1958 within months, and lower trading volume indicating potential liquidity challenges during market stress. Technical infrastructure details remain limited, requiring ongoing evaluation as the platform matures. XTZ's risks center on its 93.25% price decline from 2021 peaks, indicating susceptibility to broader market cycles, and reliance on governance coordination for protocol upgrades. Regulatory risks differ by jurisdiction, with XTZ's staking mechanism potentially facing securities scrutiny while RED's oracle positioning encounters data infrastructure regulatory considerations. Both assets face macroeconomic sensitivity through correlation with risk appetite and capital flow dynamics.
Q7: Which asset is more suitable for portfolio diversification strategies?
The diversification suitability depends on existing portfolio composition and risk tolerance. XTZ offers diversification benefits through exposure to established blockchain governance mechanisms and institutional adoption patterns, potentially providing lower correlation with pure speculative assets. Its eight-year operational history and documented use cases may reduce portfolio concentration risk. RED provides diversification through oracle infrastructure exposure, a sector experiencing growth with DeFi expansion. For portfolios heavily weighted toward established cryptocurrencies, RED's early-stage positioning may offer uncorrelated returns potential. Optimal diversification likely involves both assets at appropriate allocation ratios: conservative investors might consider 70-80% XTZ with 20-30% RED, while aggressive strategies might reverse this allocation based on risk capacity and growth objectives.
Q8: How do macroeconomic conditions differently impact RED versus XTZ?
Macroeconomic conditions affect both assets through risk appetite channels, but with potential variations in sensitivity. XTZ's established institutional partnerships and governance token characteristics may exhibit correlation with traditional risk assets during monetary policy shifts, as interest rate changes influence capital allocation to yield-generating alternatives like staking. RED's oracle infrastructure positioning may demonstrate different sensitivity patterns, potentially benefiting from DeFi growth during periods of financial innovation regardless of broader monetary conditions. However, both assets likely experience correlation with overall cryptocurrency market sentiment driven by USD index movements and global liquidity conditions. Inflationary environments may impact adoption patterns differently, with XTZ's inflationary supply model potentially facing additional selling pressure while RED's positioning in yield-bearing asset oracles could benefit from increased DeFi activity seeking inflation hedges.
* The information is not intended to be and does not constitute financial advice or any other recommendation of any sort offered or endorsed by Gate.