This comprehensive analysis compares RED and ZIL, two distinct blockchain platforms with different market positioning. RedStone (RED), launched in 2025, functions as an oracle infrastructure project offering Actively Validated Services with restaking, targeting yield-bearing assets including LRTs, LSTs, and stablecoins. Zilliqa (ZIL), operating since 2018, is a high-throughput layer-1 blockchain utilizing sharding technology for scalability. The article examines historical price trends, tokenomics, institutional adoption, technical ecosystems, and investment strategies. Currently, RED trades at $0.249 with 37.57% annual decline, while ZIL trades at $0.00577 with 75.6% decline. Forecasts through 2031 suggest varied growth trajectories for both assets. The guide provides risk assessments, allocation strategies for different investor profiles, and detailed investment recommendations suitable for novice, experienced, and institutional investors on Gate exchange.
Introduction: Investment Comparison Between RED and ZIL
In the cryptocurrency market, the comparison between RED vs ZIL has been a topic that investors cannot avoid. The two not only show significant differences in market cap ranking, application scenarios, and price performance, but also represent different crypto asset positioning.
RedStone (RED): Since its launch in 2025, it has gained market recognition by positioning itself as the fastest-growing oracle and the only major player offering Actively Validated Services with Restaking, particularly leading in the yield-bearing assets sector covering LRTs, LSTs, and stablecoins.
Zilliqa (ZIL): Since 2018, it has been regarded as a high-throughput public blockchain platform that extends performance to thousands of transactions per second, aiming to address transaction speed and scalability challenges through innovative sharding technology.
This article will comprehensively analyze the investment value comparison between RED vs ZIL around historical price trends, supply mechanisms, institutional adoption, technical ecosystems, and future predictions, attempting to answer the question investors care about most:
"Which is the better buy right now?"
I. Historical Price Comparison and Current Market Status
RedStone (RED) and Zilliqa (ZIL) Historical Price Trends
- 2025: RedStone experienced notable price volatility, reaching an all-time high of $0.9771 in September 2025, followed by a significant decline to its all-time low of $0.1958 in December 2025.
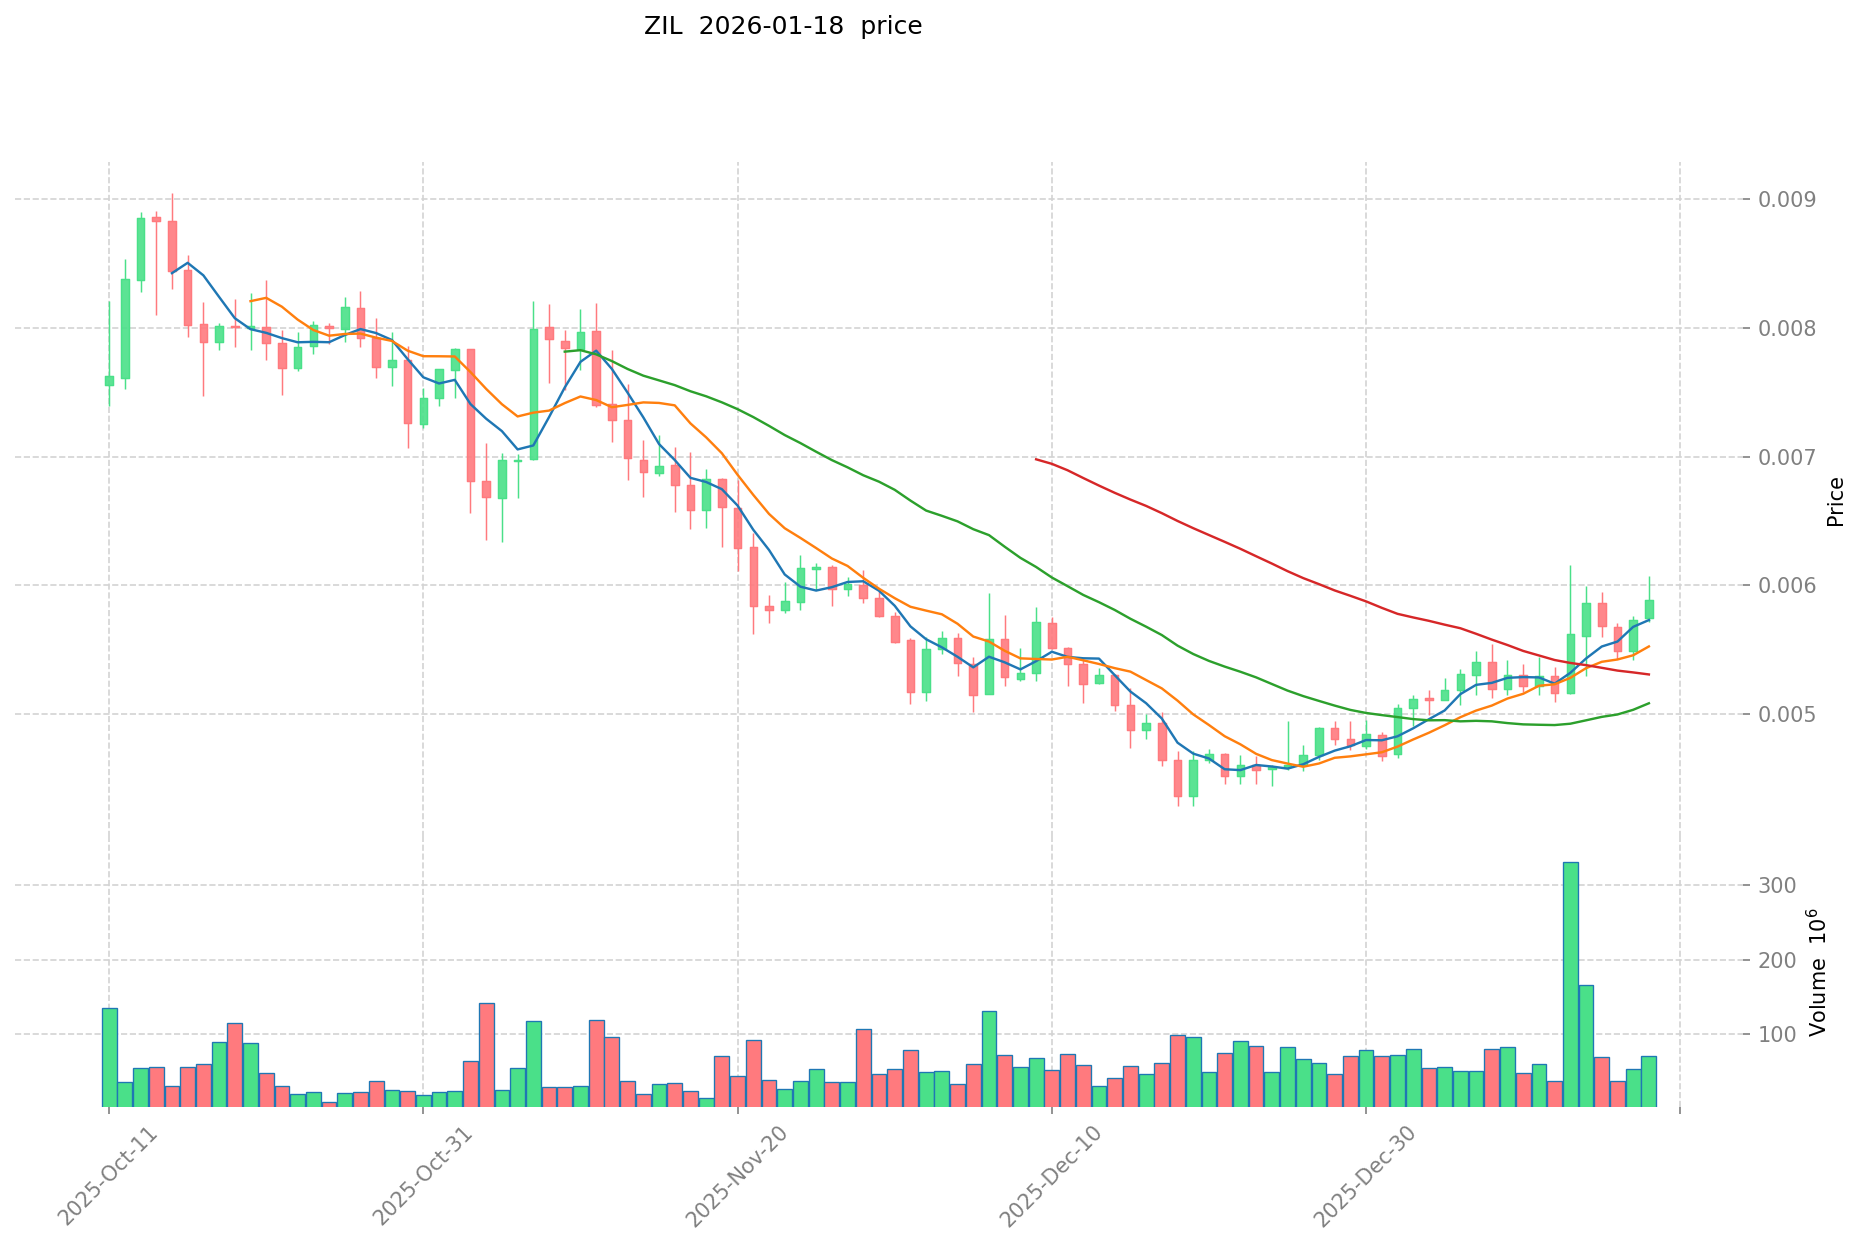
- 2019-2021: Zilliqa launched its mainnet in January 2019, marking a transition from ERC-20 tokens on Ethereum to native ZIL tokens. The platform reached its all-time high of $0.256293 in May 2021 during the broader cryptocurrency market rally.
- Comparative Analysis: During recent market cycles, RED demonstrated higher volatility with a decline of approximately 37.57% over the past year, while ZIL experienced a steeper decline of approximately 75.6% over the same period, reflecting different market positioning and adoption trajectories.
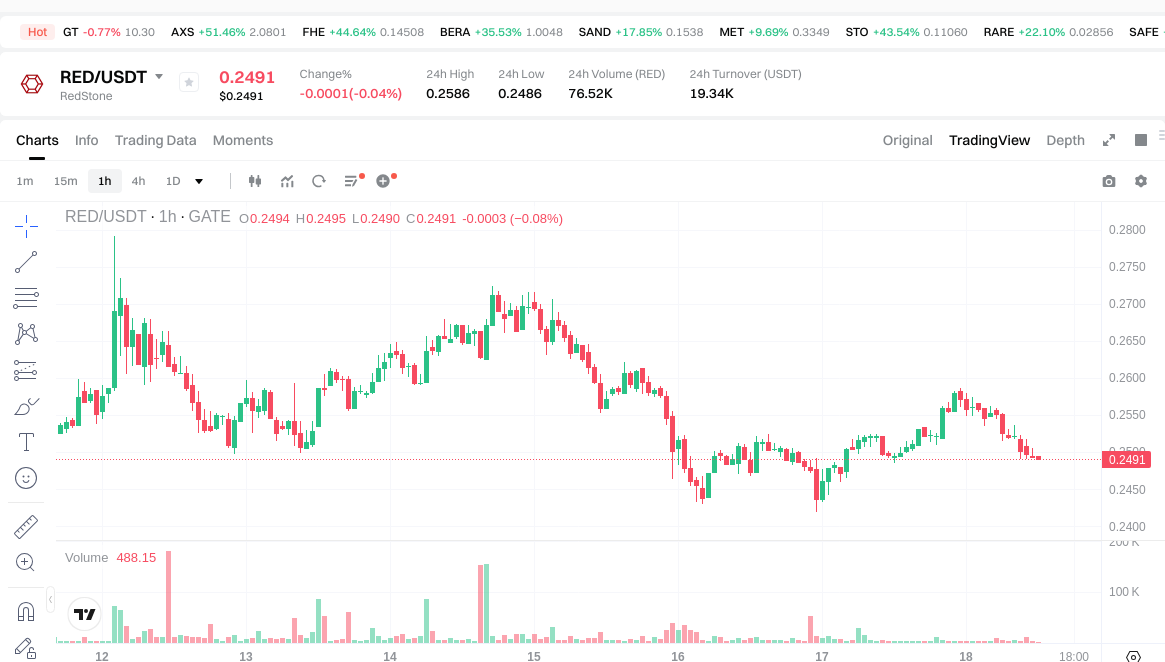
Current Market Status (2026-01-18)
- RedStone current price: $0.249
- Zilliqa current price: $0.00577
- 24-hour trading volume: RED $19,375.48 vs ZIL $431,546.20
- Market Sentiment Index (Fear & Greed Index): 49 (Neutral)
View real-time prices:
II. Core Factors Affecting Investment Value of RED vs ZIL
Supply Mechanism Comparison (Tokenomics)
Based on available reference materials, specific supply mechanism details for RED and ZIL were not provided in the search results. The materials primarily discussed other blockchain projects such as LPT and NEAR, which demonstrated different tokenomics models including inflationary and deflationary mechanisms.
Institutional Adoption and Market Application
The reference materials did not contain specific information regarding institutional holdings, enterprise adoption patterns, or regulatory approaches for RED and ZIL across different jurisdictions. Without concrete data on institutional preference, cross-border payment applications, or national policy stances toward these specific assets, this analysis cannot be substantiated.
Technology Development and Ecosystem Construction
No information was found in the provided materials regarding technology upgrades, development roadmaps, or ecosystem comparisons for RED and ZIL. The materials focused on other projects' technical developments and ecosystem activities in DeFi, NFT, and smart contract implementations, but did not address RED or ZIL specifically.
Macroeconomic Environment and Market Cycles
While the reference materials discussed broader macroeconomic trends affecting crypto assets, including GDP growth patterns, CPI indicators, and consumption trends in various markets, they did not provide specific analysis of how RED and ZIL perform under inflationary conditions, respond to monetary policy changes, or react to geopolitical factors.
📌 The available materials primarily covered investment analysis frameworks for other digital assets and broader market trends, but lacked specific comparable data for RED and ZIL across the requested analytical dimensions.
III. 2026-2031 Price Forecast: RED vs ZIL
Short-term Forecast (2026)
- RED: Conservative $0.164-$0.249 | Optimistic $0.249-$0.306
- ZIL: Conservative $0.003-$0.006 | Optimistic $0.006-$0.008
Mid-term Forecast (2028-2029)
- RED may enter a consolidation phase with projected price range of $0.273-$0.347 in 2028, potentially extending to $0.278-$0.382 by 2029
- ZIL may experience gradual growth trajectory with estimated range of $0.004-$0.008 in 2028, expanding to $0.007-$0.011 in 2029
- Key drivers: institutional capital inflows, ETF developments, ecosystem expansion
Long-term Forecast (2030-2031)
- RED: Base scenario $0.332-$0.349 (2030) | Optimistic scenario $0.247-$0.430 (2031)
- ZIL: Base scenario $0.007-$0.010 (2030) | Optimistic scenario $0.008-$0.015 (2031)
View detailed price predictions for RED and ZIL
Disclaimer
Price predictions are based on historical data analysis and market trends. Cryptocurrency markets are highly volatile and subject to various unpredictable factors. These forecasts should not be considered as investment advice. Users should conduct independent research and assess their risk tolerance before making any investment decisions.
RED:
| Year |
Predicted High Price |
Predicted Average Price |
Predicted Low Price |
Price Change |
| 2026 |
0.306393 |
0.2491 |
0.164406 |
0 |
| 2027 |
0.291633825 |
0.2777465 |
0.247194385 |
11 |
| 2028 |
0.34732199825 |
0.2846901625 |
0.273302556 |
14 |
| 2029 |
0.38236735725375 |
0.316006080375 |
0.27808535073 |
26 |
| 2030 |
0.398072859448387 |
0.349186718814375 |
0.331727382873656 |
40 |
| 2031 |
0.429674257501088 |
0.373629789131381 |
0.246595660826711 |
50 |
ZIL:
| Year |
Predicted High Price |
Predicted Average Price |
Predicted Low Price |
Price Change |
| 2026 |
0.00766346 |
0.005762 |
0.00328434 |
0 |
| 2027 |
0.0087936763 |
0.00671273 |
0.0034234923 |
16 |
| 2028 |
0.008063331276 |
0.00775320315 |
0.004496857827 |
34 |
| 2029 |
0.01130882211459 |
0.007908267213 |
0.00719652316383 |
37 |
| 2030 |
0.011722424489829 |
0.009608544663795 |
0.00653381037138 |
66 |
| 2031 |
0.014505059024465 |
0.010665484576812 |
0.007999113432609 |
84 |
IV. Investment Strategy Comparison: RED vs ZIL
Long-term vs Short-term Investment Strategies
-
RED: May be suitable for investors focused on oracle infrastructure innovation and actively validated services, particularly those interested in the yield-bearing assets sector including LRTs, LSTs, and stablecoins. The asset has demonstrated higher recent volatility with a decline of approximately 37.57% over the past year.
-
ZIL: May appeal to investors interested in high-throughput blockchain platforms and sharding technology, though the asset has experienced a steeper decline of approximately 75.6% over the past year, suggesting a longer-term recovery horizon for those considering accumulation strategies.
Risk Management and Asset Allocation
-
Conservative Investors: RED 20-30% vs ZIL 10-15% (remaining portfolio allocated to established assets and stablecoins)
-
Aggressive Investors: RED 40-50% vs ZIL 20-30% (with higher allocation reflecting tolerance for volatility)
-
Hedging Tools: stablecoin allocation for portfolio stability, options strategies for downside protection, cross-asset diversification to manage correlation risks
V. Potential Risk Comparison
Market Risk
-
RED: Characterized by higher price volatility, with historical range from $0.1958 to $0.9771 in 2025. The relatively lower 24-hour trading volume of $19,375.48 may indicate liquidity constraints during market stress periods.
-
ZIL: Despite higher trading volume of $431,546.20, the asset has experienced substantial price decline of approximately 75.6% over the past year, reflecting market sentiment challenges and potential adoption headwinds.
Technical Risk
-
RED: As a newer project launched in 2025, potential risks include oracle network reliability, validator participation rates, and integration stability with supported yield-bearing assets.
-
ZIL: Sharding technology implementation complexity, network consensus mechanism resilience, and ongoing scalability optimization requirements present technical considerations.
Regulatory Risk
- Global regulatory frameworks continue evolving for oracle services and blockchain infrastructure projects. Both RED and ZIL may face varying compliance requirements across jurisdictions, particularly regarding data validation services and cross-border transaction capabilities. Investors should monitor regulatory developments in key markets that may impact project operations and token utility.
VI. Conclusion: Which Is the Better Buy?
📌 Investment Value Summary:
-
RED Advantages: Positioned as a fast-growing oracle solution with focus on actively validated services and restaking capabilities; specialized coverage of yield-bearing assets sector; newer market entrant with potential for early-stage growth trajectory
-
ZIL Advantages: Established project since 2018 with proven mainnet operations; innovative sharding technology approach; higher trading volume suggesting improved liquidity profile; longer operational track record
✅ Investment Recommendations:
-
Novice Investors: Consider starting with smaller allocations (5-10% combined) with emphasis on understanding the fundamental differences between oracle infrastructure (RED) and layer-1 blockchain platforms (ZIL). Prioritize risk management and diversification across established assets.
-
Experienced Investors: May explore strategic positioning based on market cycle timing and technical analysis. RED could represent exposure to oracle and restaking narratives, while ZIL offers potential recovery play in layer-1 infrastructure with established technology.
-
Institutional Investors: Conduct comprehensive due diligence on governance structures, tokenomics sustainability, and ecosystem development roadmaps. Consider allocation as part of broader blockchain infrastructure or DeFi oracle exposure strategies.
⚠️ Risk Warning: Cryptocurrency markets exhibit extreme volatility. This analysis does not constitute investment advice. Investors should conduct independent research, assess personal risk tolerance, and consider consulting financial professionals before making investment decisions.
VII. FAQ
Q1: What are the main differences between RED and ZIL in terms of their core technology and use cases?
RED is an oracle infrastructure project focusing on Actively Validated Services (AVS) with restaking capabilities, specifically designed for yield-bearing assets including LRTs, LSTs, and stablecoins. ZIL, on the other hand, is a layer-1 blockchain platform that utilizes sharding technology to achieve high throughput and scalability for general-purpose decentralized applications. RED serves as data validation infrastructure for DeFi protocols, while ZIL operates as a comprehensive smart contract platform competing with other layer-1 solutions.
Q2: Which asset has shown better price stability over the past year?
RED has demonstrated relatively better price stability with a decline of approximately 37.57% over the past year, compared to ZIL's steeper decline of approximately 75.6% during the same period. However, RED exhibits higher short-term volatility due to its recent launch in 2025, with prices ranging from $0.1958 to $0.9771. ZIL's longer operational history since 2018 provides more historical data, but its significant drawdown suggests sustained market sentiment challenges and adoption headwinds.
Q3: What is the projected price outlook for RED and ZIL through 2031?
According to forecasted models, RED is projected to trade between $0.247-$0.430 by 2031 with an average price around $0.374, representing potential growth from current levels. ZIL is estimated to reach $0.008-$0.015 by 2031 with an average price of $0.011, indicating a gradual recovery trajectory. Short-term projections for 2026 suggest RED may range from $0.164-$0.306, while ZIL could trade between $0.003-$0.008. These forecasts are based on historical trends and should not be considered guaranteed outcomes.
Q4: Which trading volume and liquidity profile is more favorable for investors?
ZIL currently demonstrates superior liquidity with a 24-hour trading volume of $431,546.20, significantly higher than RED's $19,375.48. This substantial difference suggests ZIL offers better entry and exit opportunities with reduced slippage risk during normal market conditions. However, RED's lower volume may present opportunities for investors comfortable with lower liquidity in exchange for exposure to emerging oracle infrastructure. Institutional and high-volume traders should carefully consider liquidity constraints when sizing positions in RED.
Q5: What are the key risk factors that differentiate RED from ZIL?
RED's primary risks include its nascent stage as a 2025 launch, potential oracle network reliability issues, validator participation uncertainties, and integration stability with supported protocols. ZIL faces different challenges including sharding technology complexity, network consensus mechanism resilience, and competition from other established layer-1 platforms. Both assets face regulatory uncertainties as global frameworks evolve for blockchain infrastructure projects. RED's lower trading volume presents additional liquidity risk, while ZIL's significant recent price decline reflects market adoption challenges.
Q6: How should investors approach portfolio allocation between RED and ZIL?
Conservative investors may consider allocating 20-30% to RED and 10-15% to ZIL within their cryptocurrency portfolio, maintaining majority exposure in established assets and stablecoins. Aggressive investors with higher risk tolerance could allocate 40-50% to RED and 20-30% to ZIL, acknowledging the elevated volatility profile. Both investor types should implement risk management strategies including stablecoin reserves for portfolio stability, diversification across multiple assets to manage correlation risks, and regular rebalancing based on market conditions and personal investment objectives.
Q7: What market conditions would favor RED versus ZIL performance?
RED may outperform during market cycles emphasizing DeFi innovation, oracle infrastructure development, and restaking narratives, particularly when yield-bearing assets gain prominence. The project benefits from growing demand for reliable data validation services across decentralized protocols. ZIL could experience stronger performance during periods favoring established layer-1 platforms, scalability solutions, and proven blockchain infrastructure with operational track records. Both assets may respond differently to broader macroeconomic conditions, regulatory developments, and sector-specific catalysts within the blockchain ecosystem.
Q8: Are RED and ZIL suitable for beginner cryptocurrency investors?
Both RED and ZIL present significant challenges for novice investors due to their specialized technical focus and elevated volatility profiles. Beginners should start with minimal allocations (5-10% combined) only after understanding fundamental concepts including oracle services, sharding technology, and blockchain infrastructure. New investors should prioritize established cryptocurrencies with stronger liquidity and longer operational histories while developing market knowledge. Educational resources, risk management principles, and diversification strategies should be mastered before committing substantial capital to either asset.
* The information is not intended to be and does not constitute financial advice or any other recommendation of any sort offered or endorsed by Gate.