This comprehensive analysis compares ROA CORE and TRON, two distinct blockchain platforms with different maturity levels and investment profiles. ROA CORE, launched in 2023, positions itself as an emerging Web3 ecosystem transforming everyday behaviors into data-driven value, currently trading at $0.006085 with significant volatility. TRON, established since 2017, operates as a mature blockchain infrastructure platform trading at $0.29174 with substantially higher trading liquidity. The article examines historical price trends, market status, profitability metrics, and 2026-2031 price predictions, helping investors understand risk-return profiles. Conservative investors may favor TRON's stability and established market recognition, while experienced investors seeking growth opportunities might consider diversified allocations. Detailed investment strategies, risk assessments, and FAQ sections guide decision-making across different investor types in the current cryptocurrency market environment.
Introduction: ROA vs TRX Investment Comparison
In the cryptocurrency market, the comparison between ROA and TRX remains a topic investors cannot avoid. These two assets demonstrate significant differences in market cap ranking, application scenarios, and price performance, representing distinct positioning within the crypto asset landscape.
ROA CORE (ROA): Launched in 2023, it has gained market recognition through its positioning as a Web3 ecosystem that transforms everyday behaviors—walking, cultural experiences, and digital engagement—into data-driven value.
TRON (TRX): Since its launch in 2017, it has been recognized as a blockchain infrastructure platform and has become one of the cryptocurrencies with substantial global trading volume and market capitalization.
This article will provide a comprehensive analysis of the ROA vs TRX investment value comparison, focusing on historical price trends, supply mechanisms, institutional adoption, technical ecosystems, and future predictions, attempting to answer the question investors care about most:
"Which is the better buy right now?"
I. Historical Price Comparison and Market Status
ROA CORE (ROA) and TRON (TRX) Historical Price Trends
- 2023: ROA CORE experienced significant price movement, reaching an all-time high of $0.1785 on December 22, 2023, representing a notable peak during this period.
- 2024: TRON (TRX) reached its all-time high of $0.431288 on December 4, 2024, marking a significant milestone in its price trajectory.
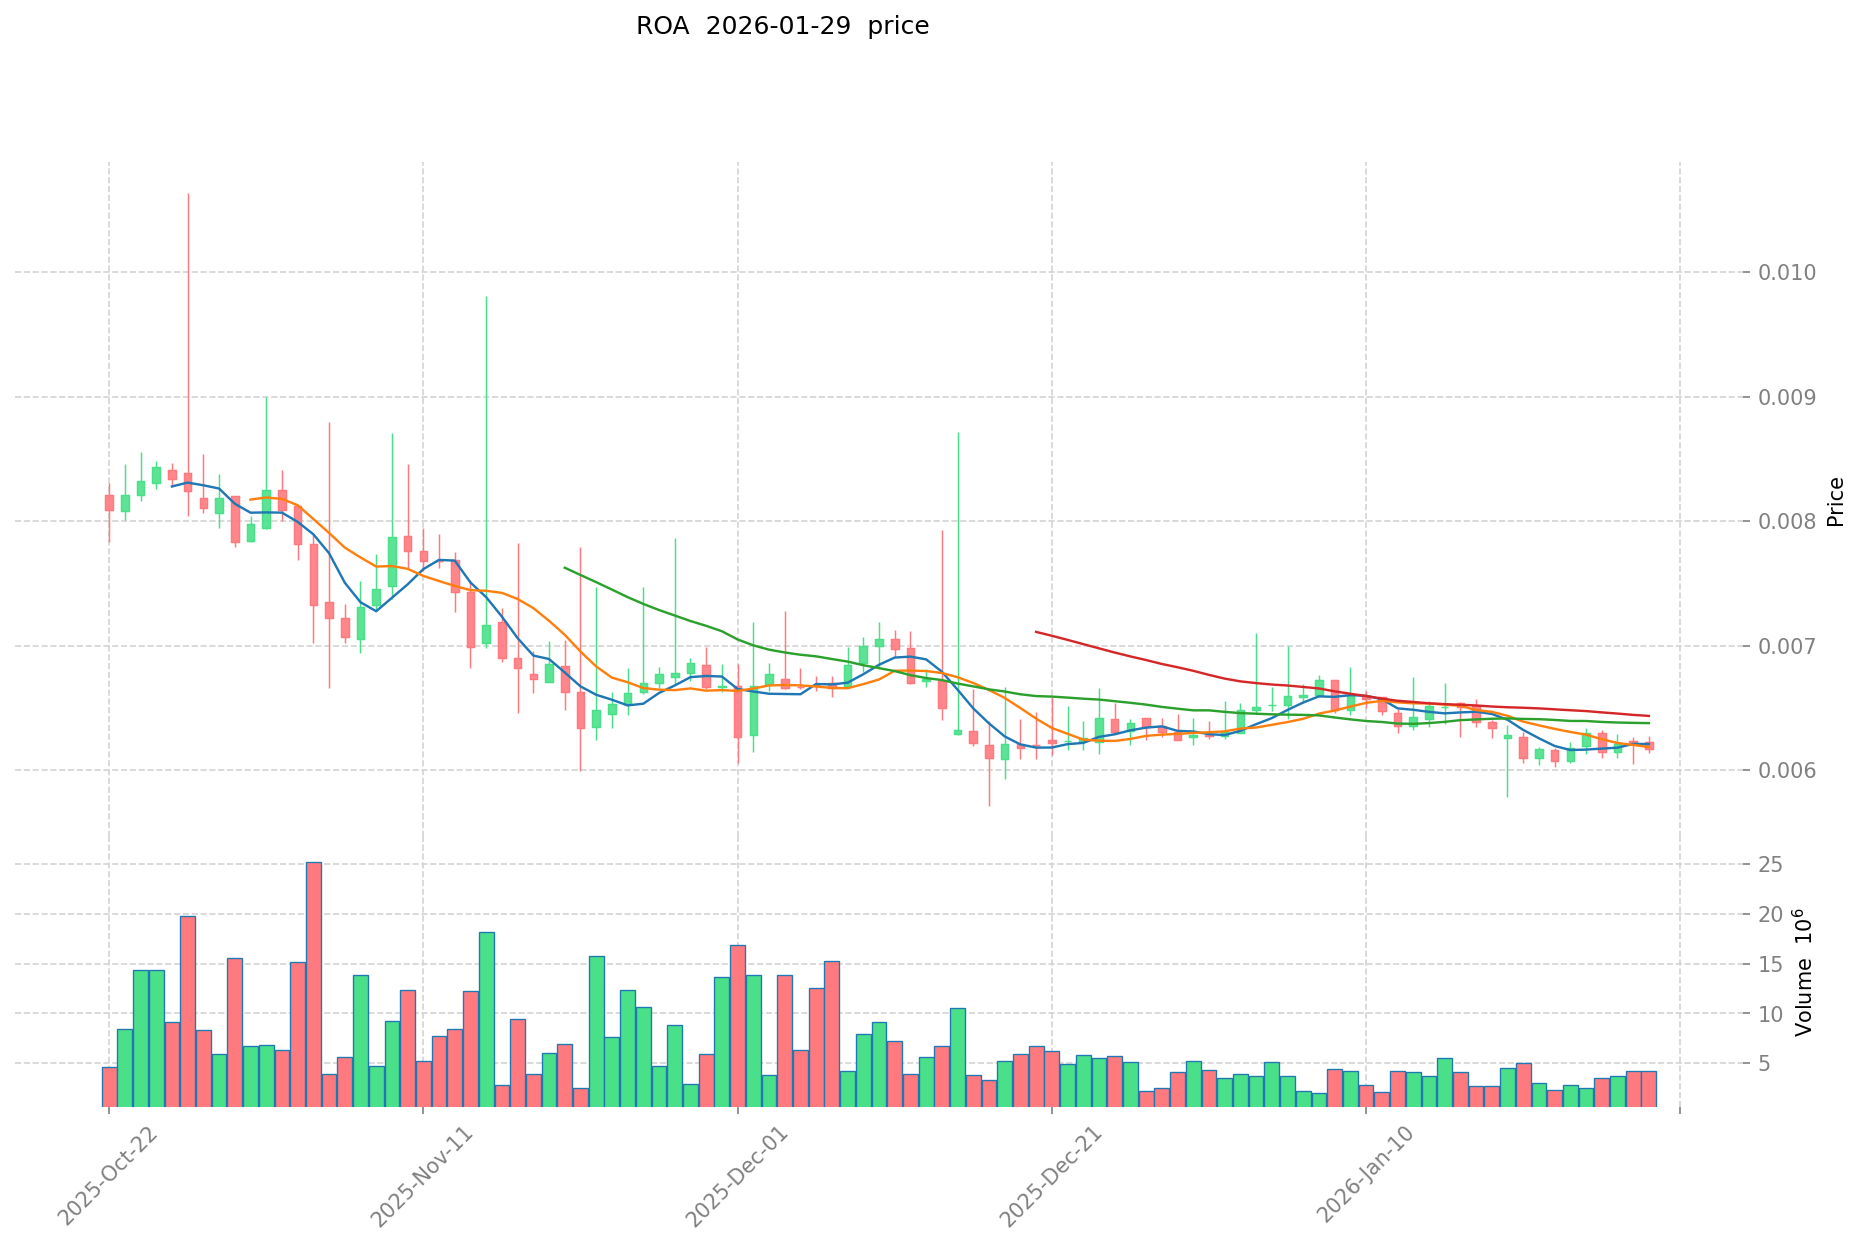
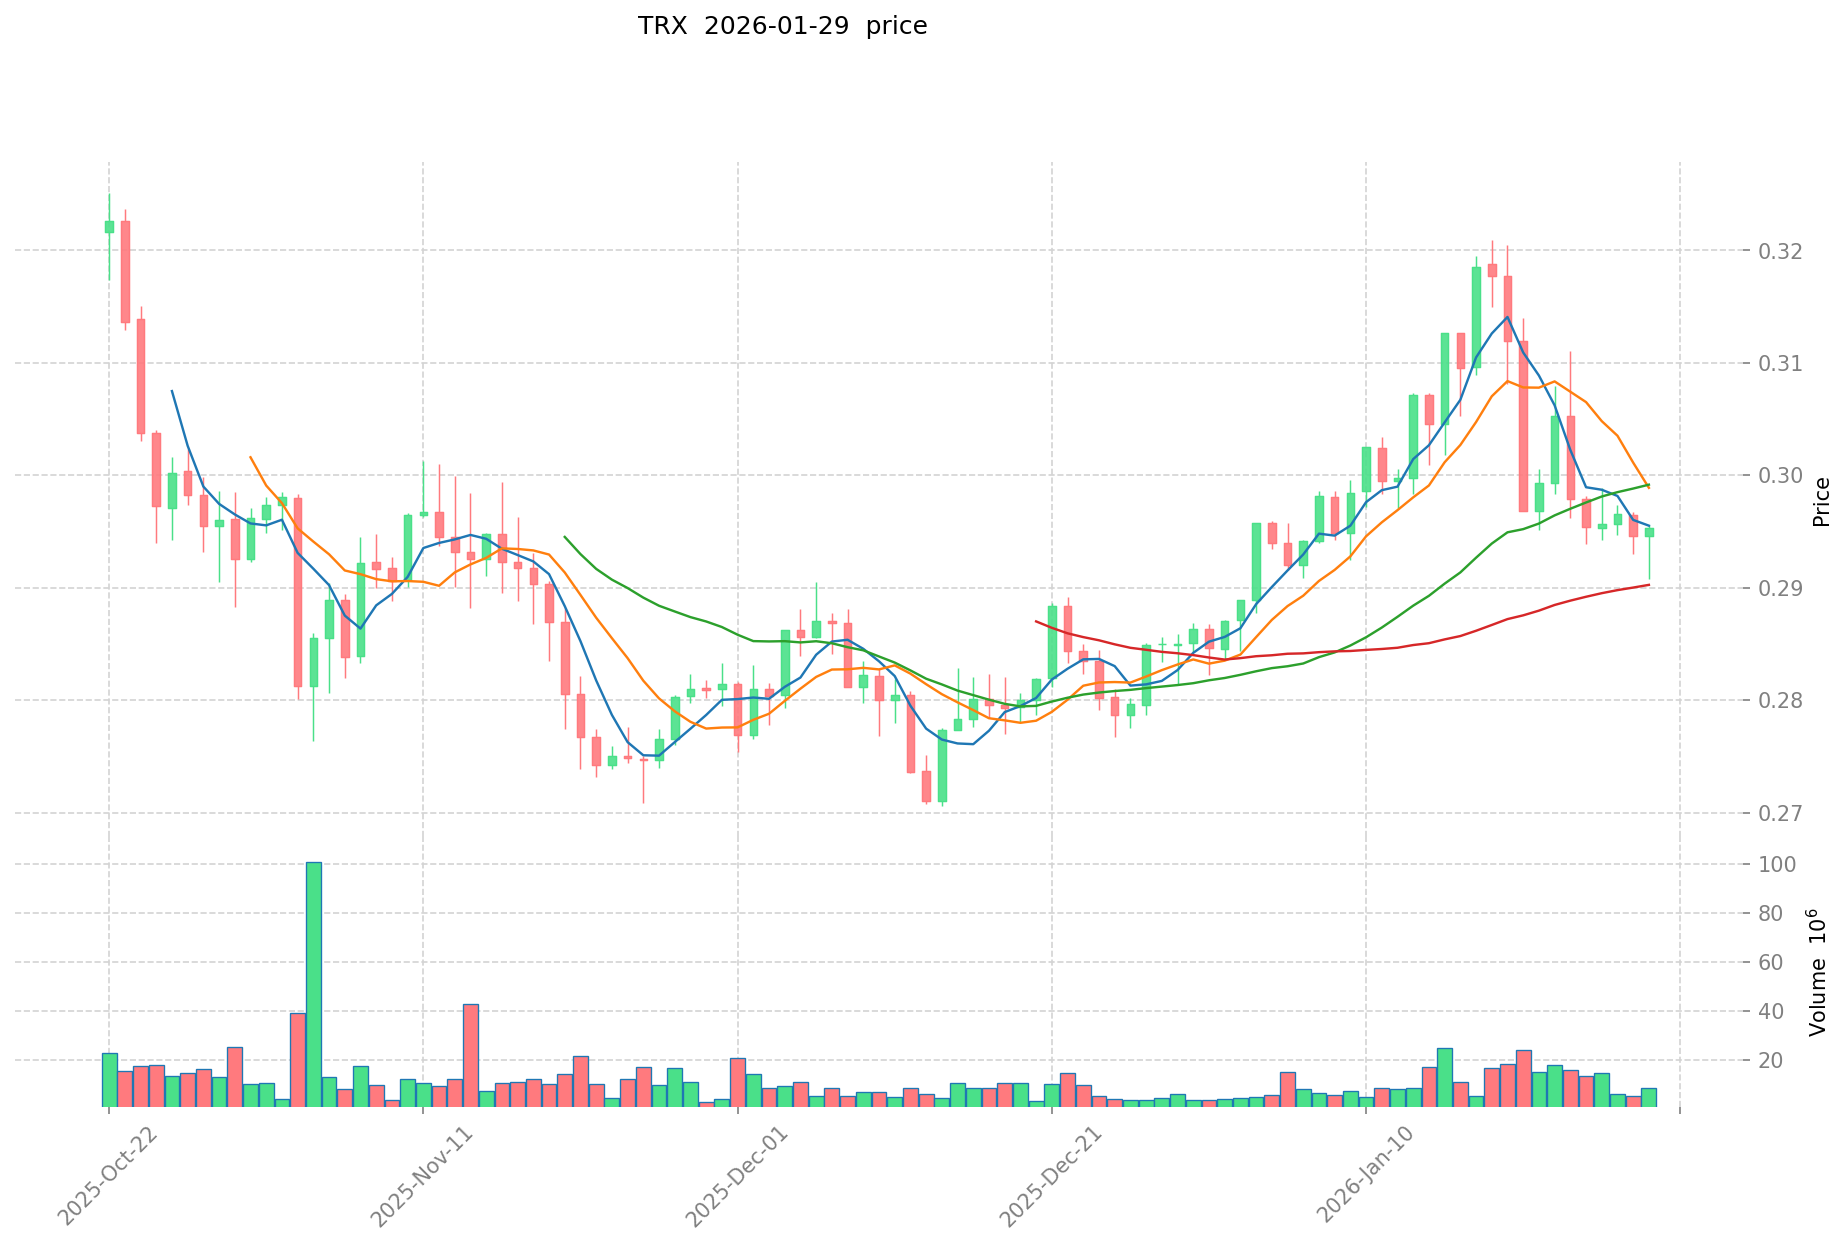
- Comparative Analysis: During recent market cycles, ROA CORE declined from its peak of $0.1785 to a low of $0.005711 (recorded on December 17, 2025), representing a substantial price correction. In contrast, TRON has demonstrated relative stability, trading near $0.29174 with more moderate fluctuations from its historical extremes.
Current Market Status (January 30, 2026)
- ROA CORE Current Price: $0.006085
- TRON Current Price: $0.29174
- 24-Hour Trading Volume: ROA CORE recorded $21,423.37 compared to TRON's $3,077,509.05
- Market Sentiment Index (Fear & Greed Index): 26 (Fear)
View Real-Time Prices:
II. Core Factors Influencing ROA vs TRX Investment Value
Profitability and Capital Efficiency
- Capital Return on Investment: The efficiency with which companies utilize capital deployed in business operations to generate profits represents a fundamental measure of investment value, with earnings before interest and taxes serving as a key metric for assessment.
- Asset Utilization: The ability to generate returns relative to total assets employed (ROA) provides insight into operational effectiveness and resource management capabilities.
- 📌 Historical Pattern: Investment value frameworks typically emphasize the combination of fundamental analysis and valuation metrics, where reasonable valuations support the holding of quality growth assets.
Market Expectations and Growth Prospects
- Fundamental Analysis: Investment value assessment centers on company fundamentals paired with appropriate valuation levels, forming the basis for long-term value creation.
- Growth Trajectory: Market expectations regarding future performance and expansion potential influence perceived investment attractiveness.
- Risk-Return Profile: Historical patterns suggest that value-oriented investment approaches may generate returns in certain ranges while maintaining relatively controlled drawdown levels.
- Profitability Indicators: Comprehensive assessment includes gross profit margin, operating profit margin, net profit margin, ROA, and ROE as measures of earning capability and resource utilization efficiency.
- Financial Stability: Evaluation of free cash flow, debt ratios, and liquidity ratios provides context for understanding financial health and sustainability.
- Comparative Analysis: The relationship between profitability metrics and capital efficiency offers perspective on relative investment merit between different opportunities.
III. 2026-2031 Price Prediction: ROA vs TRX
Short-term Prediction (2026)
- ROA: Conservative $0.00414732 - $0.006099 | Optimistic $0.006099 - $0.00798969
- TRX: Conservative $0.1517256 - $0.29178 | Optimistic $0.29178 - $0.3676428
Mid-term Prediction (2028-2029)
- ROA may enter a gradual growth phase, with projected prices ranging from $0.006744079794375 to $0.013218396396975
- TRX may enter a consolidation phase, with projected prices ranging from $0.19357356294 to $0.4809114429462
- Key drivers: institutional capital inflows, ETF developments, ecosystem expansion
Long-term Prediction (2030-2031)
- ROA: Base scenario $0.007773675976316 - $0.011105251394737 | Optimistic scenario $0.011105251394737 - $0.019671287058068
- TRX: Base scenario $0.278388924949086 - $0.515535046202011 | Optimistic scenario $0.515535046202011 - $0.588550739440923
View detailed price predictions for ROA and TRX
Disclaimer
ROA:
| Year |
Predicted High Price |
Predicted Average Price |
Predicted Low Price |
Price Change |
| 2026 |
0.00798969 |
0.006099 |
0.00414732 |
0 |
| 2027 |
0.0085941009 |
0.007044345 |
0.00443793735 |
15 |
| 2028 |
0.010164989835 |
0.00781922295 |
0.0075846462615 |
28 |
| 2029 |
0.013218396396975 |
0.0089921063925 |
0.006744079794375 |
47 |
| 2030 |
0.015658404466579 |
0.011105251394737 |
0.007773675976316 |
82 |
| 2031 |
0.019671287058068 |
0.013381827930658 |
0.008698188154928 |
119 |
TRX:
| Year |
Predicted High Price |
Predicted Average Price |
Predicted Low Price |
Price Change |
| 2026 |
0.3676428 |
0.29178 |
0.1517256 |
0 |
| 2027 |
0.349494084 |
0.3297114 |
0.300037374 |
13 |
| 2028 |
0.46865178396 |
0.339602742 |
0.19357356294 |
16 |
| 2029 |
0.4809114429462 |
0.40412726298 |
0.3596732640522 |
38 |
| 2030 |
0.588550739440923 |
0.4425193529631 |
0.415968191785314 |
51 |
| 2031 |
0.582554602208272 |
0.515535046202011 |
0.278388924949086 |
76 |
IV. Investment Strategy Comparison: ROA vs TRX
Long-term vs Short-term Investment Strategies
- ROA CORE: May appeal to investors interested in emerging Web3 ecosystems and data-driven value creation models, particularly those with higher risk tolerance for early-stage projects with significant volatility patterns.
- TRON: May suit investors seeking established blockchain infrastructure exposure with relatively more stable price performance and substantial trading liquidity in the cryptocurrency market.
Risk Management and Asset Allocation
- Conservative Investors: ROA 10-20% vs TRX 80-90% allocation could reflect preference for established assets with lower volatility profiles
- Aggressive Investors: ROA 40-50% vs TRX 50-60% allocation may indicate willingness to accept higher volatility for potential growth opportunities
- Hedging Tools: Stablecoin allocation, options strategies, and cross-asset portfolio diversification represent common risk management approaches
V. Potential Risk Comparison
Market Risk
- ROA CORE: Demonstrated substantial price corrections from peak levels ($0.1785 to $0.005711), indicating elevated volatility and liquidity constraints with 24-hour trading volume of $21,423.37
- TRON: Exhibits more moderate price fluctuations with significantly higher trading volume ($3,077,509.05), though remains subject to broader cryptocurrency market sentiment (Fear & Greed Index: 26)
Technical Risk
- ROA CORE: Scalability considerations and network stability assessments remain relevant for emerging Web3 ecosystem infrastructure
- TRON: Network capacity, transaction throughput performance, and smart contract security considerations affect blockchain infrastructure platforms
Regulatory Risk
- Global regulatory developments affect both assets differently, with established platforms potentially facing more immediate compliance requirements while emerging projects may encounter evolving regulatory frameworks
VI. Conclusion: Which Is the Better Buy?
📌 Investment Value Summary:
- ROA CORE Characteristics: Represents emerging Web3 ecosystem positioning with data-driven value models, though accompanied by substantial price volatility and limited trading liquidity
- TRON Characteristics: Offers established blockchain infrastructure with relatively stable price performance, significant trading volume, and broader market recognition since 2017
✅ Investment Considerations:
- Novice Investors: May consider established assets with higher liquidity and more moderate volatility patterns as initial exposure to cryptocurrency markets
- Experienced Investors: Could evaluate portfolio allocation based on risk tolerance, with potential diversification across different market capitalization segments and ecosystem maturity levels
- Institutional Investors: May assess fundamental metrics including liquidity depth, regulatory compliance frameworks, and ecosystem development trajectories when evaluating allocation decisions
⚠️ Risk Disclosure: Cryptocurrency markets demonstrate substantial volatility. This content does not constitute investment advice. Investors should conduct independent research and consider their risk tolerance before making investment decisions.
VII. FAQ
Q1: What are the main differences between ROA CORE and TRON in terms of market maturity?
TRON is significantly more established, having launched in 2017 with a current trading volume of $3,077,509.05, while ROA CORE is an emerging project from 2023 with substantially lower liquidity at $21,423.37 in 24-hour volume. TRON operates as a recognized blockchain infrastructure platform with broader market adoption, whereas ROA CORE positions itself as a Web3 ecosystem focused on transforming everyday behaviors into data-driven value. This maturity gap translates to TRON offering more stable price performance near $0.29174, compared to ROA CORE's higher volatility, having declined from $0.1785 to $0.005711 during its brief market history.
Q2: Which asset demonstrates better price stability based on historical performance?
TRON exhibits considerably better price stability with more moderate fluctuations from its all-time high of $0.431288 (December 2024) to its current price of $0.29174. In contrast, ROA CORE has experienced extreme volatility, declining approximately 96.8% from its peak of $0.1785 (December 2023) to its low of $0.005711 (December 2025). The significant difference in trading volumes—TRON's $3.08 million versus ROA CORE's $21,423—further supports TRON's superior liquidity and price stability, making it generally more suitable for investors seeking lower volatility exposure in cryptocurrency markets.
Q3: What are the projected price ranges for ROA and TRX by 2030?
By 2030, ROA CORE's projected price range spans from a conservative low of $0.007773675976316 to an optimistic high of $0.019671287058068, representing potential growth but remaining well below its 2023 peak. TRON's 2030 projections range from $0.278388924949086 to $0.588550739440923, suggesting potential appreciation from current levels while approaching its historical high. These predictions indicate TRON may offer more substantial absolute price targets, though both assets' forecasts depend on market conditions, institutional adoption, ecosystem development, and broader cryptocurrency market sentiment during the 2026-2030 period.
Q4: How should different investor types approach allocation between ROA and TRX?
Conservative investors might consider a 10-20% allocation to ROA CORE versus 80-90% to TRON, prioritizing established assets with lower volatility and higher liquidity profiles. Aggressive investors with higher risk tolerance could allocate 40-50% to ROA CORE and 50-60% to TRON, accepting greater volatility for potential growth opportunities in emerging Web3 ecosystems. Novice investors should generally favor established assets like TRON with more moderate price fluctuations and substantial trading volume, while experienced investors can evaluate portfolio diversification based on individual risk tolerance, market knowledge, and investment timeframes across different maturity segments.
Q5: What are the primary risk factors distinguishing ROA CORE from TRON?
ROA CORE's primary risks include substantial price volatility (96.8% decline from peak), limited liquidity with only $21,423 in 24-hour volume, and uncertainties surrounding its emerging Web3 ecosystem model requiring market validation. TRON's risks, while more moderate, include exposure to broader cryptocurrency market sentiment (current Fear & Greed Index: 26), potential regulatory developments affecting established blockchain platforms, and technical considerations regarding network capacity and smart contract security. The liquidity differential represents perhaps the most significant practical risk distinction, with ROA CORE's limited trading volume potentially creating challenges for position entry and exit at desired price levels.
Q6: Does either asset show stronger institutional adoption potential?
TRON demonstrates stronger current institutional positioning due to its established infrastructure since 2017, substantial trading volume ($3.08 million daily), and recognition as a blockchain platform with proven operational history. Its relatively stable price performance and higher liquidity facilitate institutional allocation and position management. ROA CORE's institutional appeal remains speculative, dependent on successful ecosystem development and market validation of its data-driven value creation model. Institutional investors typically prioritize liquidity depth, regulatory compliance frameworks, and operational track records—areas where TRON currently maintains significant advantages over the emerging ROA CORE project.
Q7: What market conditions would favor ROA CORE over TRON as an investment?
ROA CORE might outperform TRON during periods favoring high-risk, high-reward emerging projects, particularly if Web3 ecosystem adoption accelerates and its data-driven value model gains market validation. Strong cryptocurrency bull markets with abundant risk appetite, increased institutional interest in early-stage blockchain projects, and successful development milestones could support ROA CORE's case. Additionally, if TRON faces specific challenges related to regulatory pressure, competitive threats, or technical limitations while ROA CORE demonstrates ecosystem growth and improved liquidity, the risk-reward profile could shift. However, given current market conditions (Fear & Greed Index: 26) and ROA CORE's substantial volatility history, such scenarios represent higher-risk opportunities requiring careful evaluation.
Q8: How do the supply mechanisms and tokenomics differ between these assets?
While the provided analysis focuses primarily on price performance, market positioning, and trading metrics, detailed supply mechanism comparisons require examination of each project's tokenomics documentation. Generally, established projects like TRON have well-documented token distribution, inflation schedules, and utility functions within their ecosystem, providing transparency for investment analysis. Emerging projects like ROA CORE may have evolving tokenomics as their ecosystems develop. Investors should independently research each asset's total supply, circulating supply, emission schedules, token utility, staking mechanisms, and burn programs to understand how supply dynamics may influence long-term price potential and investment value beyond the price predictions and market metrics presented in this comparison.
* The information is not intended to be and does not constitute financial advice or any other recommendation of any sort offered or endorsed by Gate.