This comprehensive article compares S, an EVM L1 DeFi platform with 10,000 TPS throughput, against XLM, an established payment settlement network operational since 2014. Analyzing price performance, tokenomics, and institutional adoption on Gate, it examines how S declined 93.5% from $1.03 to $0.08492, while XLM maintains $0.23311 with stronger institutional presence and $986 million in real-world assets. The guide addresses investment strategy differentiation based on risk profiles, evaluates technical advantages, supply mechanisms, and regulatory considerations for both assets. Suitable for investors evaluating DeFi infrastructure exposure versus cross-border payment network participation, this analysis provides structured decision-making frameworks for portfolio allocation between emerging and established blockchain platforms.
Introduction: S vs XLM Investment Comparison
In the cryptocurrency market, the comparison between S and XLM remains a central topic for investors. Both assets exhibit notable differences in market capitalization ranking, application scenarios, and price performance, representing distinct positioning within the crypto asset landscape.
S (Sonic): Launched as an EVM L1 platform, it has gained market attention through its focus on DeFi infrastructure, offering 10,000 TPS throughput and sub-second finality.
XLM (Stellar): Operating since 2014, it has been recognized for its decentralized gateway facilitating transfers between digital and fiat currencies, enabling low-cost asset movement across banks, payment institutions, and individuals.
This article will provide a comprehensive analysis of the S vs XLM investment value comparison, examining historical price trends, supply mechanisms, institutional adoption, technological ecosystems, and future outlook, attempting to address investors' most pressing question:
"Which is the better buy right now?"
I. Price History Comparison and Market Status
S (Sonic) and XLM (Stellar) Historical Price Trends
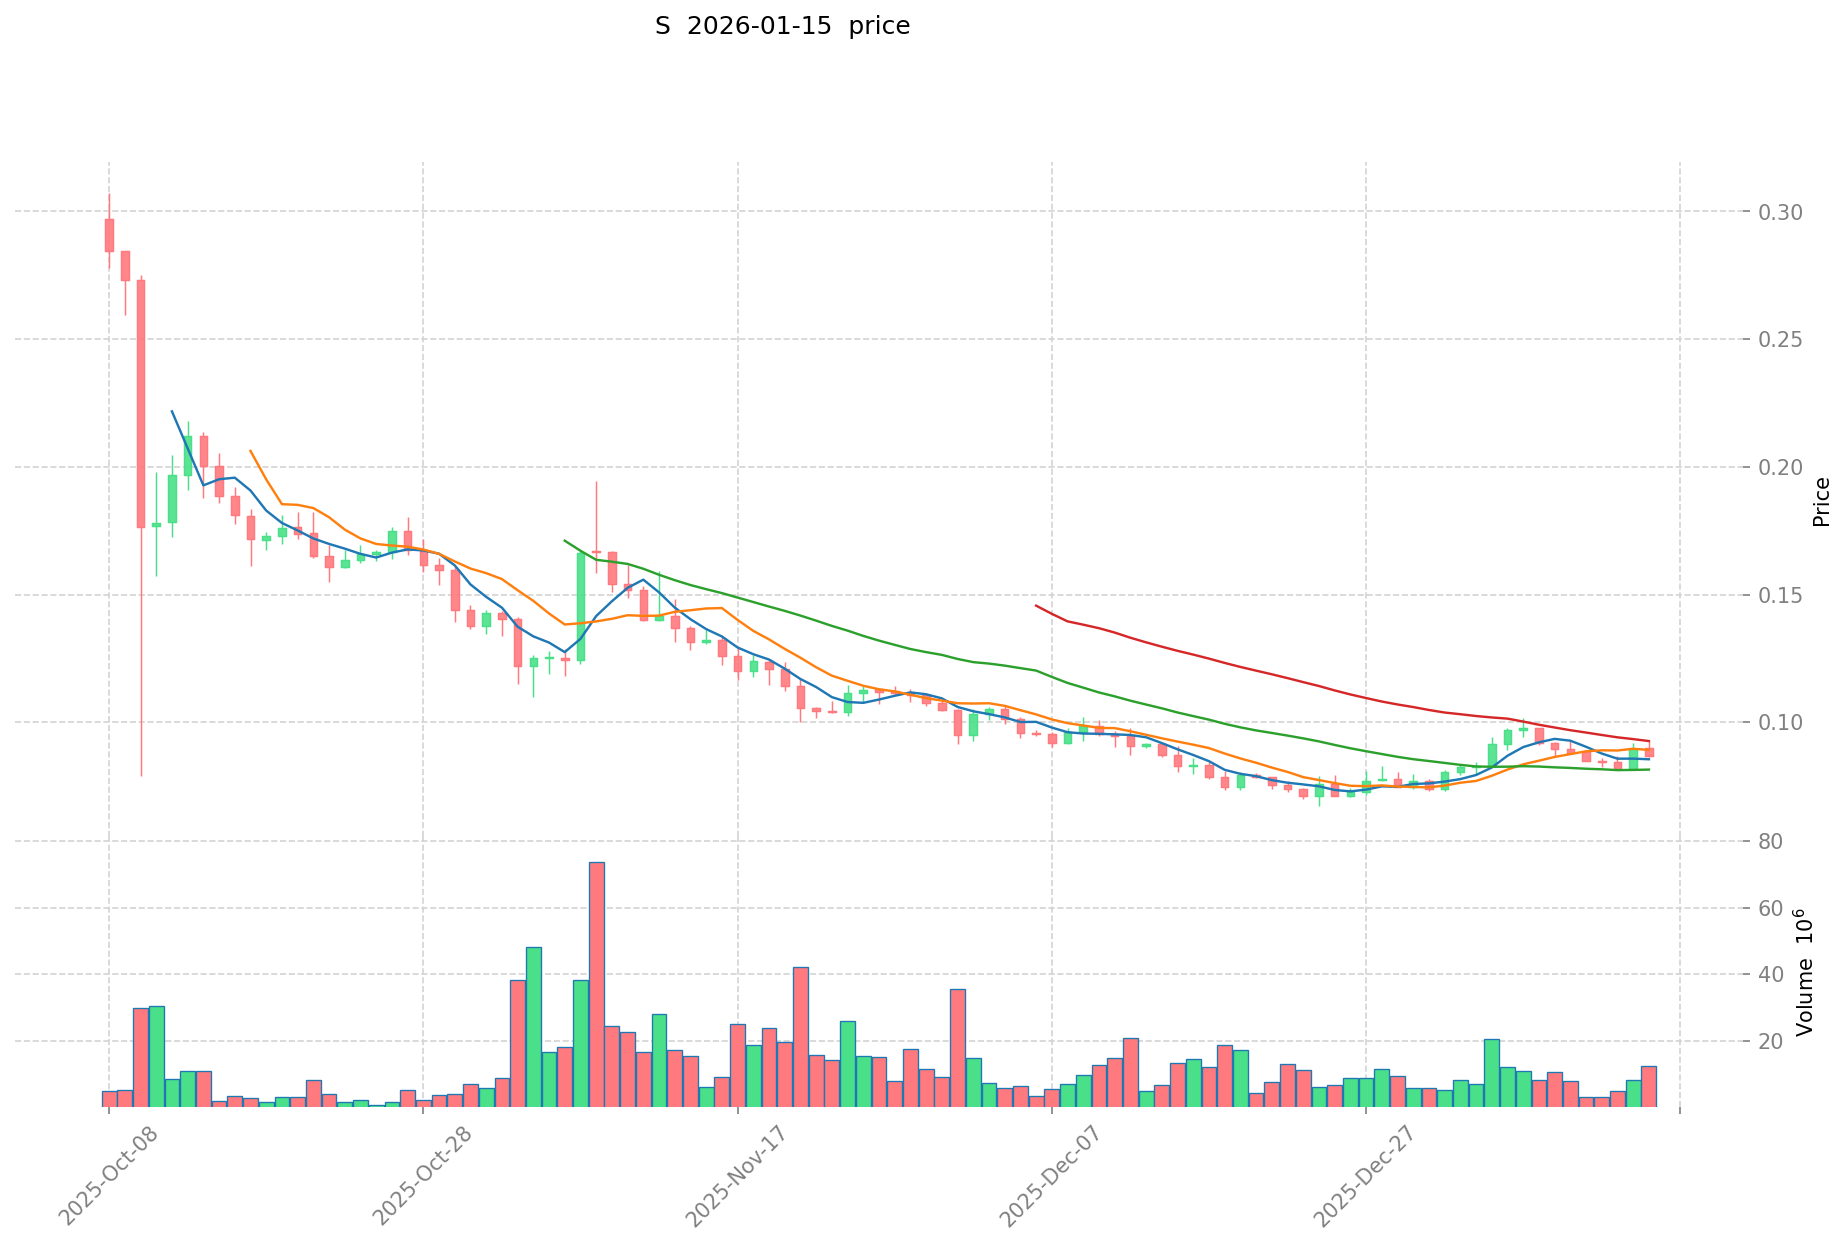
- 2025: S experienced significant volatility after its launch, with price reaching $1.03 in early January 2025 before declining.
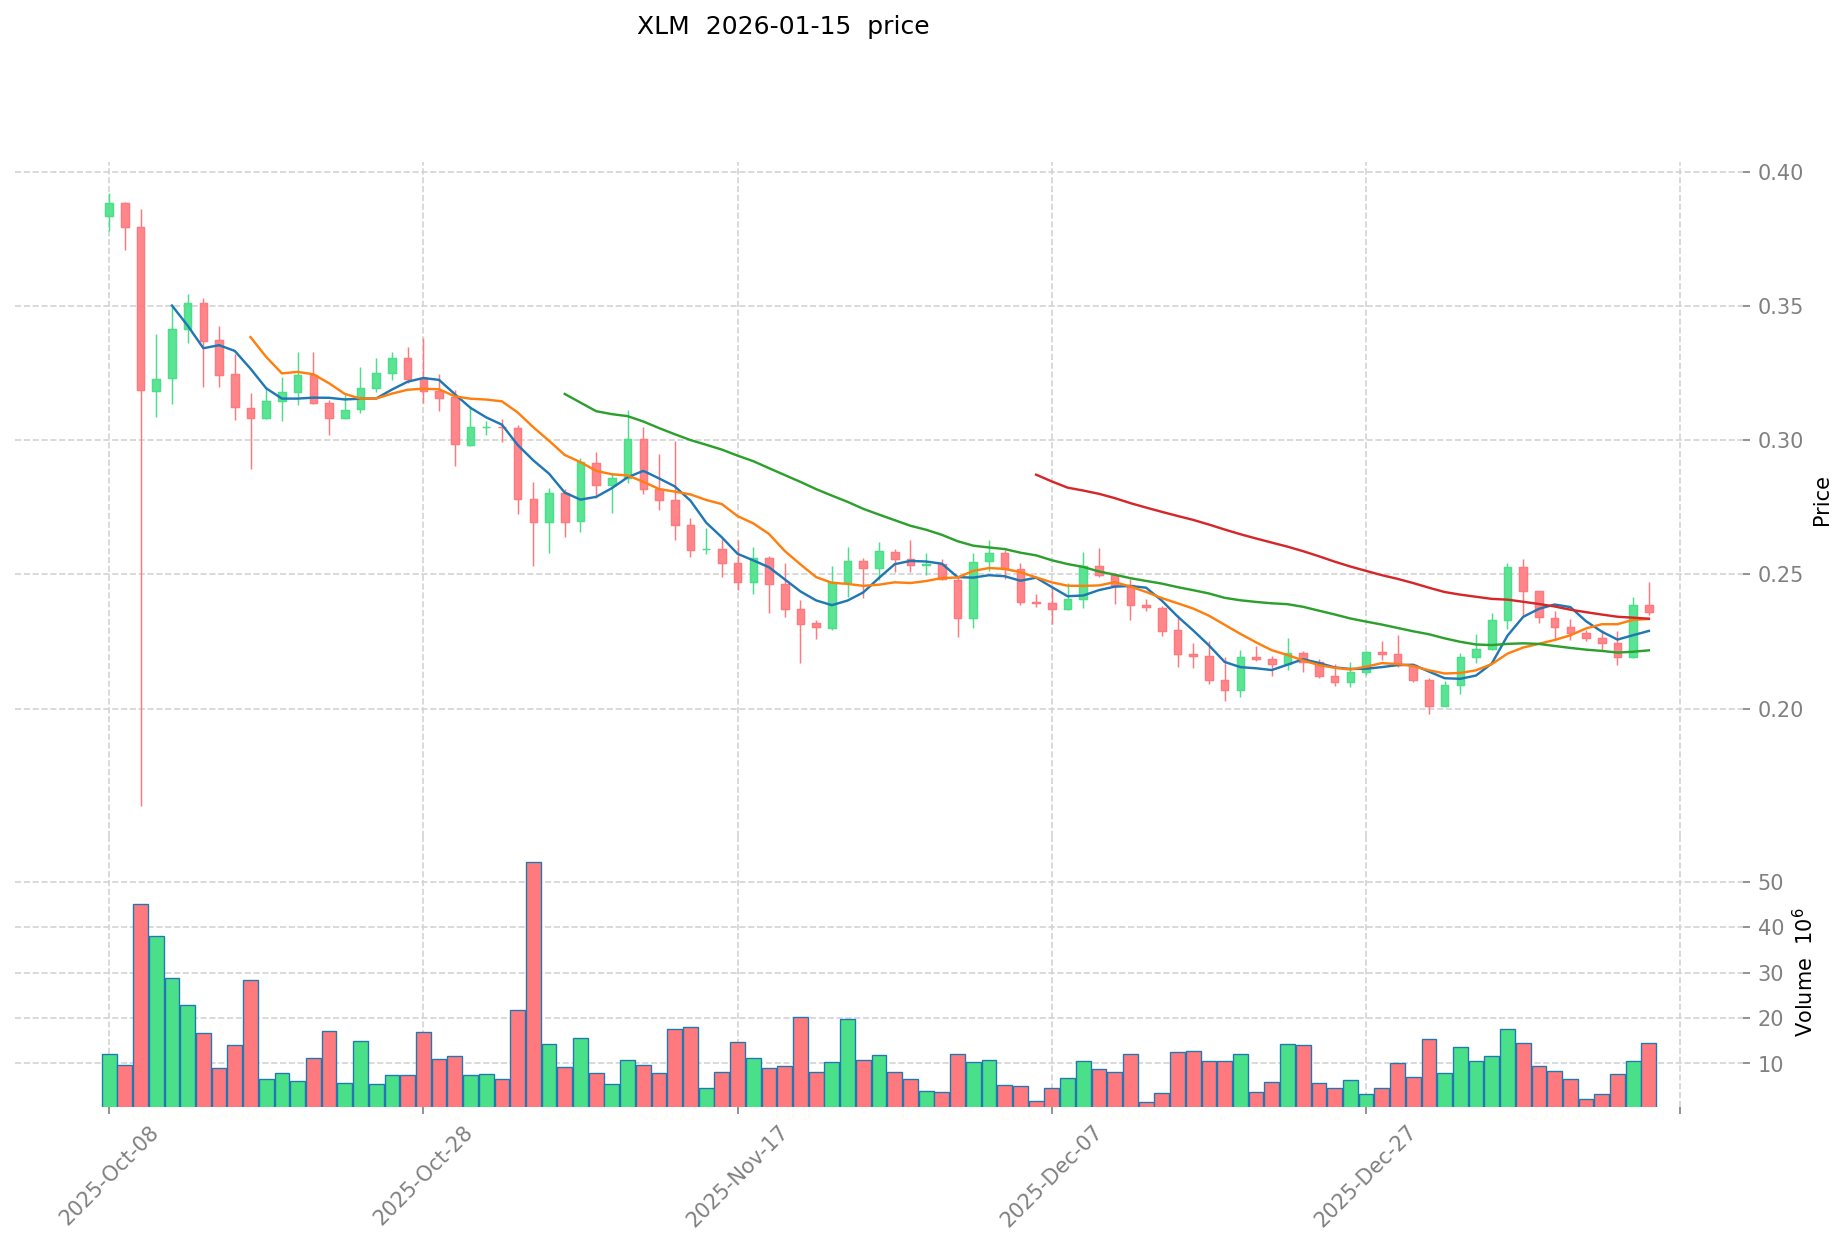
- 2018: XLM was influenced by broader cryptocurrency market expansion, with price reaching its all-time high of $0.88.
- Comparative Analysis: During the 2025 market cycle, S declined from $1.03 to $0.067, showing a drop of approximately 93.5%, while XLM maintained relatively stable trading within its historical range, demonstrating more established market resilience.
Current Market Situation (2026-01-15)
- S current price: $0.08492
- XLM current price: $0.23311
- 24-hour trading volume: S $1,174,516.82 vs XLM $2,136,086.77
- Market Sentiment Index (Fear & Greed Index): 61 (Greed)
Click to view real-time prices:
- View S current price Market Price
- View XLM current price Market Price
II. Core Factors Influencing S vs XLM Investment Value
Supply Mechanism Comparison (Tokenomics)
- S: Information regarding the supply mechanism of S is not available in the provided materials.
- XLM: XLM features a fixed supply model without unlimited issuance, which helps avoid inflation risks and maintains long-term scarcity. The initial allocation structure aligns with Stellar's core design requirements, where each account on the network must hold a minimum XLM balance. Currently, active accounts have exceeded 7.5 million, and these technical rules strengthen network stability while conferring practical utility to XLM.
- 📌 Historical Pattern: Fixed supply mechanisms may contribute to value stability over extended periods by limiting supply-side pressure.
Institutional Adoption and Market Application
- Institutional Holdings: According to October 2025 data, Grayscale accumulated holdings of 120 million XLM tokens. The Chaikin Money Flow (CMF) indicator registered -0.03 during the same period, contributing to a 7.1% price decline, demonstrating the direct impact of capital flows on valuation.
- Enterprise Adoption: Stellar positions itself as a payment settlement network widely applied in cross-border payments and asset circulation. XLM serves as the "fuel" and "bridge asset" within the network, ensuring smooth transactions at low costs. The network has become a partner for multiple global financial institutions and payment companies, gradually establishing its position in international remittance and digital financial infrastructure. In 2021, Stellar announced a collaboration with Ukraine's central bank on a digital currency pilot project.
- National Policies: Regulatory developments influence XLM's price performance, though specific comparative policy stances between different jurisdictions were not detailed in the available materials.
Technology Development and Ecosystem Building
- S Technology Upgrades: Relevant information is not available in the provided materials.
- XLM Technology Development: Stellar's transaction costs are minimal at only 0.00001 XLM per transaction, preventing spam transactions while maintaining competitive advantages in cross-border payments. Transactions complete on average within 2-5 seconds, significantly faster than Bitcoin (approximately 10 minutes with higher fees) and Ethereum (15-30 seconds with volatile gas costs).
- Ecosystem Comparison: Stellar's network supports issuance and circulation of multiple assets, allowing financial institutions to issue stablecoins or tokenized assets (RWA) that operate alongside XLM. The real-world asset value on the Stellar network has reached approximately $986 million. Technical indicators on XLM's daily chart show a bullish inverse head-and-shoulders pattern formation.
Macroeconomic Environment and Market Cycles
- Performance Under Inflation: Information regarding comparative anti-inflation properties is not available in the provided materials.
- Macroeconomic Monetary Policy: XLM's price performance in 2026 is influenced by supply-demand dynamics, market sentiment, regulatory policies, and institutional adoption. The macroeconomic environment plays an important role, though specific impacts of interest rates and dollar index movements were not detailed in the materials.
- Geopolitical Factors: XLM's price correlation with BTC and ETH remains significant. As a cross-border payment-focused asset, demand for international transactions may influence valuation, though specific geopolitical event impacts were not documented in the available materials.
III. 2026-2031 Price Forecast: S vs XLM
Short-term Forecast (2026)
- S: Conservative $0.059605 - $0.08515 | Optimistic $0.08515 - $0.1064375
- XLM: Conservative $0.1897101 - $0.23421 | Optimistic $0.23421 - $0.2482626
Mid-term Forecast (2028-2029)
- S may enter a growth phase with estimated prices ranging from $0.083148975 to $0.17373384405 by 2029
- XLM may enter a consolidation phase with estimated prices ranging from $0.186259451866125 to $0.382678510197675 by 2029
- Key drivers: institutional capital inflows, ETF developments, ecosystem expansion
Long-term Forecast (2031)
- S: Baseline scenario $0.108817397960163 - $0.178389176983875 | Optimistic scenario $0.178389176983875 - $0.196228094682262
- XLM: Baseline scenario $0.27250121860579 - $0.394929302327233 | Optimistic scenario $0.394929302327233 - $0.556850316281398
View detailed price predictions for S and XLM
Disclaimer
S:
| Year |
Predicted High Price |
Predicted Average Price |
Predicted Low Price |
Price Change |
| 2026 |
0.1064375 |
0.08515 |
0.059605 |
0 |
| 2027 |
0.14177475 |
0.09579375 |
0.0718453125 |
12 |
| 2028 |
0.125911305 |
0.11878425 |
0.083148975 |
39 |
| 2029 |
0.17373384405 |
0.1223477775 |
0.10521908865 |
44 |
| 2030 |
0.20873754319275 |
0.148040810775 |
0.1036285675425 |
74 |
| 2031 |
0.196228094682262 |
0.178389176983875 |
0.108817397960163 |
110 |
XLM:
| Year |
Predicted High Price |
Predicted Average Price |
Predicted Low Price |
Price Change |
| 2026 |
0.2482626 |
0.23421 |
0.1897101 |
0 |
| 2027 |
0.340143183 |
0.2412363 |
0.233999211 |
3 |
| 2028 |
0.386617356195 |
0.2906897415 |
0.206389716465 |
24 |
| 2029 |
0.382678510197675 |
0.3386535488475 |
0.186259451866125 |
45 |
| 2030 |
0.429192575131879 |
0.360666029522587 |
0.299352804503747 |
54 |
| 2031 |
0.556850316281398 |
0.394929302327233 |
0.27250121860579 |
69 |
IV. Investment Strategy Comparison: S vs XLM
Long-term vs Short-term Investment Strategies
-
S: May suit investors focusing on emerging DeFi infrastructure potential and seeking higher risk-reward profiles in early-stage blockchain platforms. The asset's significant volatility following its 2025 launch suggests it may appeal to traders comfortable with substantial price fluctuations and longer recovery periods.
-
XLM: May suit investors prioritizing established payment network infrastructure and cross-border transaction utility. With operational history since 2014 and institutional partnerships, XLM demonstrates characteristics that could appeal to investors seeking exposure to practical blockchain applications in financial services.
Risk Management and Asset Allocation
-
Conservative Investors: S 20-30% vs XLM 70-80% - Lower allocation to S reflects its limited operational history and higher volatility profile, while higher XLM allocation considers its established market presence and institutional adoption.
-
Aggressive Investors: S 50-60% vs XLM 40-50% - Increased S allocation may reflect willingness to accept higher volatility in exchange for potential recovery from current depressed levels, while maintaining XLM exposure for portfolio stability.
-
Hedging Tools: Stablecoin allocation for liquidity management, options strategies for downside protection, cross-asset portfolio construction combining different risk profiles to balance exposure.
V. Potential Risk Comparison
Market Risks
-
S: The asset experienced approximately 93.5% decline from its early 2025 peak of $1.03 to $0.067, demonstrating substantial downside volatility. Limited trading volume of $1,174,516.82 compared to XLM suggests lower liquidity, which may amplify price movements during market stress.
-
XLM: Price correlation with BTC and ETH exposes holders to broader cryptocurrency market movements. The CMF indicator reading of -0.03 in October 2025 coincided with a 7.1% price decline, illustrating sensitivity to capital flow dynamics. Institutional holdings by entities such as Grayscale introduce concentration risks.
Technical Risks
-
S: The platform's 10,000 TPS throughput and sub-second finality specifications require consistent network performance validation over extended periods. As a newer platform, long-term scalability under sustained high transaction volumes remains to be demonstrated.
-
XLM: Network stability has been demonstrated through years of operation, with transaction completion averaging 2-5 seconds. The technical requirement for minimum XLM balance per account introduces potential friction in network adoption. The approximately $986 million in real-world assets on the network creates dependencies on proper tokenization infrastructure.
Regulatory Risks
- Regulatory developments influence both assets differently based on their use cases. XLM's positioning in cross-border payments and collaboration with financial institutions, including the 2021 digital currency pilot project with Ukraine's central bank, subjects it to payment and banking regulations across multiple jurisdictions. S's DeFi infrastructure focus may encounter evolving regulatory frameworks governing decentralized finance applications. International regulatory harmonization efforts and jurisdiction-specific policy changes could affect operational parameters and market accessibility for both assets.
VI. Conclusion: Which Is the Better Buy?
📌 Investment Value Summary:
-
S Characteristics: Represents emerging DeFi infrastructure with technical specifications including 10,000 TPS throughput. Currently trading at $0.08492, significantly below its early 2025 level of $1.03. Price forecasts suggest potential recovery scenarios, though substantial uncertainty remains given limited operational track record.
-
XLM Characteristics: Established payment network operational since 2014 with demonstrated institutional adoption, including Grayscale holdings of 120 million tokens as of October 2025. Currently priced at $0.23311 with higher trading volume of $2,136,086.77. Fixed supply mechanism and minimal transaction costs of 0.00001 XLM support utility within cross-border payment infrastructure. Network supports over 7.5 million active accounts and approximately $986 million in real-world assets.
✅ Investment Considerations:
-
New Investors: May consider starting with XLM due to its longer operational history, established use cases in payment infrastructure, and demonstrated institutional involvement. The asset's characteristics suggest potentially lower learning curve regarding fundamental value drivers compared to emerging platforms.
-
Experienced Investors: Could evaluate portfolio allocation between both assets based on risk tolerance and thesis regarding DeFi infrastructure development versus payment network adoption. Historical performance patterns, institutional adoption trajectories, and technical ecosystem maturation may inform allocation decisions.
-
Institutional Investors: May find XLM's established partnerships with financial institutions and central bank collaboration history relevant for due diligence frameworks. S's DeFi infrastructure positioning could align with portfolios seeking exposure to emerging blockchain infrastructure, subject to appropriate risk assessment protocols.
⚠️ Risk Disclosure: Cryptocurrency markets exhibit extreme volatility. This content does not constitute investment advice. Investors should conduct independent research and consult qualified financial advisors before making investment decisions.
VII. FAQ
Q1: What are the main differences between S and XLM in terms of their core use cases?
S functions as an EVM L1 platform focused on DeFi infrastructure with 10,000 TPS throughput and sub-second finality, while XLM operates as a payment settlement network facilitating cross-border transactions and asset circulation between digital and fiat currencies. The fundamental distinction lies in their positioning: S targets decentralized finance applications requiring high-performance smart contract execution, whereas XLM serves as infrastructure for international remittances and digital financial services, with minimal transaction costs of 0.00001 XLM and 2-5 second settlement times.
Q2: How does institutional adoption differ between S and XLM?
XLM demonstrates significantly more established institutional adoption, with Grayscale holding 120 million XLM tokens as of October 2025 and partnerships with multiple global financial institutions. The network's collaboration with Ukraine's central bank on a digital currency pilot project in 2021 illustrates recognition at the governmental level. In contrast, information regarding institutional involvement with S remains limited in available documentation, reflecting its recent market entry in 2025 compared to XLM's operational history since 2014.
Q3: Which asset exhibits greater price volatility and what are the implications?
S demonstrates substantially higher volatility, experiencing approximately 93.5% decline from its early 2025 peak of $1.03 to $0.067. XLM maintained relatively stable trading within its historical range during the same period, with current price at $0.23311 compared to its all-time high of $0.88 in 2018. This volatility differential suggests S may suit investors with higher risk tolerance seeking potential recovery opportunities, while XLM's stability characteristics may appeal to those prioritizing capital preservation and steady exposure to payment infrastructure adoption.
Q4: How do the supply mechanisms of S and XLM affect their long-term value proposition?
XLM features a fixed supply model without unlimited issuance, which helps avoid inflation risks and maintains long-term scarcity. This mechanism, combined with the technical requirement for minimum XLM balance across over 7.5 million active accounts, creates sustained baseline demand. Information regarding S's supply mechanism was not available in provided materials, making comparative analysis of inflationary pressures and tokenomics-driven value accrual difficult. Fixed supply models historically contribute to value stability over extended periods by limiting supply-side pressure.
Q5: What regulatory considerations should investors evaluate for S versus XLM?
XLM faces regulatory scrutiny related to cross-border payments, banking partnerships, and its collaboration with financial institutions across multiple jurisdictions. Its 2021 digital currency pilot project with Ukraine's central bank subjects it to governmental oversight frameworks. S's DeFi infrastructure positioning encounters evolving regulatory frameworks governing decentralized finance applications, which remain less defined than payment network regulations. Investors should monitor jurisdiction-specific policy developments, international regulatory harmonization efforts, and compliance requirements that may affect operational parameters and market accessibility for both assets differently.
Q6: How should portfolio allocation between S and XLM differ based on investor profiles?
Conservative investors may consider 20-30% allocation to S versus 70-80% to XLM, reflecting S's limited operational history and higher volatility profile against XLM's established market presence. Aggressive investors could evaluate 50-60% S allocation versus 40-50% XLM, accepting higher volatility for potential recovery from depressed levels while maintaining XLM for stability. This differentiation accounts for risk tolerance, investment time horizons, and thesis regarding DeFi infrastructure development versus payment network adoption trajectories.
Q7: What are the key technical advantages that differentiate these assets?
S offers 10,000 TPS throughput with sub-second finality, positioning it for high-frequency DeFi applications requiring rapid transaction processing. XLM provides 2-5 second transaction completion at minimal cost (0.00001 XLM), significantly faster and cheaper than Bitcoin (approximately 10 minutes with higher fees) and Ethereum (15-30 seconds with volatile gas costs). XLM's network supports multi-asset issuance and circulation, enabling financial institutions to deploy stablecoins and tokenized real-world assets, with approximately $986 million in RWA value currently operating on the network.
Q8: What price trajectory scenarios should investors consider for 2026-2031?
For 2026, S projects conservative range of $0.059605 - $0.08515 versus XLM's $0.1897101 - $0.23421. By 2031, S baseline scenario estimates $0.108817 - $0.178389 (optimistic up to $0.196228), while XLM projects $0.27250 - $0.394929 (optimistic up to $0.556850). These forecasts reflect different growth trajectories: S shows potential recovery from current depressed levels with higher percentage gains but greater uncertainty, while XLM demonstrates steadier appreciation aligned with payment infrastructure adoption and institutional involvement expansion. Investors should evaluate these projections against risk tolerance and portfolio objectives.
* The information is not intended to be and does not constitute financial advice or any other recommendation of any sort offered or endorsed by Gate.