This comprehensive guide compares SAGA and ENJ, two leading blockchain gaming tokens reshaping the metaverse economy. SAGA, a Layer 1 protocol launched in 2024, offers infrastructure scalability through Chainlets with 350 projects (80% gaming-focused), currently trading at $0.05065. ENJ, operational since 2017, provides established gaming and virtual goods solutions with 18.7 million registered players, trading at $0.03139. The article analyzes historical price trends, tokenomics, institutional adoption, and 2026-2031 price forecasts for both assets. SAGA presents higher growth potential with 34.37% token circulation, while ENJ offers stability through full circulation and proven market presence. Investment recommendations vary by profile: conservative investors favor ENJ's established track record; aggressive investors may pursue SAGA's asymmetric upside. Both tokens face extreme market fear (index: 24) and regulatory uncertainties requiring careful risk assessment. The analysis provides actionable strategie
Introduction: Investment Comparison Between SAGA and ENJ
In the cryptocurrency market, the comparison between SAGA vs ENJ has become an inevitable topic for investors. The two not only show significant differences in market cap ranking, application scenarios, and price performance, but also represent distinct positioning in the crypto asset landscape.
SAGA (SAGA): Launched in 2024, it has gained market recognition through its positioning as a Layer 1 protocol that enables developers to automatically launch parallelized and interoperable dedicated chains called "Chainlets," providing applications with scalability solutions. Within less than 2 years, Saga's ecosystem has grown to 350 projects building on its protocol, with 80% focusing on gaming.
ENJ (ENJ): Since its launch in 2017, it has been recognized as a blockchain solution for gaming and virtual goods, operating as part of the largest online gaming community creation platform. With over 18.7 million registered players and monthly visits from approximately 60 million global gamers, ENJ allows players, content creators, and game publishers to add virtual goods and provide value to games and communities.
This article will comprehensively analyze the investment value comparison of SAGA vs ENJ around historical price trends, supply mechanisms, institutional adoption, technical ecosystems, and future predictions, attempting to answer the question that investors care about most:
"Which is the better buy right now?"
I. Historical Price Comparison and Current Market Status
SAGA and ENJ Historical Price Trends
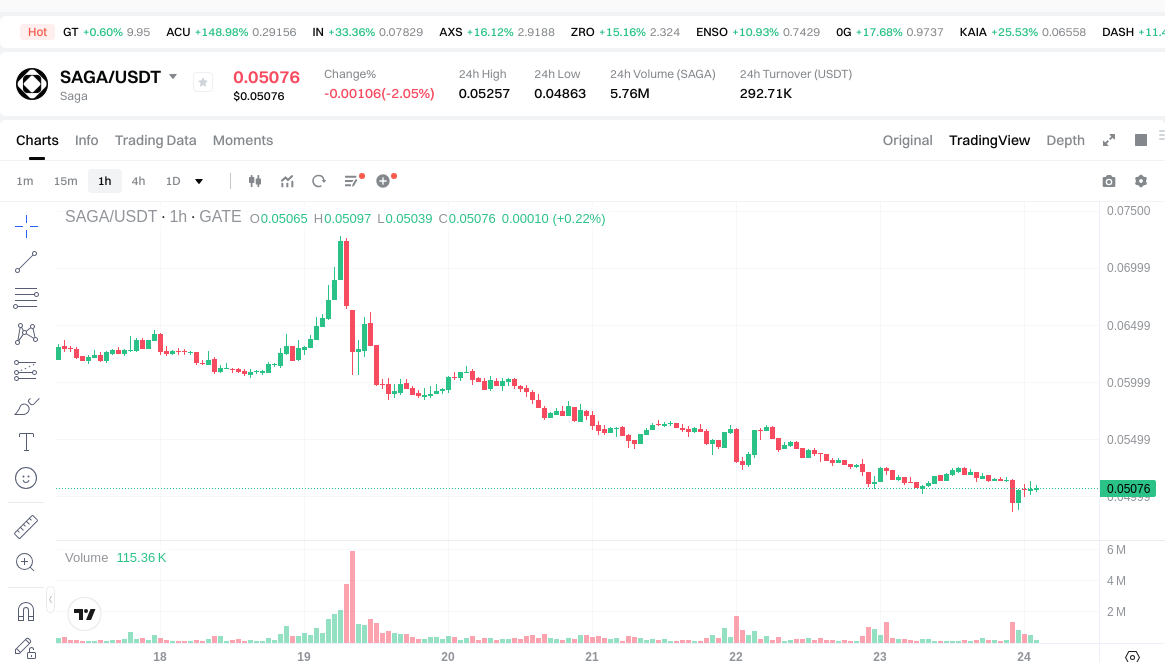
- 2024: SAGA reached its all-time high of $7.8609 on April 9, 2024, shortly after its launch in April 2024, reflecting strong initial market interest in its Layer 1 protocol infrastructure.
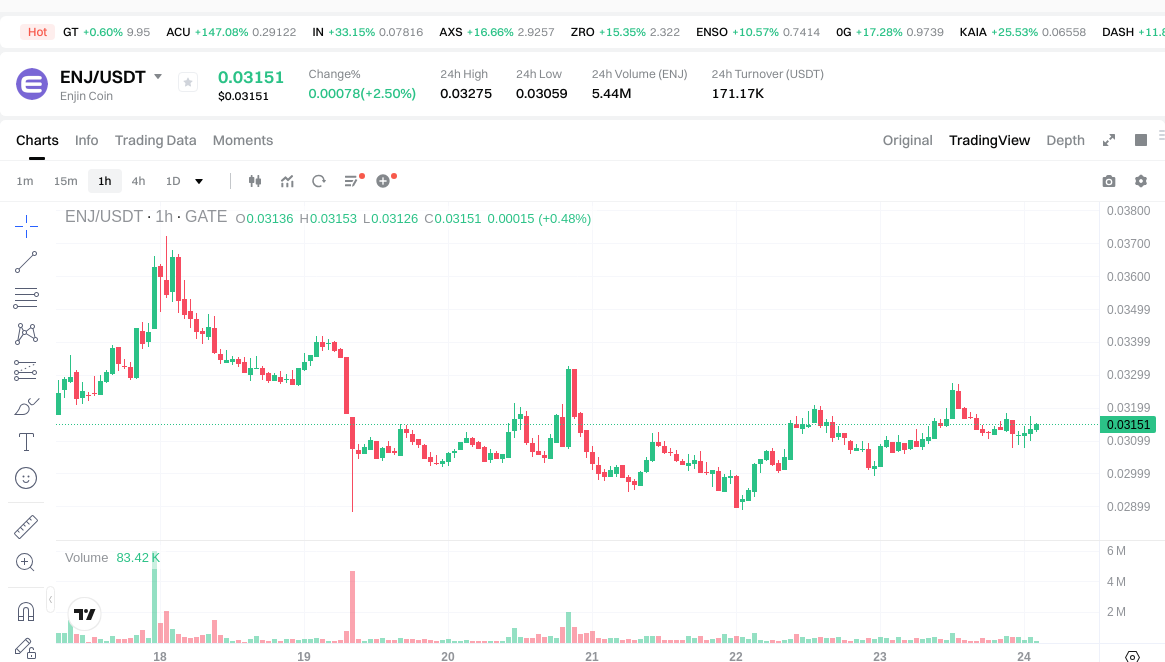
- 2021: ENJ experienced significant price appreciation, reaching its all-time high of $4.82 on November 25, 2021, driven by the NFT and gaming boom during that period.
- 2025: SAGA recorded its all-time low of $0.0438 on October 10, 2025, representing a substantial decline from its peak.
- 2017: ENJ established its all-time low of $0.01865964 on November 12, 2017, during its early market entry phase.
- Comparative analysis: During the recent market cycle, SAGA declined approximately 99.36% from its high of $7.8609 to its low of $0.0438, while ENJ experienced an approximate 99.61% decline from its peak of $4.82 to its low of $0.01865964. Both assets have demonstrated significant volatility, with SAGA showing a more compressed timeframe for its price discovery compared to ENJ's longer market history.
Current Market Status (January 24, 2026)
- SAGA current price: $0.05065
- ENJ current price: $0.03139
- 24-hour trading volume: SAGA $289,917.15 vs ENJ $171,831.97
- Market Sentiment Index (Fear & Greed Index): 24 (Extreme Fear)
- 24-hour price change: SAGA -2.39%, ENJ +1.81%
- 7-day price change: SAGA -15.49%, ENJ +4.43%
- Market capitalization: SAGA $17,407,145.13 vs ENJ $60,434,288.73
- Circulating supply ratio: SAGA 34.37%, ENJ 100%
View real-time prices:
II. Core Factors Affecting SAGA vs ENJ Investment Value
Supply Mechanism Comparison (Tokenomics)
Due to insufficient reference materials, specific supply mechanism details for SAGA and ENJ cannot be provided at this time.
Institutional Adoption and Market Applications
Institutional Holdings
Insufficient data available in reference materials to compare institutional preference between the two assets.
Enterprise Adoption
Reference materials do not provide sufficient information regarding enterprise-level adoption of SAGA or ENJ in cross-border payments, settlements, or investment portfolios.
National Policies
Specific regulatory attitudes from different jurisdictions toward SAGA and ENJ are not covered in the available reference materials.
Technical Development and Ecosystem Building
SAGA Technical Upgrades
Reference materials do not contain information about recent or planned technical upgrades for SAGA.
ENJ Technical Development
Reference materials do not contain information about recent or planned technical developments for ENJ.
Ecosystem Comparison
Insufficient data available to compare DeFi, NFT, payment systems, and smart contract implementation between SAGA and ENJ ecosystems.
Macroeconomic Environment and Market Cycles
Reference materials do not provide sufficient data to assess which asset demonstrates stronger anti-inflation characteristics.
Macroeconomic Monetary Policy
The impact of interest rates and the US Dollar Index on both SAGA and ENJ cannot be adequately assessed based on available reference materials.
Geopolitical Factors
Insufficient information available regarding how cross-border transaction demand and international situations affect SAGA and ENJ.
III. 2026-2031 Price Forecast: SAGA vs ENJ
Short-term Forecast (2026)
- SAGA: Conservative $0.045828 - $0.05092 | Optimistic $0.05092 - $0.0728156
- ENJ: Conservative $0.0293043 - $0.03151 | Optimistic $0.03151 - $0.0374969
Mid-term Forecast (2028-2029)
- SAGA may enter a growth phase, with estimated price range of $0.05637703275 - $0.11963582196435
- ENJ may enter a consolidation phase, with estimated price range of $0.0182868285 - $0.05963576298
- Key drivers: institutional capital inflows, ETF developments, ecosystem expansion
Long-term Forecast (2030-2031)
- SAGA: Baseline scenario $0.059654380002511 - $0.121365807591316 | Optimistic scenario $0.121365807591316 - $0.139879235867958
- ENJ: Baseline scenario $0.027882186172573 - $0.052607898438817 | Optimistic scenario $0.052607898438817 - $0.073124978829956
View detailed price predictions for SAGA and ENJ
Disclaimer
SAGA:
| Year |
Predicted High Price |
Predicted Average Price |
Predicted Low Price |
Price Change |
| 2026 |
0.0728156 |
0.05092 |
0.045828 |
0 |
| 2027 |
0.088470954 |
0.0618678 |
0.047638206 |
22 |
| 2028 |
0.09696849633 |
0.075169377 |
0.05637703275 |
48 |
| 2029 |
0.11963582196435 |
0.086068936665 |
0.08004411109845 |
69 |
| 2030 |
0.139879235867958 |
0.102852379314675 |
0.059654380002511 |
103 |
| 2031 |
0.125006781819055 |
0.121365807591316 |
0.06553753609931 |
139 |
ENJ:
| Year |
Predicted High Price |
Predicted Average Price |
Predicted Low Price |
Price Change |
| 2026 |
0.0374969 |
0.03151 |
0.0293043 |
0 |
| 2027 |
0.045544554 |
0.03450345 |
0.0182868285 |
9 |
| 2028 |
0.05963576298 |
0.040024002 |
0.02441464122 |
27 |
| 2029 |
0.0528196754394 |
0.04982988249 |
0.0293996306691 |
58 |
| 2030 |
0.053891017912935 |
0.0513247789647 |
0.043626062119995 |
63 |
| 2031 |
0.073124978829956 |
0.052607898438817 |
0.027882186172573 |
67 |
IV. Investment Strategy Comparison: SAGA vs ENJ
Long-term vs Short-term Investment Strategy
-
SAGA: Suitable for investors focused on Layer 1 infrastructure development and gaming ecosystem expansion. With 350 projects building on its protocol and 80% concentrating on gaming applications, SAGA may appeal to those seeking exposure to blockchain scalability solutions and dedicated chain technology. The compressed price discovery timeframe since its 2024 launch suggests higher short-term volatility potential.
-
ENJ: Suitable for investors interested in established gaming and NFT infrastructure with demonstrated market presence. Operating since 2017 with over 18.7 million registered players and approximately 60 million monthly global gamer visits, ENJ may attract those seeking exposure to virtual goods and gaming community platforms with a longer operational track record.
Risk Management and Asset Allocation
-
Conservative investors: SAGA 30% vs ENJ 70% - This allocation reflects ENJ's longer market history and full circulating supply (100%), compared to SAGA's partial circulation (34.37%).
-
Aggressive investors: SAGA 60% vs ENJ 40% - This allocation considers SAGA's potential upside from its lower market capitalization ($17,407,145.13) compared to ENJ ($60,434,288.73) and incomplete token distribution.
-
Hedging tools: Stablecoin allocation for liquidity management, options strategies for downside protection, cross-asset portfolio diversification to mitigate single-asset concentration risk.
V. Potential Risk Comparison
Market Risk
-
SAGA: Trading at $0.05065 with 24-hour volume of $289,917.15, SAGA has experienced a 7-day decline of 15.49%. The current price represents approximately 99.36% below its all-time high of $7.8609 reached in April 2024. With only 34.37% of tokens in circulation, future supply releases may create additional selling pressure. The relatively low market capitalization of $17,407,145.13 suggests susceptibility to price manipulation and liquidity constraints.
-
ENJ: Trading at $0.03139 with 24-hour volume of $171,831.97, ENJ has shown a 7-day gain of 4.43%. The current price remains approximately 99.35% below its November 2021 high of $4.82. With 100% of tokens already circulating, ENJ faces no additional supply-side pressure. However, the market capitalization of $60,434,288.73, while larger than SAGA, still indicates exposure to broader market volatility. The current Market Sentiment Index at 24 (Extreme Fear) affects both assets.
Technical Risk
-
SAGA: As a Layer 1 protocol enabling parallelized and interoperable dedicated chains (Chainlets), SAGA faces scalability challenges inherent to blockchain infrastructure. Network stability depends on the successful deployment and maintenance of multiple chainlets. The concentration of 80% of ecosystem projects in gaming creates sector-specific risk exposure.
-
ENJ: Operating as part of a gaming community platform, ENJ faces technical risks related to network stability and integration with gaming applications. The platform's ability to serve 18.7 million registered players and 60 million monthly visitors requires consistent technical performance and security measures to prevent potential vulnerabilities.
Regulatory Risk
- Global regulatory developments may affect SAGA and ENJ differently based on their distinct use cases. SAGA's infrastructure-focused positioning as a Layer 1 protocol may face scrutiny related to decentralization standards and securities classification. ENJ's gaming and virtual goods applications may encounter regulations specific to digital asset ownership, gaming regulations, and NFT-related compliance requirements. Both assets remain subject to evolving cryptocurrency regulatory frameworks across different jurisdictions, which could impact their adoption, trading accessibility, and long-term viability.
VI. Conclusion: Which Is the Better Buy?
📌 Investment Value Summary:
-
SAGA Advantages: Represents exposure to emerging Layer 1 infrastructure technology with a growing ecosystem of 350 projects. The lower market capitalization and partial token circulation (34.37%) may present asymmetric upside potential. Price forecasts suggest potential growth from $0.045828 in 2026 to a baseline range of $0.059654380002511 - $0.121365807591316 by 2030-2031. Higher 24-hour trading volume ($289,917.15) compared to market cap suggests active market participation.
-
ENJ Advantages: Offers exposure to an established gaming and virtual goods platform with demonstrated user adoption (18.7 million registered players, 60 million monthly visitors). Full token circulation (100%) eliminates supply-side uncertainty. Longer operational history since 2017 provides more historical data for analysis. Recent 7-day performance (+4.43%) outperforms SAGA (-15.49%). Price forecasts indicate potential growth from $0.0293043 in 2026 to a baseline range of $0.027882186172573 - $0.052607898438817 by 2030-2031.
✅ Investment Recommendations:
-
Beginner investors: Consider starting with ENJ due to its longer market history, established user base, and full token circulation, which provides clearer supply dynamics. Allocate smaller position sizes and prioritize learning about both projects' fundamentals before significant capital deployment.
-
Experienced investors: May consider a diversified approach with both assets based on risk tolerance and investment horizon. SAGA offers exposure to Layer 1 infrastructure with higher volatility potential, while ENJ provides gaming sector exposure with more established metrics. Consider implementing dollar-cost averaging strategies given the current Extreme Fear market sentiment (index: 24).
-
Institutional investors: Should conduct comprehensive due diligence on both assets' liquidity profiles, custody solutions, and regulatory compliance frameworks. SAGA's lower market capitalization and trading volume may present liquidity constraints for larger positions. ENJ's established platform and user base may offer more transparent risk assessment parameters.
⚠️ Risk Warning: The cryptocurrency market exhibits extreme volatility. This article does not constitute investment advice. Both SAGA and ENJ have experienced substantial price declines from their respective all-time highs (approximately 99.36% and 99.61% respectively). Investors should conduct independent research, understand their risk tolerance, and only invest capital they can afford to lose. Past performance does not guarantee future results.
VII. FAQ
Q1: What are the main differences between SAGA and ENJ in terms of their core technology and use cases?
SAGA is a Layer 1 protocol focused on infrastructure scalability through parallelized and interoperable dedicated chains called "Chainlets," while ENJ is an established gaming and virtual goods platform. SAGA launched in 2024 as a blockchain infrastructure solution, enabling developers to automatically deploy dedicated chains with 350 projects building on its protocol (80% focused on gaming). ENJ, operational since 2017, serves as part of the largest online gaming community creation platform with over 18.7 million registered players and approximately 60 million monthly global gamers. The fundamental distinction lies in SAGA's infrastructure-layer positioning versus ENJ's application-layer focus on gaming and virtual goods management.
Q2: How does the tokenomics structure differ between SAGA and ENJ, and what implications does this have for investors?
SAGA currently has only 34.37% of its tokens in circulation with a market capitalization of $17,407,145.13, while ENJ has achieved 100% token circulation with a market capitalization of $60,434,288.73. This difference creates distinct investment dynamics: SAGA faces potential future supply pressure as additional tokens enter circulation, which could impact price performance, whereas ENJ has eliminated supply-side uncertainty with full token distribution. For investors, SAGA's partial circulation presents both higher risk (dilution potential) and higher reward potential (asymmetric upside from lower current valuation), while ENJ offers more predictable supply economics with clearer tokenomics structure.
Q3: Based on the historical price performance, which asset has demonstrated greater stability?
ENJ has demonstrated relatively greater stability with a longer operational track record. ENJ reached its all-time high of $4.82 in November 2021 and established its all-time low of $0.01865964 in November 2017, representing an approximate 99.61% decline from peak to trough over a 4-year period. SAGA experienced a compressed price discovery cycle, reaching its all-time high of $7.8609 in April 2024 and declining to $0.0438 in October 2025, representing approximately 99.36% decline within 18 months. While both assets exhibited extreme volatility, ENJ's longer market history and gradual price discovery suggest marginally more stability compared to SAGA's rapid price compression. However, both assets remain highly volatile, reflecting broader cryptocurrency market characteristics.
Q4: What do the 2026-2031 price forecasts suggest about the growth potential of SAGA versus ENJ?
Price forecasts indicate different growth trajectories for each asset. SAGA's baseline scenario projects growth from $0.045828-$0.05092 in 2026 to $0.059654380002511-$0.121365807591316 by 2030-2031, representing potential appreciation of approximately 30-138% from 2026 conservative estimates. ENJ's baseline scenario forecasts range from $0.0293043-$0.03151 in 2026 to $0.027882186172573-$0.052607898438817 by 2030-2031, suggesting potential growth of approximately -5% to 67% from 2026 conservative estimates. SAGA's projections indicate higher growth potential with increased volatility, while ENJ shows more moderate growth expectations. These forecasts should be interpreted cautiously as cryptocurrency markets remain highly unpredictable and subject to numerous external factors.
Q5: What are the primary risks investors should consider when comparing SAGA and ENJ?
Both assets face distinct risk profiles requiring careful consideration. SAGA's primary risks include: (1) limited token circulation (34.37%) creating potential dilution pressure, (2) lower market capitalization ($17,407,145.13) increasing susceptibility to price manipulation and liquidity constraints, (3) concentration risk with 80% of ecosystem projects focused on gaming, and (4) limited operational history since its 2024 launch. ENJ's key risks include: (1) approximately 99.35% decline from its all-time high indicating significant historical volatility, (2) dependence on gaming sector performance and adoption, (3) technical risks related to platform stability for 18.7 million users, and (4) regulatory uncertainty surrounding gaming and NFT applications. Both assets operate in an Extreme Fear market environment (index: 24) and face broader cryptocurrency regulatory developments.
Q6: How should different investor profiles approach allocation between SAGA and ENJ?
Investor allocation should align with risk tolerance and investment objectives. Conservative investors may consider a 30% SAGA / 70% ENJ allocation, prioritizing ENJ's longer operational history, full token circulation, and established user base. This approach reduces exposure to SAGA's supply-side uncertainty while maintaining diversification. Aggressive investors might adopt a 60% SAGA / 40% ENJ allocation, seeking higher upside potential from SAGA's lower market capitalization and emerging infrastructure positioning. Beginner investors should prioritize education and smaller position sizes, potentially starting with ENJ due to its more transparent tokenomics and established metrics. Institutional investors require comprehensive liquidity analysis, as SAGA's lower trading volume ($289,917.15) may present execution challenges for larger positions compared to ENJ's established market presence.
Q7: What role does market sentiment currently play in the SAGA vs ENJ comparison?
Current market sentiment significantly impacts both assets' near-term performance. The Market Sentiment Index stands at 24 (Extreme Fear), indicating heightened risk aversion across cryptocurrency markets. Under these conditions, both SAGA and ENJ face downward price pressure, with SAGA declining 15.49% over 7 days and ENJ gaining 4.43% in the same period. ENJ's positive short-term performance despite extreme fear conditions may indicate relatively stronger investor confidence or defensive characteristics. SAGA's steeper decline aligns with its higher risk profile given partial token circulation and lower market capitalization. Historical patterns suggest extreme fear periods may present accumulation opportunities for long-term investors with appropriate risk management, though timing market sentiment remains inherently uncertain.
Q8: What are the key factors that could drive future price divergence between SAGA and ENJ?
Several factors may cause SAGA and ENJ price performance to diverge: (1) Ecosystem development—SAGA's success depends on attracting additional projects beyond its current 350, while ENJ's growth relies on expanding its gaming community beyond 18.7 million users; (2) Token supply dynamics—SAGA's gradual token release (currently 34.37% circulating) versus ENJ's complete distribution creates different supply-demand dynamics; (3) Technological adoption—SAGA's Layer 1 infrastructure faces competition from established blockchain protocols, while ENJ competes with gaming-specific platforms and NFT marketplaces; (4) Sector-specific trends—SAGA benefits from infrastructure demand, while ENJ depends on gaming and virtual goods market growth; (5) Regulatory developments—each asset faces distinct compliance requirements based on their use cases. Investors should monitor these factors to assess relative performance potential.
* The information is not intended to be and does not constitute financial advice or any other recommendation of any sort offered or endorsed by Gate.