This article covers an investment comparison between Samoyedcoin (SAMO) and Ethereum Classic (ETC), focusing on factors like historical price trends, supply mechanisms, and market applications. It aims to answer which is the better buy now, discussing relevant risks and strategies for both conservative and aggressive investors. The core structure involves analyzing price history, key investment factors, and future predictions, while offering strategies for investment allocation. The content is tailored for both new and experienced investors seeking insight into the potential growth and risks of SAMO and ETC, enhancing their investment decision-making process.
Introduction: Investment Comparison between SAMO and ETC
In the cryptocurrency market, the comparison between Samoyedcoin (SAMO) vs Ethereum Classic (ETC) has been an unavoidable topic for investors. The two not only differ significantly in market cap ranking, application scenarios, and price performance, but also represent different positioning in the crypto asset space.
Samoyedcoin (SAMO): Since its launch, it has gained market recognition as Solana's cutest ambassador, helping new users join the Solana ecosystem.
Ethereum Classic (ETC): Since its inception in 2016, it has been hailed as a decentralized platform for executing smart contracts, continuing the original Ethereum chain and upholding the "code is law" principle.
This article will comprehensively analyze the investment value comparison between SAMO and ETC, focusing on historical price trends, supply mechanisms, institutional adoption, technological ecosystems, and future predictions, attempting to answer the question investors care about most:
"Which is the better buy right now?"
I. Price History Comparison and Current Market Status
SAMO and ETC Historical Price Trends
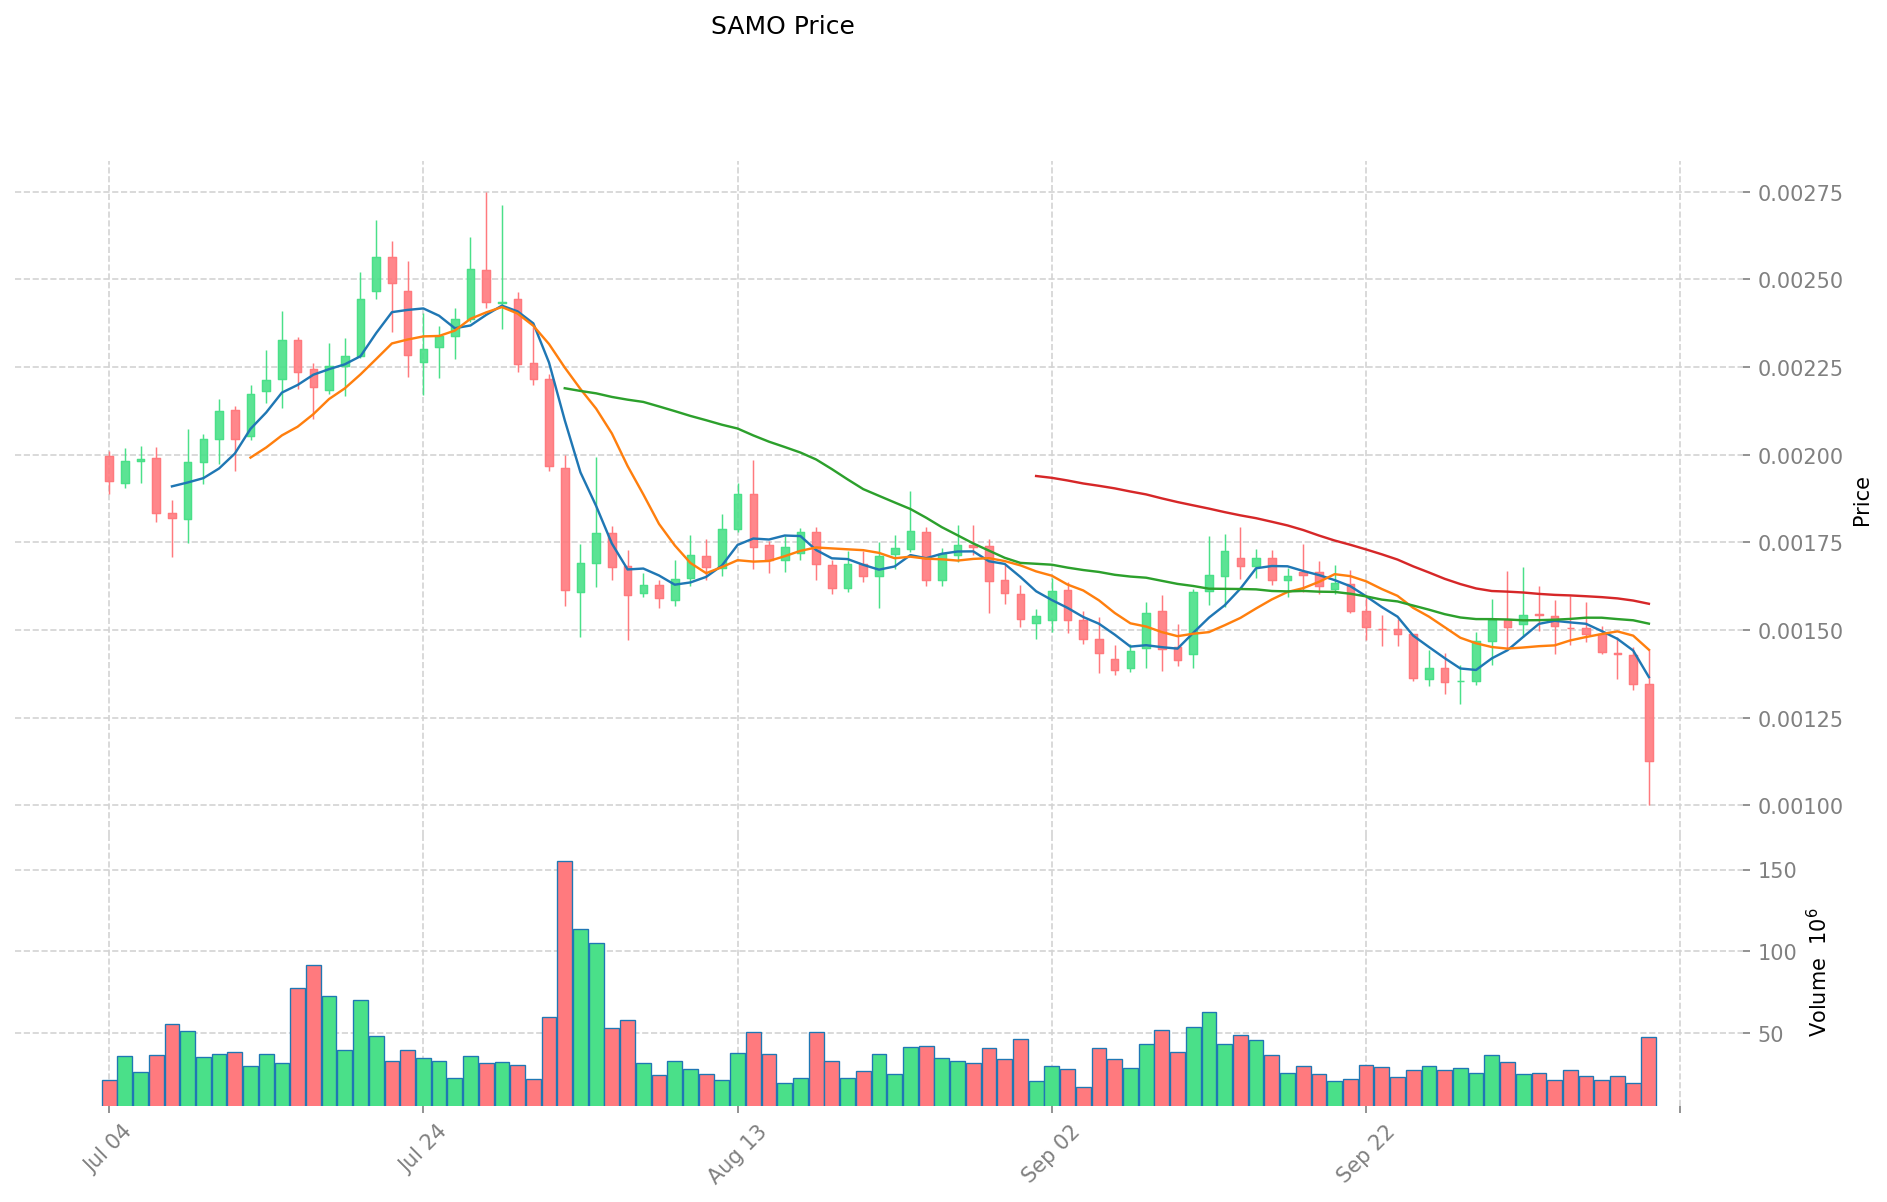
- 2021: SAMO reached its all-time high of $0.236987 during the bull market.
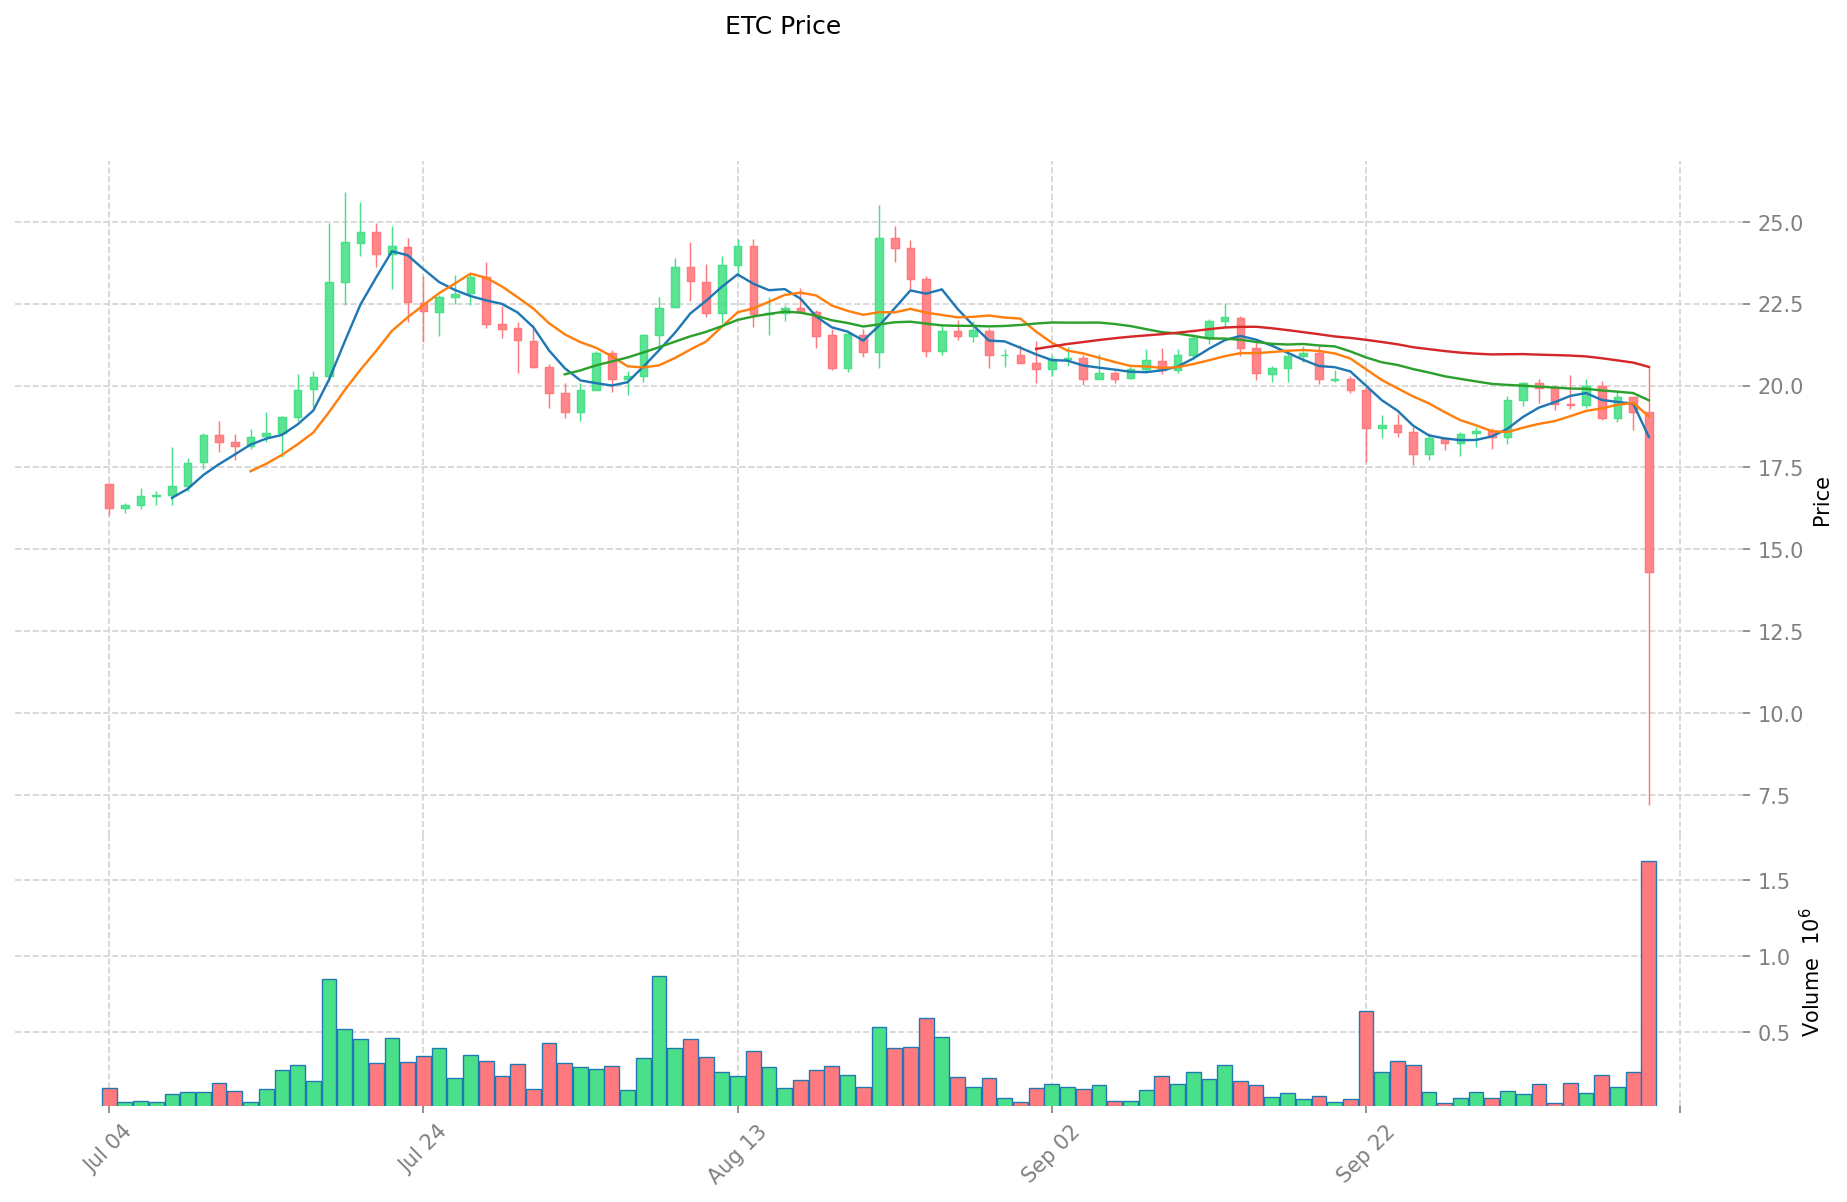
- 2016: ETC was created as a result of the Ethereum hard fork, maintaining the original Ethereum blockchain.
- Comparative analysis: During the 2022 bear market, SAMO dropped from its peak to a low of $0.00066955, while ETC showed relatively more stability.
Current Market Situation (2025-10-11)
- SAMO current price: $0.001101
- ETC current price: $14.00
- 24-hour trading volume: SAMO $58,631.41 vs ETC $25,526,598.42
- Market Sentiment Index (Fear & Greed Index): 64 (Greed)
Click to view real-time prices:
- Check SAMO current price Market Price
- Check ETC current price Market Price
II. Key Factors Affecting the Investment Value of SAMO vs ETC
Supply Mechanism Comparison (Tokenomics)
-
SAMO: Functions as the main medium of exchange in Uzbekistan's economy, supporting key sectors including cotton production, gold mining, and energy
-
ETC: Subject to significant price volatility like most cryptocurrencies, creating higher investment risk
-
📌 Historical Pattern: Supply mechanisms contribute to price volatility in both assets, with market fluctuations being a common characteristic.
Institutional Adoption and Market Applications
- Market Attention: SAMO has gained market attention in a short time due to its unique reward mechanism, user-friendly interface, and commitment to technical innovation
- Enterprise Applications: Both assets face adoption challenges and opportunities within their respective ecosystems
- Regulatory Attitudes: Cryptocurrency prices can be significantly affected by financial, regulatory, and political events
Technical Development and Ecosystem Building
- SAMO Technical Development: Focuses on user interface improvements and innovative reward mechanisms
- ETC Technical Development: Continues development based on blockchain technology advancements
- Ecosystem Comparison: Both assets are building value through technological innovation, though specific implementation details vary
Macroeconomic Factors and Market Cycles
- Performance in Inflationary Environments: Both assets experience high price volatility that can be influenced by external factors
- Monetary Policy Impact: Financial market conditions affect trading risk profiles for both cryptocurrencies
- Geopolitical Factors: Regional economic factors play a significant role for SAMO particularly in Uzbekistan's economic context
III. 2025-2030 Price Prediction: SAMO vs ETC
Short-term Prediction (2025)
- SAMO: Conservative $0.00069111 - $0.001097 | Optimistic $0.001097 - $0.00143707
- ETC: Conservative $9.68553 - $14.037 | Optimistic $14.037 - $16.14255
Mid-term Prediction (2027)
- SAMO may enter a growth phase, with projected prices $0.00070111381725 - $0.00149845894275
- ETC may enter a bullish market, with projected prices $11.6719409625 - $20.2912204425
- Key drivers: Institutional capital inflow, ETF, ecosystem development
Long-term Prediction (2030)
- SAMO: Base scenario $0.001440938788458 - $0.001778936775874 | Optimistic scenario $0.001778936775874 - $0.002312617808637
- ETC: Base scenario $13.944312496407706 - $23.634427960013062 | Optimistic scenario $23.634427960013062 - $28.597657831615805
View detailed price predictions for SAMO and ETC
Disclaimer: This information is for educational purposes only and should not be considered as financial advice. Cryptocurrency markets are highly volatile and unpredictable. Always conduct your own research before making any investment decisions.
SAMO:
| 年份 |
预测最高价 |
预测平均价格 |
预测最低价 |
涨跌幅 |
| 2025 |
0.00143707 |
0.001097 |
0.00069111 |
0 |
| 2026 |
0.00148243095 |
0.001267035 |
0.00107697975 |
15 |
| 2027 |
0.00149845894275 |
0.001374732975 |
0.00070111381725 |
24 |
| 2028 |
0.001479693837641 |
0.001436595958875 |
0.001063081009567 |
30 |
| 2029 |
0.002099728653491 |
0.001458144898258 |
0.000918631285902 |
32 |
| 2030 |
0.002312617808637 |
0.001778936775874 |
0.001440938788458 |
61 |
ETC:
| 年份 |
预测最高价 |
预测平均价格 |
预测最低价 |
涨跌幅 |
| 2025 |
16.14255 |
14.037 |
9.68553 |
1 |
| 2026 |
20.8238895 |
15.089775 |
11.01553575 |
9 |
| 2027 |
20.2912204425 |
17.95683225 |
11.6719409625 |
29 |
| 2028 |
25.0524745135875 |
19.12402634625 |
15.4904613404625 |
38 |
| 2029 |
25.180605490107375 |
22.08825042991875 |
11.265007719258562 |
59 |
| 2030 |
28.597657831615805 |
23.634427960013062 |
13.944312496407706 |
70 |
IV. Investment Strategy Comparison: SAMO vs ETC
Long-term vs Short-term Investment Strategies
- SAMO: Suitable for investors focused on ecosystem potential and community-driven projects
- ETC: Suitable for investors seeking established networks with smart contract capabilities
Risk Management and Asset Allocation
- Conservative investors: SAMO: 10% vs ETC: 90%
- Aggressive investors: SAMO: 30% vs ETC: 70%
- Hedging tools: Stablecoin allocation, options, cross-currency portfolios
V. Potential Risk Comparison
Market Risk
- SAMO: Higher volatility due to lower market cap and trading volume
- ETC: Susceptible to broader crypto market trends and Ethereum ecosystem developments
Technical Risk
- SAMO: Scalability, network stability on Solana
- ETC: Hash rate concentration, potential security vulnerabilities
Regulatory Risk
- Global regulatory policies may impact both assets differently, with potential for stricter oversight on newer, community-driven tokens like SAMO
VI. Conclusion: Which Is the Better Buy?
📌 Investment Value Summary:
- SAMO advantages: Strong community support, potential for rapid growth in the Solana ecosystem
- ETC advantages: Established history, continuation of original Ethereum blockchain, "code is law" principle
✅ Investment Advice:
- New investors: Consider a small allocation to SAMO for exposure to Solana ecosystem, larger allocation to ETC for more established asset
- Experienced investors: Balance portfolio with both assets based on risk tolerance and market outlook
- Institutional investors: ETC may be more suitable due to longer track record and higher liquidity
⚠️ Risk Warning: Cryptocurrency markets are highly volatile. This article does not constitute investment advice.
None
VII. FAQ
Q1: What are the main differences between SAMO and ETC?
A: SAMO is Solana's community token, while ETC is a continuation of the original Ethereum blockchain. SAMO has a lower market cap and higher volatility, whereas ETC has a longer history and is more established in the smart contract space.
Q2: Which asset has shown better price performance historically?
A: ETC has shown relatively more price stability compared to SAMO. During the 2022 bear market, SAMO experienced a more significant drop from its all-time high than ETC.
Q3: How do the supply mechanisms of SAMO and ETC differ?
A: SAMO functions as a medium of exchange in Uzbekistan's economy, supporting sectors like cotton production and gold mining. ETC, like most cryptocurrencies, is subject to significant price volatility due to its supply mechanism.
Q4: What are the key factors affecting the investment value of SAMO and ETC?
A: Key factors include institutional adoption, market applications, technical development, ecosystem building, macroeconomic factors, and market cycles.
Q5: What are the projected price ranges for SAMO and ETC in 2030?
A: For SAMO, the base scenario projects $0.001440938788458 - $0.001778936775874, with an optimistic scenario of $0.001778936775874 - $0.002312617808637. For ETC, the base scenario projects $13.944312496407706 - $23.634427960013062, with an optimistic scenario of $23.634427960013062 - $28.597657831615805.
Q6: How should investors allocate their portfolio between SAMO and ETC?
A: Conservative investors might consider 10% SAMO and 90% ETC, while aggressive investors might opt for 30% SAMO and 70% ETC. However, individual allocations should be based on personal risk tolerance and market outlook.
Q7: What are the main risks associated with investing in SAMO and ETC?
A: Both assets face market risks, technical risks, and regulatory risks. SAMO has higher volatility due to its lower market cap, while ETC is more susceptible to broader crypto market trends and Ethereum ecosystem developments.
* The information is not intended to be and does not constitute financial advice or any other recommendation of any sort offered or endorsed by Gate.


