This article provides a comparative analysis of Shieldeum (SDM) and Decentraland (MANA) as digital asset investment options in the blockchain era. It examines historical price trends, supply mechanisms, institutional adoption, and technological ecosystems to determine which token presents a better buy opportunity. Targeted at investors seeking informed decision-making guidance, the article outlines both short-term and long-term investment strategies, highlighting the risks and potential rewards associated with SDM and MANA. Click the Market Price links for real-time updates on Gate.com.
Introduction: SDM vs MANA Investment Comparison
In the cryptocurrency market, the comparison between Shieldeum (SDM) vs Decentraland (MANA) has been an unavoidable topic for investors. The two not only differ significantly in market cap ranking, application scenarios, and price performance, but also represent different crypto asset positioning.
Shieldeum (SDM): Since its launch, it has gained market recognition for its focus on secure computing power through AI-driven Decentralized Physical Infrastructure Network (DePIN).
Decentraland (MANA): Introduced in 2017, it has been hailed as a pioneer in blockchain-based virtual worlds, aiming to create a decentralized platform for content creators and gamers.
This article will comprehensively analyze the investment value comparison between SDM and MANA, focusing on historical price trends, supply mechanisms, institutional adoption, technological ecosystems, and future predictions, attempting to answer the question most concerning to investors:
"Which is the better buy right now?"
I. Price History Comparison and Current Market Status
SDM (Coin A) and MANA (Coin B) Historical Price Trends
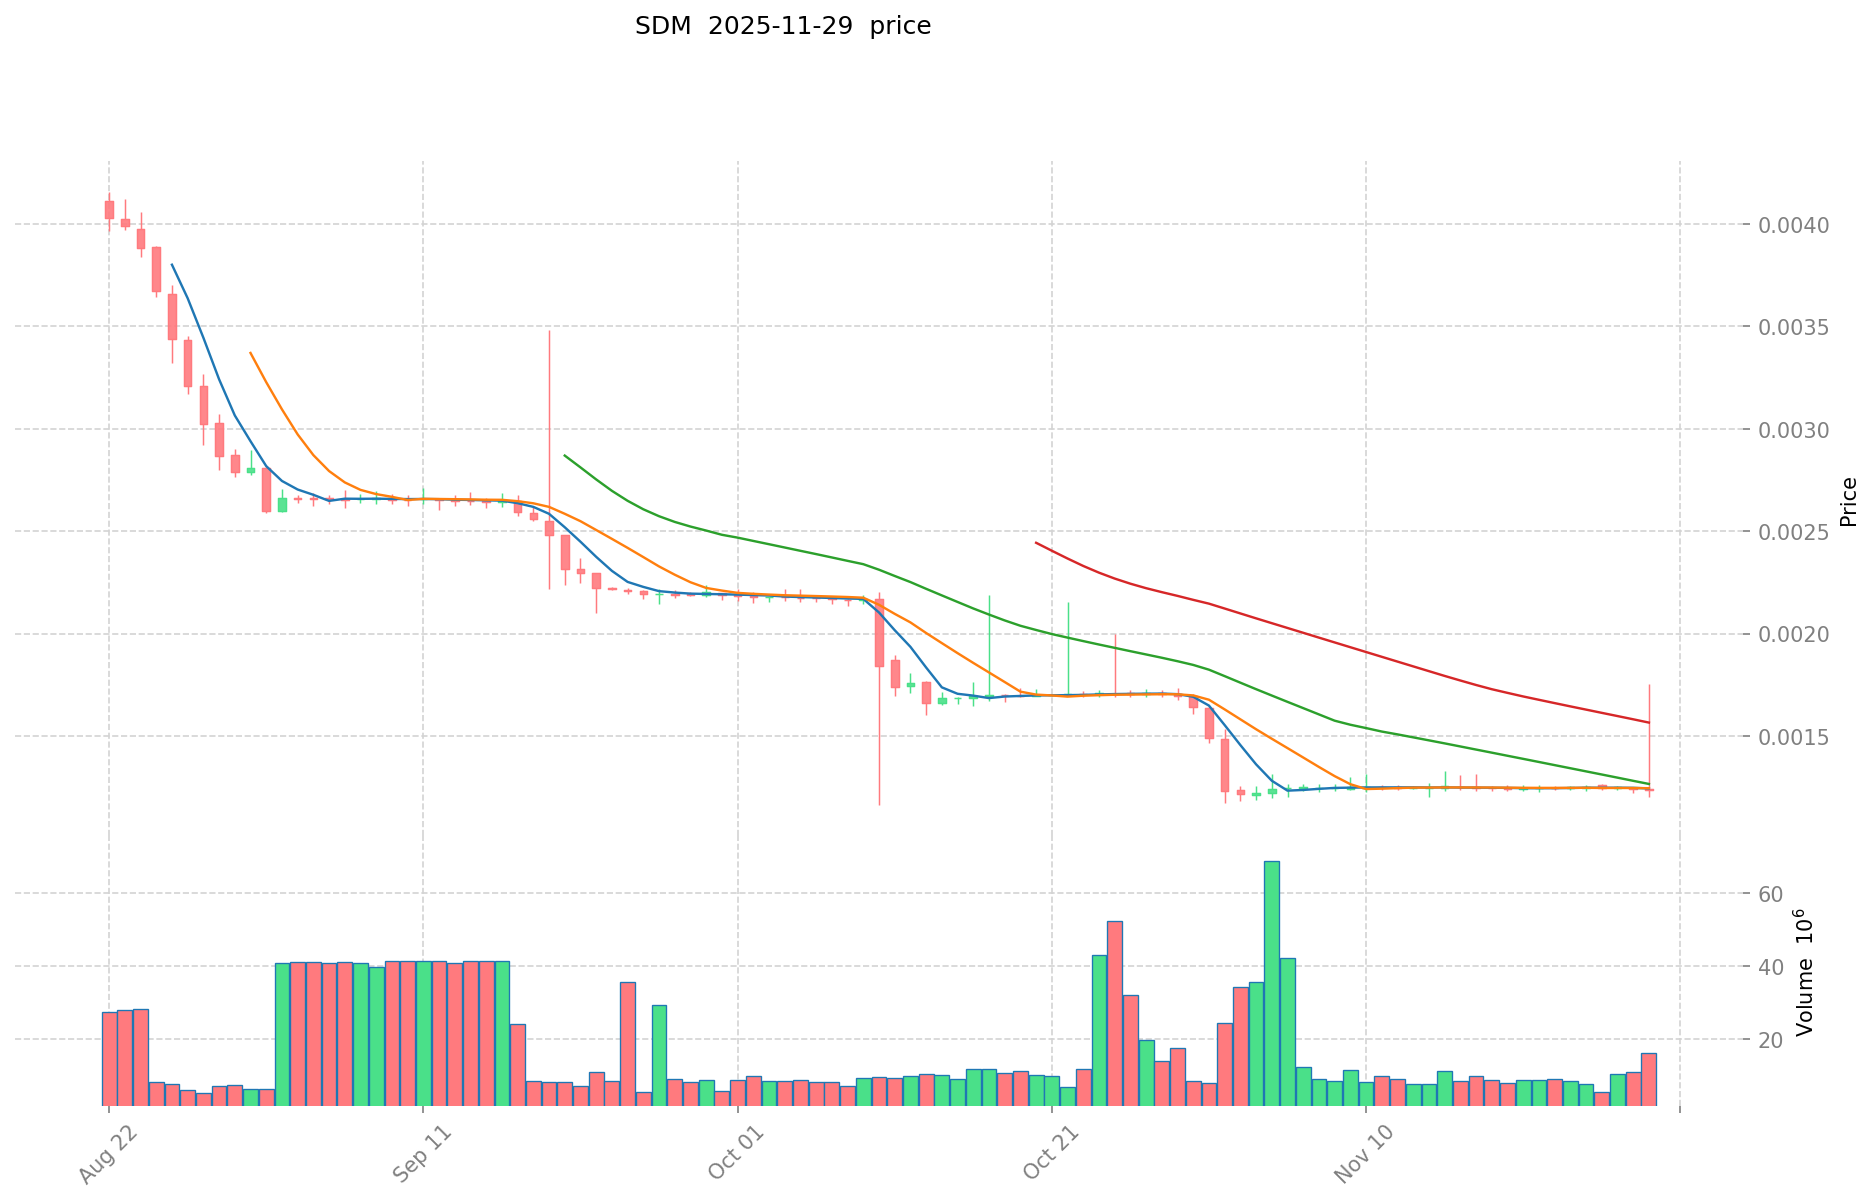
- 2024: SDM reached its all-time high of $0.261739 on December 9, 2024.
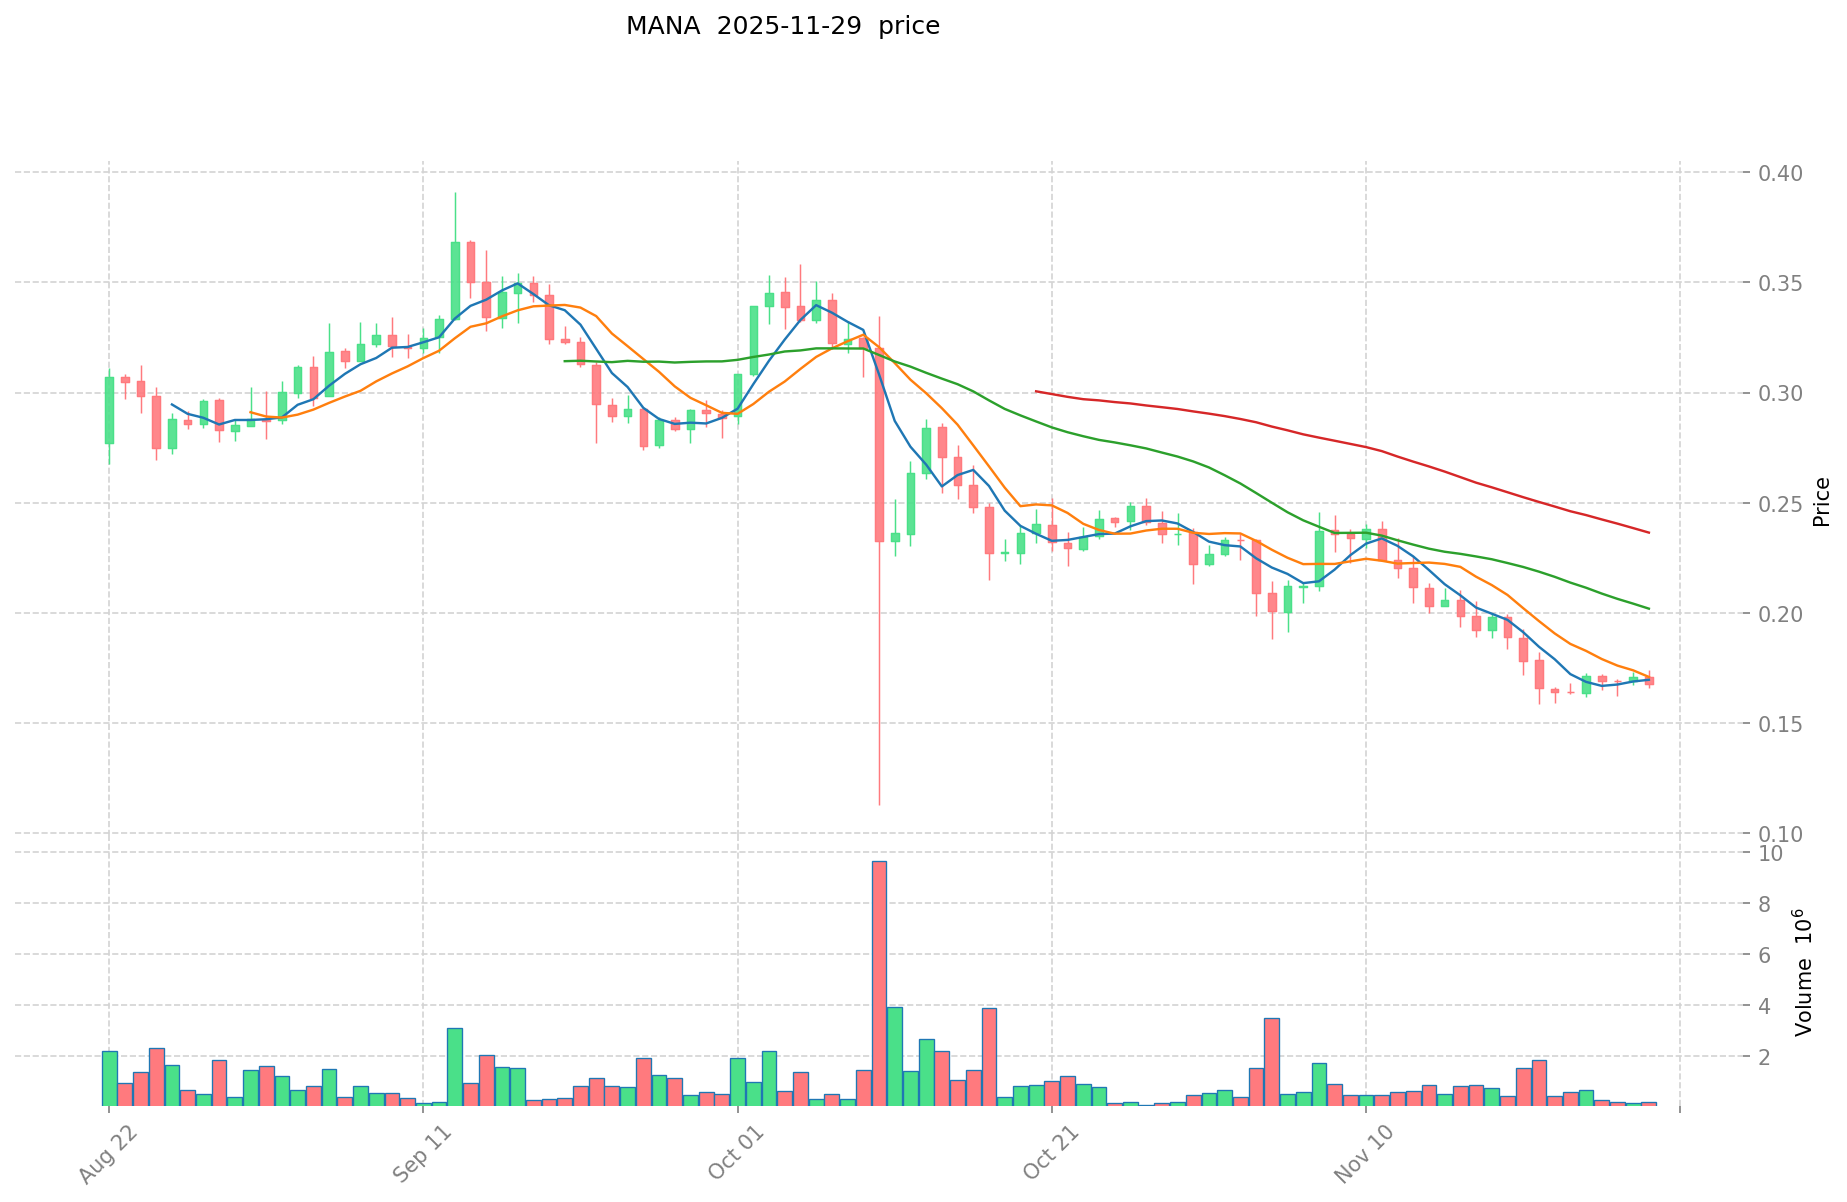
- 2021: MANA hit its all-time high of $5.85 on November 25, 2021, likely influenced by the metaverse hype.
- Comparative analysis: In the recent market cycle, SDM dropped from its peak of $0.261739 to a low of $0.001161, while MANA fell from its all-time high of $5.85 to the current price of $0.1666.
Current Market Situation (2025-11-29)
- SDM current price: $0.001229
- MANA current price: $0.1666
- 24-hour trading volume: SDM $18,496.99 vs MANA $23,844.50
- Market Sentiment Index (Fear & Greed Index): 28 (Fear)
Click to view real-time prices:
- View SDM current price Market Price
- View MANA current price Market Price
II. Core Factors Affecting Investment Value of SDM vs MANA
Supply Mechanisms Comparison (Tokenomics)
- SDM: Fixed supply model with a cap of 1 billion tokens, creating a deflationary structure
- MANA: Fixed maximum supply of 2.19 billion tokens, with most already in circulation
- 📌 Historical Pattern: Limited supply cryptocurrencies tend to experience price appreciation during market uptrends when demand outpaces available supply.
Institutional Adoption and Market Applications
- Institutional Holdings: MANA has gained more institutional recognition due to its earlier establishment and partnership with major brands in the metaverse space
- Enterprise Adoption: MANA has been integrated into various metaverse experiences and virtual real estate platforms, while SDM is newer to the ecosystem
- National Policies: Both tokens face similar regulatory considerations as non-security utility tokens for virtual world economies
Technological Development and Ecosystem Building
- SDM Technical Development: Building a comprehensive ecosystem with StepApp, focusing on move-to-earn and fitness applications
- MANA Technical Development: Continuous development of Decentraland platform with regular updates to enhance virtual experiences
- Ecosystem Comparison: MANA has a more established ecosystem within Decentraland with virtual real estate, wearables, and events, while SDM is focused on fitness applications and step tracking functionality
Macroeconomic Factors and Market Cycles
- Performance in Inflationary Environments: Both tokens have limited historical data during high inflationary periods
- Macroeconomic Monetary Policy: Interest rate hikes have generally affected both tokens similarly as part of the broader cryptocurrency market
- Geopolitical Factors: Virtual worlds and fitness applications may see increased demand during global uncertainties that limit physical interactions
III. 2025-2030 Price Prediction: SDM vs MANA
Short-term Prediction (2025)
- SDM: Conservative $0.00112608 - $0.001224 | Optimistic $0.001224 - $0.0017748
- MANA: Conservative $0.101382 - $0.1662 | Optimistic $0.1662 - $0.19944
Mid-term Prediction (2027)
- SDM may enter a growth phase, with prices expected in the range of $0.001304478 - $0.00241763256
- MANA may enter a steady growth phase, with prices expected in the range of $0.192408909 - $0.214228476
- Key drivers: Institutional fund inflows, ETF, ecosystem development
Long-term Prediction (2030)
- SDM: Base scenario $0.00222603952788 - $0.003005153362638 | Optimistic scenario $0.003005153362638+
- MANA: Base scenario $0.287161370496 - $0.4163839872192 | Optimistic scenario $0.4163839872192+
View detailed price predictions for SDM and MANA
Disclaimer: The above predictions are based on historical data and market analysis. Cryptocurrency markets are highly volatile and subject to change. This information should not be considered as financial advice. Always conduct your own research before making investment decisions.
SDM:
| 年份 |
预测最高价 |
预测平均价格 |
预测最低价 |
涨跌幅 |
| 2025 |
0.0017748 |
0.001224 |
0.00112608 |
0 |
| 2026 |
0.001979208 |
0.0014994 |
0.000944622 |
22 |
| 2027 |
0.00241763256 |
0.001739304 |
0.001304478 |
41 |
| 2028 |
0.002286315108 |
0.00207846828 |
0.0019121908176 |
69 |
| 2029 |
0.00226968736176 |
0.002182391694 |
0.00113484368088 |
77 |
| 2030 |
0.003005153362638 |
0.00222603952788 |
0.001558227669516 |
81 |
MANA:
| 年份 |
预测最高价 |
预测平均价格 |
预测最低价 |
涨跌幅 |
| 2025 |
0.19944 |
0.1662 |
0.101382 |
0 |
| 2026 |
0.2138994 |
0.18282 |
0.1663662 |
9 |
| 2027 |
0.214228476 |
0.1983597 |
0.192408909 |
19 |
| 2028 |
0.27230819616 |
0.206294088 |
0.13202821632 |
23 |
| 2029 |
0.335021598912 |
0.23930114208 |
0.1770828451392 |
43 |
| 2030 |
0.4163839872192 |
0.287161370496 |
0.27854652938112 |
72 |
IV. Investment Strategy Comparison: SDM vs MANA
Long-term vs Short-term Investment Strategies
- SDM: Suitable for investors focusing on DePIN and AI-driven secure computing power
- MANA: Suitable for investors interested in metaverse and virtual world economies
Risk Management and Asset Allocation
- Conservative investors: SDM: 20% vs MANA: 80%
- Aggressive investors: SDM: 40% vs MANA: 60%
- Hedging tools: Stablecoin allocation, options, cross-currency portfolios
V. Potential Risk Comparison
Market Risks
- SDM: Higher volatility due to lower market cap and trading volume
- MANA: Susceptible to metaverse hype cycles and market sentiment shifts
Technical Risks
- SDM: Scalability, network stability
- MANA: Platform adoption, virtual world performance issues
Regulatory Risks
- Global regulatory policies may impact both tokens differently, with MANA potentially facing more scrutiny due to its established presence in the virtual world space
VI. Conclusion: Which Is the Better Buy?
📌 Investment Value Summary:
- SDM advantages: Focus on DePIN, AI-driven secure computing power, potential for growth in fitness and move-to-earn applications
- MANA advantages: Established metaverse platform, partnerships with major brands, more institutional recognition
✅ Investment Advice:
- New investors: Consider a small allocation to MANA as part of a diversified portfolio
- Experienced investors: Explore both SDM and MANA, with a higher allocation to MANA due to its more established ecosystem
- Institutional investors: MANA may be more suitable due to its market presence and liquidity
⚠️ Risk Warning: The cryptocurrency market is highly volatile, and this article does not constitute investment advice.
None
VII. FAQ
Q1: What are the main differences between SDM and MANA?
A: SDM focuses on secure computing power through AI-driven Decentralized Physical Infrastructure Network (DePIN), while MANA is centered on creating a blockchain-based virtual world platform. SDM has a fixed supply of 1 billion tokens, whereas MANA has a maximum supply of 2.19 billion tokens. MANA has a more established ecosystem and institutional recognition, while SDM is newer with potential in the fitness and move-to-earn applications.
Q2: Which token has performed better historically?
A: MANA has had a higher all-time high of $5.85 in November 2021, compared to SDM's all-time high of $0.261739 in December 2024. However, both tokens have experienced significant drops from their peaks, with MANA currently trading at $0.1666 and SDM at $0.001229 as of November 29, 2025.
Q3: How do the supply mechanisms of SDM and MANA compare?
A: SDM has a fixed supply model with a cap of 1 billion tokens, creating a deflationary structure. MANA has a fixed maximum supply of 2.19 billion tokens, with most already in circulation. Limited supply cryptocurrencies tend to experience price appreciation during market uptrends when demand outpaces available supply.
Q4: What are the key factors affecting the investment value of SDM and MANA?
A: Key factors include supply mechanisms, institutional adoption, market applications, technological development, ecosystem building, macroeconomic factors, and market cycles. MANA has more institutional recognition and an established ecosystem, while SDM is focused on DePIN and fitness applications.
Q5: What are the predicted price ranges for SDM and MANA in 2030?
A: For SDM, the base scenario predicts a range of $0.00222603952788 - $0.003005153362638, with an optimistic scenario above $0.003005153362638. For MANA, the base scenario predicts a range of $0.287161370496 - $0.4163839872192, with an optimistic scenario above $0.4163839872192.
Q6: How should investors allocate their assets between SDM and MANA?
A: Conservative investors might consider allocating 20% to SDM and 80% to MANA, while aggressive investors might opt for 40% SDM and 60% MANA. New investors may want to start with a small allocation to MANA as part of a diversified portfolio, while experienced investors could explore both tokens with a higher allocation to MANA due to its more established ecosystem.
Q7: What are the main risks associated with investing in SDM and MANA?
A: Market risks include higher volatility for SDM due to lower market cap and trading volume, and MANA's susceptibility to metaverse hype cycles. Technical risks involve scalability and network stability for SDM, and platform adoption issues for MANA. Both tokens face regulatory risks, with MANA potentially facing more scrutiny due to its established presence in the virtual world space.
* The information is not intended to be and does not constitute financial advice or any other recommendation of any sort offered or endorsed by Gate.


