This comprehensive analysis compares Songbird (SGB) and Stellar (XLM), two distinct blockchain tokens serving different market functions. SGB operates as Flare's Canary testing network for protocols like FTSO and F-Asset systems, currently priced at $0.002096 with significantly lower liquidity. XLM functions as an established cross-border payment infrastructure launched in 2014, priced at $0.20868 with substantially higher trading volume on Gate. The article examines historical price trends, market status, tokenomics, institutional adoption, technical ecosystems, and provides price forecasts through 2031. SGB faces higher volatility (72.43% yearly decline) compared to XLM (51.93% decline), reflecting its experimental nature and limited liquidity. Investment recommendations vary by risk profile: conservative investors favor XLM's maturity and liquidity, while aggressive investors might diversify across both assets. Risk factors include market volatility, technical uncertainties, and evolving regulatory framewo
Introduction: Investment Comparison Between SGB and XLM
In the cryptocurrency market, the comparison between Songbird and Stellar has consistently been a topic that investors cannot overlook. The two assets exhibit notable differences in market cap rankings, application scenarios, and price performance, representing distinct positioning within the crypto asset landscape.
Songbird (SGB): Serving as the Canary network for Flare, it plays a role in testing the Flare Time Series Oracle, State Connector, and F-Asset systems. The FTSO and F-Asset protocols operate on Songbird, with F-Assets generated by underlying tokens.
Stellar (XLM): Launched in 2014 by Jed McCaleb, one of Ripple's former founders, it established a decentralized gateway for transmission between digital currency and fiat currency, enabling rapid, stable, and low-cost transfers of digital assets among banks, payment institutions, and individuals.
This article will comprehensively analyze the investment value comparison between Songbird and Stellar, focusing on historical price trends, supply mechanisms, institutional adoption, technical ecosystems, and future projections, attempting to address the question that concerns investors most:
"Which is the better buy right now?"
I. Historical Price Comparison and Market Status
SGB and XLM Historical Price Trends
- 2021: SGB reached its all-time high of $0.71334 on September 30, 2021, following its launch as Flare's Canary network.
- 2026: SGB experienced significant price decline, hitting an all-time low of $0.00192389 on January 1, 2026.
- 2018: XLM achieved its all-time high of $0.875563 on January 3, 2018, during a period of increased market activity.
- 2015: XLM recorded its all-time low of $0.00047612 on March 5, 2015, in the early stages of the project.
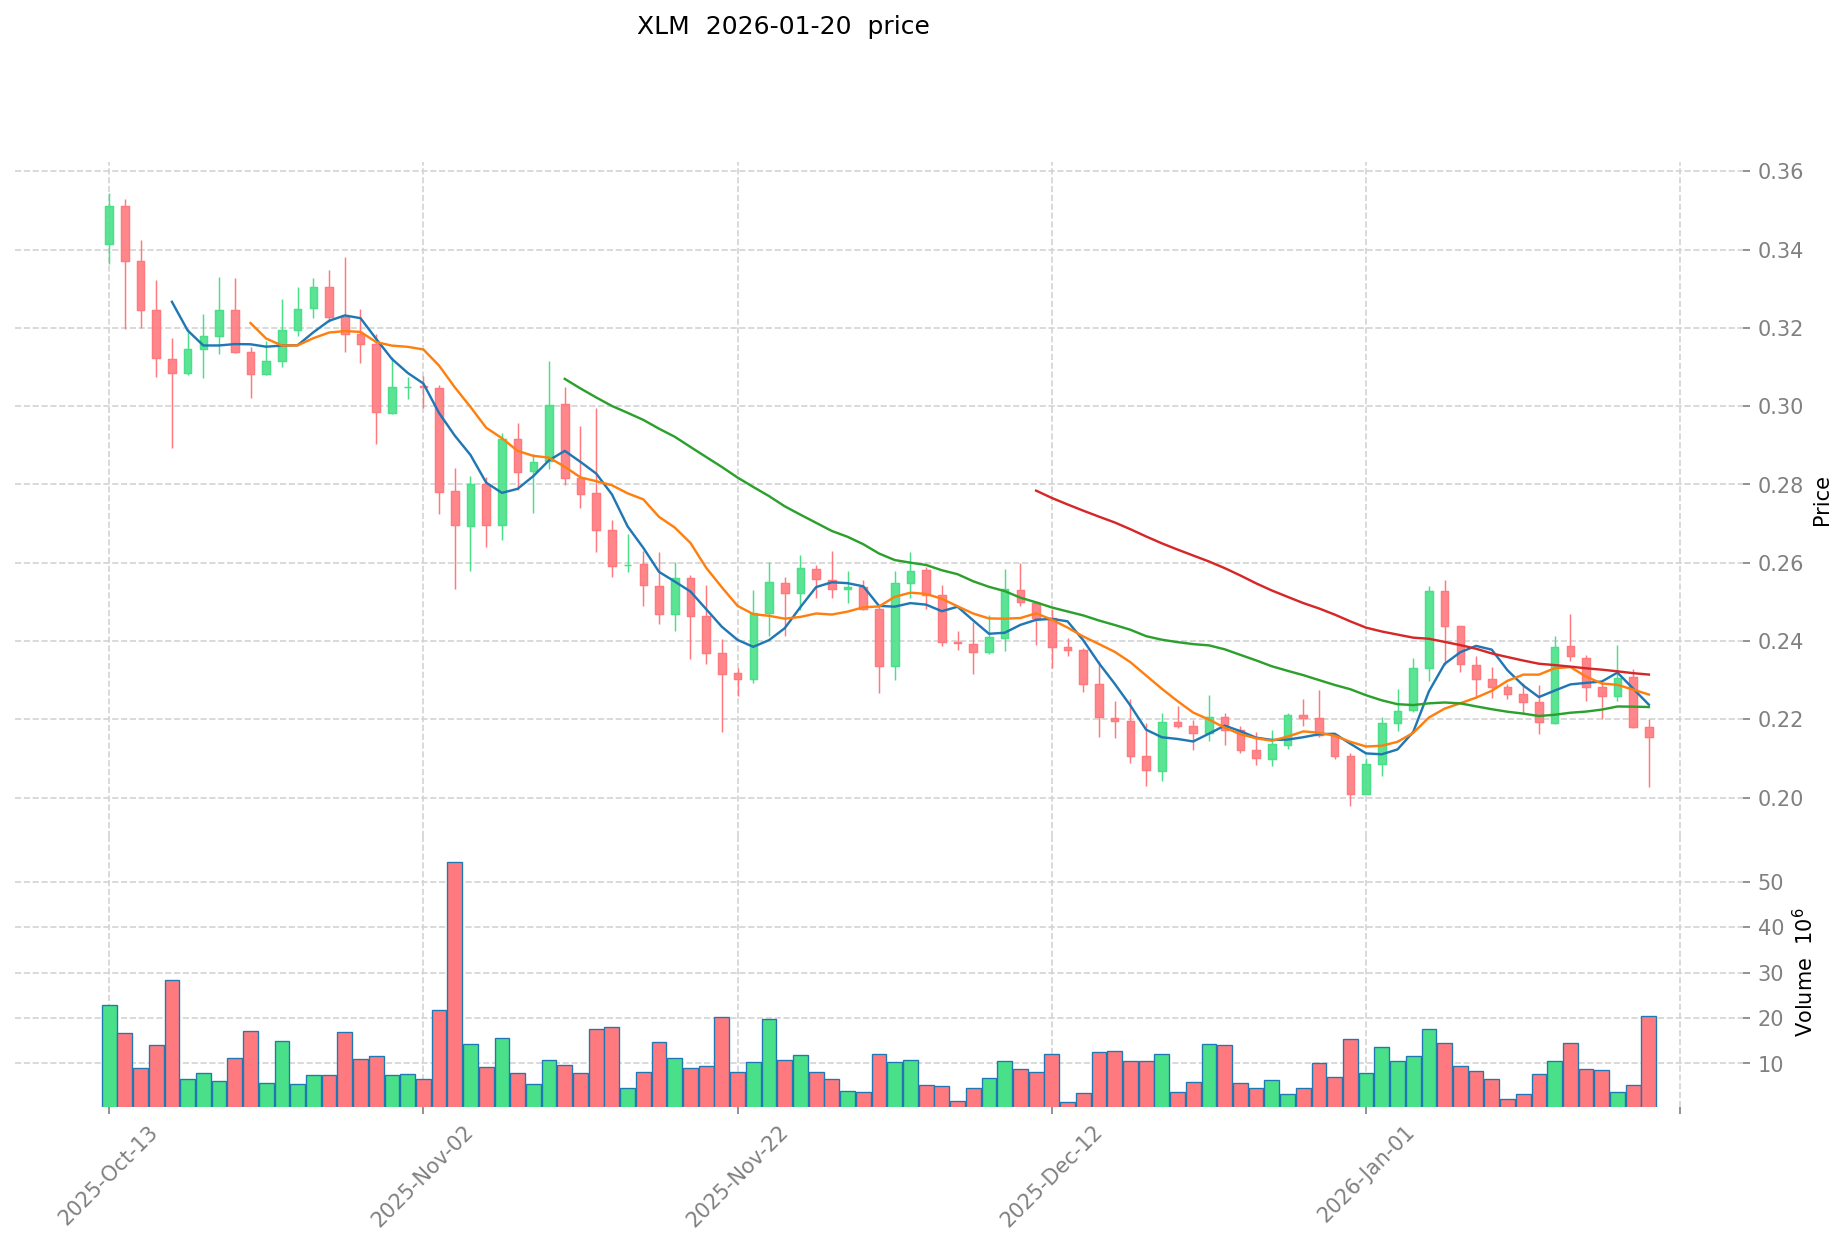
- Comparative Analysis: Over the past year, SGB has declined by 72.43% from its higher price levels, while XLM has decreased by 51.93% during the same period.
Current Market Status (January 21, 2026)
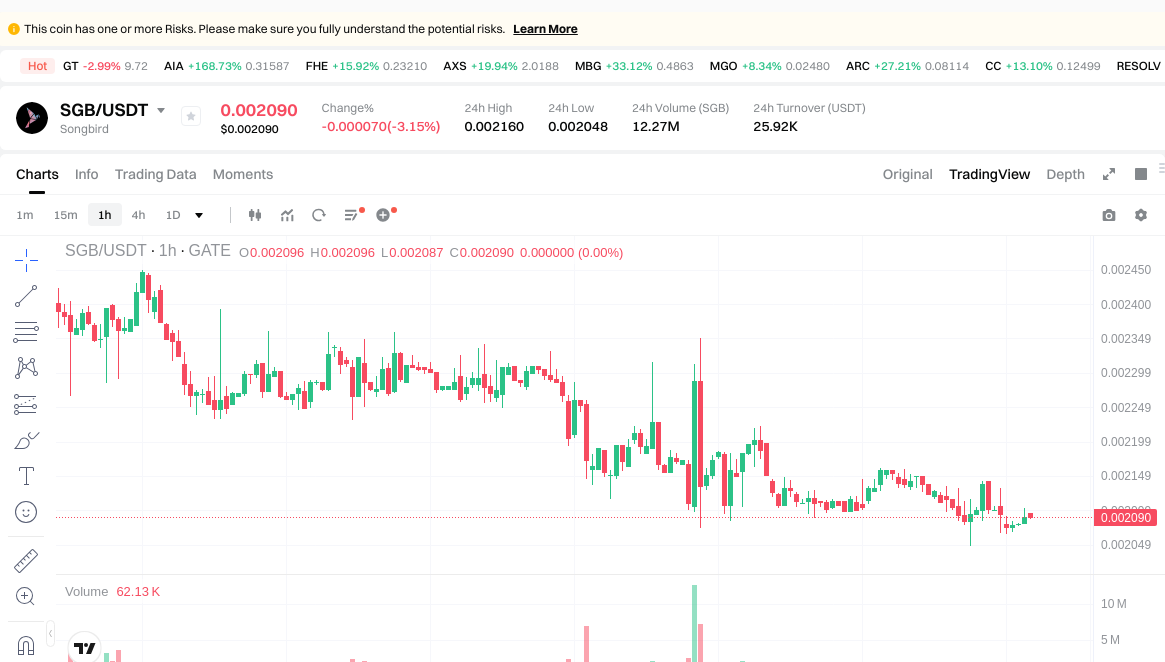
- SGB Current Price: $0.002096
- XLM Current Price: $0.20868
- 24-Hour Trading Volume: SGB $25,913.71 vs XLM $2,581,106.09
- Market Sentiment Index (Fear & Greed Index): 32 (Fear)
View real-time prices:
II. Core Factors Affecting SGB vs XLM Investment Value
Supply Mechanism Comparison (Tokenomics)
Due to limited available data on the specific supply mechanisms of SGB and XLM, a comprehensive comparison cannot be provided at this time. General market observations suggest that tokenomics plays a significant role in long-term price dynamics, with factors such as emission schedules, burn mechanisms, and maximum supply caps potentially influencing valuation trends over extended periods.
Institutional Adoption and Market Application
Insufficient data is available regarding institutional holdings and enterprise adoption patterns for SGB and XLM. Market applications in cross-border payments, settlement systems, and investment portfolios require further documentation to establish meaningful comparisons. Regulatory attitudes toward these assets vary across jurisdictions, though specific policy frameworks remain undocumented in the current materials.
Technology Development and Ecosystem Building
Technical upgrade paths and ecosystem development metrics for both SGB and XLM are not sufficiently documented in available materials. Comparative analysis of DeFi integration, NFT implementation, payment infrastructure, and smart contract deployment would require additional data sources to provide accurate assessments.
Macroeconomic Environment and Market Cycles
The relationship between macroeconomic conditions and the performance characteristics of SGB versus XLM cannot be conclusively determined from current materials. Factors including inflationary pressures, monetary policy adjustments, interest rate movements, and geopolitical developments may influence both assets, though specific correlation patterns and relative performance metrics require further analysis with comprehensive data.
III. 2026-2031 Price Forecast: SGB vs XLM
Short-term Forecast (2026)
- SGB: Conservative $0.0011704 - $0.00209 | Optimistic $0.00209 - $0.0030305
- XLM: Conservative $0.185298 - $0.2082 | Optimistic $0.2082 - $0.256086
Mid-term Forecast (2028-2029)
- SGB may enter a phase of gradual growth, with estimated prices ranging from $0.0019898263 to $0.004148639341
- XLM may experience increased volatility, with projected prices between $0.1631733147 and $0.3691425396645
- Key drivers: institutional capital flows, ETF developments, ecosystem expansion
Long-term Forecast (2030-2031)
- SGB: Baseline scenario $0.002281168447675 - $0.0037745816955 | Optimistic scenario $0.005171176922835 - $0.006127844653559
- XLM: Baseline scenario $0.215186663002837 - $0.364162045081725 | Optimistic scenario $0.3972676855437 - $0.444277694999704
View detailed price predictions for SGB and XLM
Disclaimer
SGB:
| Year |
Predicted High Price |
Predicted Average Price |
Predicted Low Price |
Price Change |
| 2026 |
0.0030305 |
0.00209 |
0.0011704 |
0 |
| 2027 |
0.00337953 |
0.00256025 |
0.0024322375 |
22 |
| 2028 |
0.0038311581 |
0.00296989 |
0.0019898263 |
41 |
| 2029 |
0.004148639341 |
0.00340052405 |
0.0020063091895 |
62 |
| 2030 |
0.005171176922835 |
0.0037745816955 |
0.002906427905535 |
80 |
| 2031 |
0.006127844653559 |
0.004472879309167 |
0.002281168447675 |
113 |
XLM:
| Year |
Predicted High Price |
Predicted Average Price |
Predicted Low Price |
Price Change |
| 2026 |
0.256086 |
0.2082 |
0.185298 |
0 |
| 2027 |
0.26232159 |
0.232143 |
0.19500012 |
11 |
| 2028 |
0.33870824415 |
0.247232295 |
0.1631733147 |
18 |
| 2029 |
0.3691425396645 |
0.292970269575 |
0.24902472913875 |
40 |
| 2030 |
0.3972676855437 |
0.33105640461975 |
0.215186663002837 |
58 |
| 2031 |
0.444277694999704 |
0.364162045081725 |
0.345953942827638 |
74 |
IV. Investment Strategy Comparison: SGB vs XLM
Long-term vs Short-term Investment Strategies
- SGB: May be suitable for investors interested in experimental network technologies and early-stage ecosystem development, given its role as a Canary network for testing protocols such as FTSO and F-Asset systems.
- XLM: May appeal to investors focused on established cross-border payment infrastructure and digital-to-fiat currency gateway applications, considering its longer operational history since 2014.
Risk Management and Asset Allocation
- Conservative Investors: A potential allocation approach might consider XLM at a higher proportion due to its more established market presence and larger trading volume ($2,581,106.09 vs $25,913.71 in 24-hour volume), while maintaining minimal or no exposure to SGB given its significantly lower liquidity and higher volatility evidenced by a 72.43% decline over the past year.
- Aggressive Investors: Those with higher risk tolerance might explore diversified exposure across both assets, recognizing that SGB's lower price point ($0.002096) presents different risk-reward characteristics compared to XLM ($0.20868), though specific allocation percentages depend on individual risk profiles and portfolio objectives.
- Hedging Tools: Portfolio risk management strategies may include stablecoin allocations, derivatives instruments where available, and cross-asset diversification approaches.
V. Potential Risk Comparison
Market Risk
- SGB: The asset has demonstrated substantial price volatility, declining 72.43% over the past year and reaching an all-time low of $0.00192389 on January 1, 2026. The significantly lower 24-hour trading volume of $25,913.71 indicates limited liquidity, which may amplify price movements during periods of market stress.
- XLM: While experiencing a decline of 51.93% over the past year, XLM maintains considerably higher trading volume at $2,581,106.09, suggesting relatively greater market depth. However, market sentiment remains cautious, as indicated by the Fear & Greed Index reading of 32 (Fear) as of January 21, 2026.
Technical Risk
- SGB: As a Canary network for Flare, SGB operates in a testing capacity for protocols including the Flare Time Series Oracle and F-Asset systems. The experimental nature of this role may introduce uncertainties related to protocol stability and network performance during testing phases.
- XLM: Established in 2014 as a decentralized gateway for digital currency and fiat currency transmission, XLM's longer operational history provides some track record, though specific technical vulnerabilities or scalability considerations require evaluation through additional technical documentation.
Regulatory Risk
Both assets operate within evolving regulatory frameworks across different jurisdictions. Cross-border payment functionalities and digital asset classifications may subject both SGB and XLM to varying degrees of regulatory scrutiny, though specific policy impacts differ based on each asset's use cases and operational structures. Investors should monitor regulatory developments that may affect market access, exchange listings, and compliance requirements for both assets.
VI. Conclusion: Which Is the Better Buy?
📌 Investment Value Summary:
- SGB Characteristics: Functions as a Canary network for testing Flare protocols (FTSO, State Connector, F-Asset systems), positioned at a lower price point ($0.002096) with projected growth ranges from $0.0011704 to $0.006127844653559 through 2031, though accompanied by limited liquidity and higher volatility indicators.
- XLM Characteristics: Operates as an established cross-border payment infrastructure launched in 2014, maintains higher trading volume and market liquidity, with price projections ranging from $0.185298 to $0.444277694999704 through 2031, reflecting a more mature market position.
✅ Investment Considerations:
- New Investors: Those new to crypto assets may prioritize understanding liquidity dynamics, market maturity, and risk tolerance before allocation decisions. XLM's higher trading volume and longer operational history may present more accessible entry points for those seeking established market infrastructure.
- Experienced Investors: Those with deeper market knowledge might evaluate both assets within diversified portfolio contexts, considering SGB's experimental protocol testing role alongside XLM's payment-focused positioning, while applying appropriate risk management frameworks.
- Institutional Investors: Portfolio construction approaches may involve thorough due diligence on liquidity profiles, regulatory compliance frameworks, and strategic alignment with institutional investment mandates, recognizing the distinct characteristics of each asset.
⚠️ Risk Disclosure: The cryptocurrency market exhibits high volatility. This content does not constitute investment advice. All investment decisions should be based on independent research, professional consultation, and individual risk assessment.
VII. FAQ
Q1: What is the fundamental difference between Songbird (SGB) and Stellar (XLM)?
SGB serves as a Canary network for Flare, functioning as a testing environment for protocols like FTSO and F-Asset systems, while XLM operates as an established cross-border payment infrastructure for digital-to-fiat currency transmission. SGB represents an experimental testing network positioned at a lower price point ($0.002096), whereas XLM functions as a mature payment gateway launched in 2014 with significantly higher trading volume ($2,581,106.09 vs $25,913.71 in 24-hour volume) and broader market adoption for facilitating transfers among banks, payment institutions, and individuals.
Q2: Which asset experienced greater price volatility over the past year?
SGB demonstrated substantially higher volatility, declining 72.43% over the past year compared to XLM's 51.93% decline during the same period. SGB reached an all-time low of $0.00192389 on January 1, 2026, having previously peaked at $0.71334 in September 2021. The significantly lower trading volume for SGB ($25,913.71) compared to XLM ($2,581,106.09) indicates reduced liquidity, which typically amplifies price movements and contributes to increased volatility during market fluctuations.
Q3: What are the projected price ranges for SGB and XLM through 2031?
SGB's price projections range from a conservative estimate of $0.0011704 in 2026 to potential highs of $0.006127844653559 by 2031, reflecting projected growth between baseline and optimistic scenarios. XLM's forecasts indicate prices ranging from $0.185298 in conservative 2026 scenarios to potential peaks of $0.444277694999704 by 2031. These projections suggest XLM maintains higher absolute price levels throughout the forecast period, while SGB's percentage growth potential from current levels may differ due to its significantly lower starting price point.
Q4: Which asset presents lower liquidity risk?
XLM presents considerably lower liquidity risk based on current market metrics. The 24-hour trading volume comparison ($2,581,106.09 for XLM versus $25,913.71 for SGB) demonstrates that XLM maintains approximately 100 times greater trading activity, indicating deeper market depth and improved ability to execute larger transactions without substantial price impact. This liquidity differential becomes particularly significant during periods of market stress when investors may need to adjust positions quickly.
Q5: What investment strategies suit different risk profiles for these assets?
Conservative investors might consider higher XLM allocation due to its established market presence, greater liquidity, and longer operational track record since 2014, while maintaining minimal or no SGB exposure given its experimental nature and higher volatility indicators. Aggressive investors with elevated risk tolerance might explore diversified exposure across both assets, recognizing that SGB's testing network role and lower price point present different risk-reward characteristics compared to XLM's payment infrastructure positioning, though specific allocations depend on individual risk profiles and portfolio objectives.
Q6: How does the regulatory environment affect both assets differently?
Both assets operate within evolving regulatory frameworks, though their distinct functionalities create different exposure profiles. XLM's cross-border payment operations and digital-to-fiat currency gateway services may subject it to payment system regulations, money transmission laws, and financial institution compliance requirements across multiple jurisdictions. SGB's role as a Canary testing network for Flare protocols may face different regulatory considerations related to experimental blockchain infrastructure and protocol testing frameworks. Investors should monitor jurisdiction-specific developments that may impact market access, exchange listings, and compliance obligations differently for each asset.
Q7: What role does market sentiment play in current investment decisions?
Current market sentiment registers at 32 on the Fear & Greed Index, indicating a "Fear" state as of January 21, 2026. This cautious sentiment backdrop affects both assets, though potentially with different implications: XLM's established infrastructure may provide relative stability during fearful market conditions, while SGB's experimental positioning and limited liquidity may experience amplified reactions to negative sentiment shifts. Both assets have declined significantly over the past year (SGB -72.43%, XLM -51.93%), reflecting broader market uncertainty that investors should consider when evaluating entry points and position sizing decisions.
Q8: What technical capabilities differentiate these assets for ecosystem development?
SGB functions as a testing environment for Flare's FTSO (Flare Time Series Oracle), State Connector, and F-Asset systems, positioning it as an experimental network where protocols undergo validation before potential deployment on Flare mainnet. XLM operates as a decentralized gateway enabling rapid, stable, and low-cost digital asset transfers among financial institutions, focusing on cross-border payment infrastructure and fiat-to-digital currency conversion capabilities. These technical differences suggest distinct ecosystem development trajectories: SGB oriented toward protocol testing and DeFi experimentation, while XLM focuses on payment network expansion and institutional financial infrastructure integration.
* The information is not intended to be and does not constitute financial advice or any other recommendation of any sort offered or endorsed by Gate.