This comprehensive comparison examines SIGN and TRX as distinct blockchain investment opportunities. SIGN, launched in 2025, focuses on cross-chain credential verification infrastructure through Sign Protocol and TokenTable. TRX, established since 2017, dominates stablecoin transfers with 60% global market share and processes 8 million daily transactions. The analysis covers historical price trends, tokenomics, institutional adoption, technical architectures, and risk profiles across 2026-2031 projections. SIGN exhibits higher volatility ($0.03807 current price) suitable for risk-tolerant investors seeking emerging infrastructure exposure, while TRX ($0.31512 current price) appeals to those prioritizing established payment settlement infrastructure. Conservative allocations favor TRX weighting at 70-80%, whereas aggressive portfolios may explore balanced SIGN exposure. Both tokens face distinct regulatory landscapes and technical considerations requiring thorough due diligence before investment decisions on G
Introduction: Investment Comparison Between SIGN and TRX
In the cryptocurrency market, the comparison between SIGN vs TRX has become a topic of interest for investors. The two differ significantly in market cap ranking, application scenarios, and price performance, representing distinct positions within the crypto asset landscape.
SIGN: Launched in 2025, this token focuses on building global infrastructure for credential verification and token distribution. Its dual-product approach includes Sign Protocol, an omni-chain attestation protocol supporting digital public infrastructure, and TokenTable, a smart contract-based platform for token distribution.
TRX: Since its launch in 2017, TRON has established itself as a major blockchain infrastructure platform. In May 2022, TRON introduced USDD, a decentralized ultra-collateralized stablecoin, marking its entry into the decentralized stablecoin era. By October 2022, Dominica designated TRON as its national blockchain infrastructure, making it a prominent public chain collaborating with a sovereign state.
This article will provide a comprehensive analysis of SIGN vs TRX investment value comparison through historical price trends, supply mechanisms, institutional adoption, technological ecosystems, and future projections, attempting to address the question investors care about most:
"Which is the better buy right now?"
I. Historical Price Comparison and Current Market Status
Historical Price Trends of SIGN (Coin A) and TRX (Coin B)
-
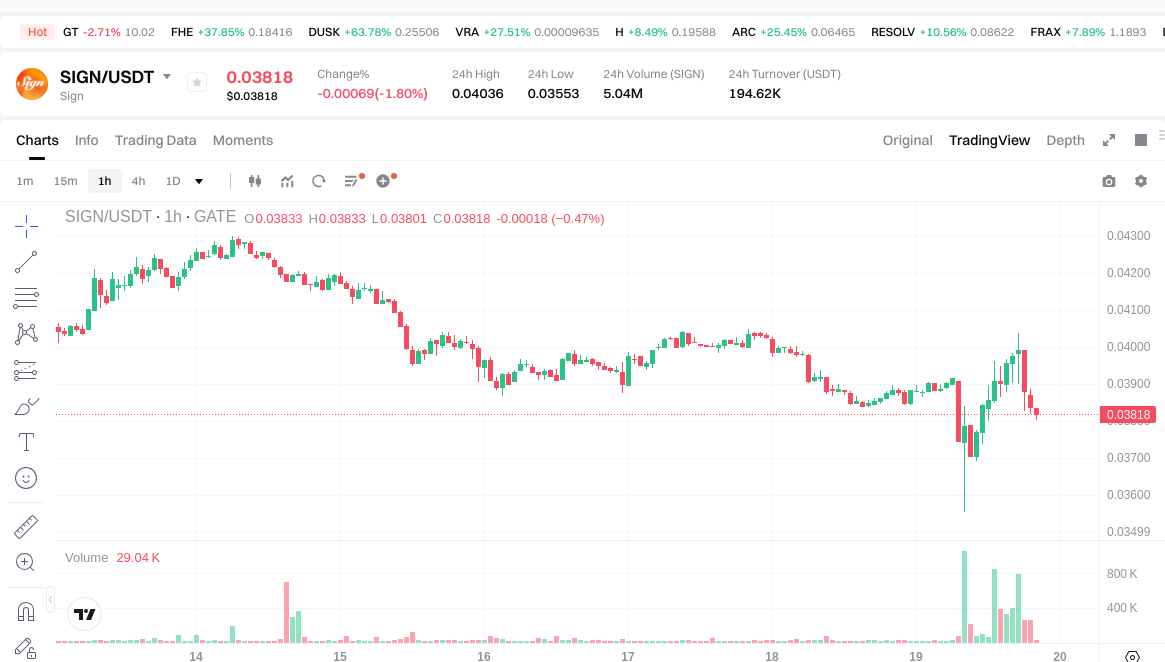
2025: SIGN experienced significant volatility following its launch in April 2025, with the price reaching an all-time high of $0.14888 on April 29, 2025. Subsequently, the token encountered downward pressure, declining to an all-time low of $0.00611 on October 10, 2025.
-
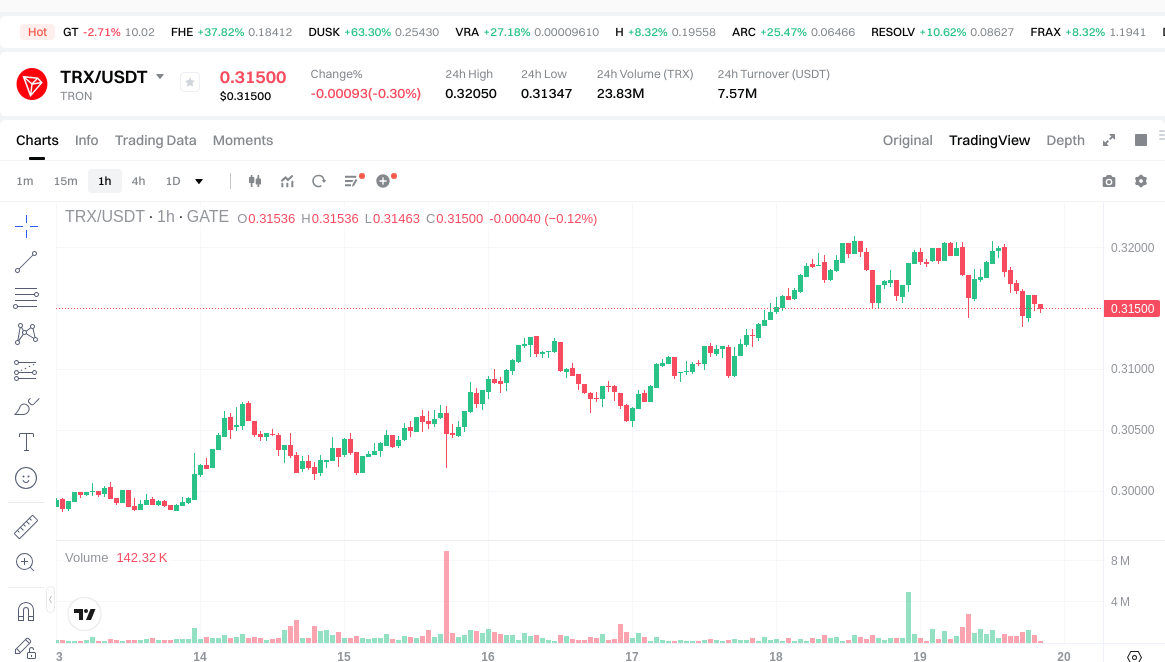
2017-2024: TRX demonstrated notable growth over several years. The token reached its all-time high of $0.431288 on December 4, 2024. Since its historical low of $0.00180434 on November 12, 2017, TRX has shown substantial appreciation over the long term.
-
Comparative Analysis: During the market cycle of 2025, SIGN declined from its peak of $0.14888 to $0.00611, representing significant volatility for a newly launched token. In contrast, TRX maintained relatively stable trading patterns, with its all-time high recorded in late 2024 and current pricing reflecting moderate fluctuations within established ranges.
Current Market Status (January 19, 2026)
- SIGN current price: $0.03807
- TRX current price: $0.31512
- 24-hour trading volume: SIGN recorded $193,742 compared to TRX's $7,599,119
- Market Sentiment Index (Fear & Greed Index): 44 (Fear)
View real-time prices:
II. Core Factors Influencing SIGN vs TRX Investment Value
Supply Mechanism Comparison (Tokenomics)
-
TRX: Operates with a capped supply model where no new TRX tokens are introduced as of January 2021. All newly distributed TRX comes from tokens initially allocated to the TRON Foundation, awarded to Super Representatives. The network employs mechanisms that may reduce TRX supply through penalties, such as consuming 9,999 TRX when applying to become a Super Representative candidate.
-
SIGN: Supply mechanism details are not extensively covered in available materials. Sign Protocol focuses on becoming a cross-chain verification standard for identity verification and asset credentials.
-
📌 Historical Pattern: TRX's supply mechanisms, including penalty-based token burns and fixed distribution to Super Representatives, contribute to deflationary pressure that may influence price cycles during periods of increased network activity.
Institutional Adoption and Market Application
-
Institutional Holdings: TRX demonstrates significant presence in the stablecoin transfer market, controlling approximately 60% of global stablecoin transaction volume. According to reference materials, TRX maintains a market capitalization aligned with institutional holdings around $100 million range.
-
Enterprise Adoption: TRX shows strong application in cross-border payments and settlements, particularly through its dominance in stablecoin infrastructure. TRON's blockchain processes an average of 8 million transactions daily, supporting its utility in payment settlements. Sign Protocol positions itself as infrastructure for decentralized verification across identity authentication and asset credentials.
-
Regulatory Landscape: Different jurisdictions maintain varying regulatory stances toward both assets. TRX faces ongoing regulatory scrutiny in multiple markets, which may impact its institutional adoption trajectory.
Technical Development and Ecosystem Construction
-
TRX Technical Infrastructure: TRON utilizes a Delegated Proof of Stake (DPoS) consensus mechanism with 27 Super Representatives who validate transactions and maintain the network. The blockchain employs a three-layer architecture including core layer, storage layer, and application layer. Block production occurs every 3 seconds with rewards of 32 TRX per valid block. The network maintains transaction fees at approximately 0.1 TRX, utilizing a bandwidth points system where each account receives 5,000 free bandwidth points daily.
-
SIGN Technical Development: Sign Protocol aims to establish itself as a cross-chain verification standard. The protocol's development focuses on identity verification and asset credential infrastructure across multiple blockchain networks.
-
Ecosystem Comparison: TRX demonstrates substantial DeFi presence with Total Value Locked reaching $15 billion. The TRON network shows compatibility with Ethereum through support for smart contracts written in Solidity, facilitating decentralized applications, NFT platforms, and payment systems. Sign Protocol's ecosystem development centers on user growth in Sign App, sovereign chain deployment, and verification infrastructure expansion.
Macroeconomic and Market Cycle Factors
-
Inflation Environment Performance: Available materials indicate varying correlations between TRX and inflation metrics. Reference data suggests TRX's relationship with inflationary conditions remains inconsistent compared to traditional inflation-hedging assets.
-
Macroeconomic Monetary Policy: Interest rate adjustments directly impact risk appetite for crypto assets including TRX. Materials note that monetary policy changes influence investor preference for crypto assets, though specific quantitative impacts on TRX remain dependent on broader market conditions.
-
Geopolitical Factors: TRX's substantial role in cross-border stablecoin transfers positions it within international payment infrastructure. The token's utility in global settlements may correlate with cross-border transaction demand and international financial conditions, though direct geopolitical impact assessments require consideration of multiple variables beyond available data scope.
III. 2026-2031 Price Forecast: SIGN vs TRX
Short-term Forecast (2026)
- SIGN: Conservative $0.0206-$0.0382 | Optimistic $0.0382-$0.0397
- TRX: Conservative $0.2552-$0.3151 | Optimistic $0.3151-$0.3907
Mid-term Forecast (2028-2029)
- SIGN may enter a consolidation phase, with projected price range of $0.0403-$0.0522
- TRX may enter an expansion phase, with projected price range of $0.2557-$0.5633
- Key drivers: institutional capital inflows, ETF developments, ecosystem growth
Long-term Forecast (2030-2031)
- SIGN: Baseline scenario $0.0268-$0.0513 | Optimistic scenario $0.0498-$0.0703
- TRX: Baseline scenario $0.3362-$0.5617 | Optimistic scenario $0.5017-$0.7591
View detailed price predictions for SIGN and TRX
Disclaimer
SIGN:
| Year |
Predicted High Price |
Predicted Average Price |
Predicted Low Price |
Price Change |
| 2026 |
0.039728 |
0.0382 |
0.020628 |
0 |
| 2027 |
0.05182212 |
0.038964 |
0.03000228 |
2 |
| 2028 |
0.0494784354 |
0.04539306 |
0.0426694764 |
19 |
| 2029 |
0.05217932247 |
0.0474357477 |
0.040320385545 |
24 |
| 2030 |
0.05130176113755 |
0.049807535085 |
0.0478152336816 |
30 |
| 2031 |
0.070270960874672 |
0.050554648111275 |
0.026793963498975 |
32 |
TRX:
| Year |
Predicted High Price |
Predicted Average Price |
Predicted Low Price |
Price Change |
| 2026 |
0.3906992 |
0.31508 |
0.2552148 |
0 |
| 2027 |
0.377591872 |
0.3528896 |
0.275253888 |
11 |
| 2028 |
0.51498943776 |
0.365240736 |
0.2556685152 |
15 |
| 2029 |
0.5633473112064 |
0.44011508688 |
0.286074806472 |
39 |
| 2030 |
0.732527550603072 |
0.5017311990432 |
0.336159903358944 |
59 |
| 2031 |
0.759069131032457 |
0.617129374823136 |
0.561587731089053 |
95 |
IV. Investment Strategy Comparison: SIGN vs TRX
Long-term vs Short-term Investment Strategies
-
SIGN: May suit investors focused on emerging verification infrastructure and early-stage protocol adoption. The token's recent launch in 2025 and significant price volatility suggest positioning for investors willing to accept higher risk in exchange for potential participation in credential verification ecosystem development. Short-term traders might consider the token's volatility patterns, while long-term holders may evaluate the protocol's progress in establishing cross-chain verification standards.
-
TRX: May appeal to investors seeking exposure to established blockchain infrastructure with demonstrated utility in stablecoin transfers and payment settlements. With presence since 2017 and substantial daily transaction volume, TRX presents characteristics potentially suitable for investors prioritizing network maturity and existing ecosystem adoption. The token's role in processing approximately 60% of global stablecoin transactions positions it for consideration by those evaluating payment infrastructure exposure.
Risk Management and Asset Allocation
-
Conservative Investors: A risk-averse allocation might consider TRX weighting of 70-80% versus SIGN at 20-30% within a crypto portfolio subset, reflecting TRX's longer operational history and established network activity compared to SIGN's emerging status.
-
Aggressive Investors: Risk-tolerant allocations might explore SIGN positioning at 40-50% versus TRX at 50-60%, acknowledging SIGN's higher volatility profile and potential correlation with verification infrastructure adoption trends.
-
Hedging Tools: Portfolio risk management approaches may incorporate stablecoin allocations for liquidity preservation, options strategies for downside protection, and cross-asset combinations that account for correlation patterns between infrastructure tokens and broader crypto market movements.
V. Potential Risk Comparison
Market Risks
-
SIGN: The token exhibits substantial volatility characteristics, having declined from $0.14888 to $0.00611 within six months of launch. Market liquidity remains limited with 24-hour trading volume of $193,742, which may amplify price sensitivity to order flow changes. The token's correlation with broader market sentiment remains subject to its early-stage market presence.
-
TRX: While demonstrating more established trading patterns, TRX faces exposure to regulatory developments affecting stablecoin infrastructure and cross-border payment networks. The token's substantial role in stablecoin transfers creates sensitivity to changes in global payment flows and potential regulatory frameworks governing digital asset transfers. Market capitalization fluctuations may reflect shifts in DeFi activity and stablecoin adoption trends.
Technical Risks
-
SIGN: As an emerging protocol, Sign Protocol's technical infrastructure faces development execution risks related to cross-chain verification implementation and ecosystem expansion. Network scalability considerations and protocol security require ongoing evaluation as adoption potentially increases.
-
TRX: The TRON network's DPoS consensus mechanism concentrates validation among 27 Super Representatives, creating considerations around validator centralization. Network stability depends on Super Representative performance and coordination. The blockchain's three-layer architecture requires maintenance of storage layer efficiency and application layer compatibility as transaction volumes scale.
Regulatory Risks
-
Global Regulatory Landscape: TRX faces ongoing regulatory scrutiny in multiple jurisdictions, particularly concerning its substantial role in stablecoin infrastructure and cross-border settlements. Changes in payment system regulations or stablecoin frameworks may impact network utility and adoption trajectories.
-
Emerging Protocol Oversight: SIGN's positioning in credential verification and identity authentication may encounter evolving regulatory frameworks governing digital identity standards and verification protocols across different jurisdictions.
-
Jurisdictional Variations: Both assets face varying regulatory approaches across markets, with potential impacts on institutional adoption, exchange listings, and integration into financial infrastructure differing by region.
VI. Conclusion: Which Is the Better Buy?
📌 Investment Value Summary:
-
SIGN Characteristics: Represents exposure to emerging verification infrastructure with focus on cross-chain attestation protocols. The token exhibits higher volatility profiles characteristic of recent launches, with potential correlation to credential verification adoption trends. Limited trading history and current market positioning at $0.03807 reflect early-stage market presence.
-
TRX Characteristics: Demonstrates established network infrastructure with substantial daily transaction volume averaging 8 million transactions. The blockchain's dominance in stablecoin transfers, controlling approximately 60% of global stablecoin transaction volume, positions TRX within payment settlement infrastructure. Total Value Locked of $15 billion indicates DeFi ecosystem presence, while current pricing at $0.31512 reflects established market trading patterns.
✅ Investment Considerations:
-
Entry-Level Participants: May prioritize understanding fundamental differences between emerging verification protocols and established payment infrastructure. Starting with smaller allocations while evaluating network development progress and ecosystem adoption metrics may support learning objectives alongside market exposure.
-
Experienced Participants: Might evaluate SIGN within emerging infrastructure allocations while assessing Sign Protocol's progress in establishing verification standards. TRX consideration may focus on payment infrastructure positioning and correlation with stablecoin adoption trends. Portfolio construction could reflect risk tolerance through allocation weighting between emerging and established network assets.
-
Institutional Participants: May analyze SIGN's verification infrastructure positioning within broader digital identity frameworks and cross-chain attestation requirements. TRX evaluation might center on payment settlement utility, regulatory landscape developments, and stablecoin infrastructure exposure. Due diligence processes typically encompass technical architecture review, ecosystem adoption metrics, and regulatory risk assessment across jurisdictions.
⚠️ Risk Disclosure: Cryptocurrency markets exhibit substantial volatility characteristics. This analysis does not constitute investment recommendations. Participants should conduct independent research, evaluate personal risk tolerance, and consider consulting qualified financial advisors before making investment decisions. Past performance does not indicate future results. Market conditions, regulatory developments, and technical factors may materially impact asset values.
VII. FAQ
Q1: What are the main differences between SIGN and TRX in terms of use cases?
SIGN focuses on credential verification and cross-chain attestation infrastructure, while TRX operates as an established blockchain platform dominating stablecoin transfers and payment settlements. SIGN's Sign Protocol aims to become a global standard for identity verification and asset credentials across multiple blockchain networks, representing emerging verification infrastructure. TRX, launched in 2017, processes approximately 60% of global stablecoin transaction volume with 8 million daily transactions, positioning itself as mature payment settlement infrastructure with $15 billion in Total Value Locked across its DeFi ecosystem.
Q2: How do the supply mechanisms of SIGN and TRX differ?
TRX operates with a capped supply model where no new tokens have been introduced since January 2021, with deflationary mechanisms including 9,999 TRX burns when applying for Super Representative candidacy. All distributed TRX comes from TRON Foundation's initial allocation awarded to Super Representatives. SIGN's supply mechanism details remain less extensively documented in available materials, though the protocol focuses on establishing cross-chain verification standards rather than implementing publicly disclosed token burn mechanisms.
Q3: Which token demonstrates higher volatility and what are the implications?
SIGN exhibits substantially higher volatility, declining from its all-time high of $0.14888 to an all-time low of $0.00611 within six months of its April 2025 launch. This represents typical volatility patterns for newly launched tokens with limited trading history and lower liquidity ($193,742 in 24-hour volume). TRX demonstrates more established trading patterns with its all-time high of $0.431288 recorded in December 2024, supported by significantly higher liquidity ($7,599,119 in 24-hour volume). Higher volatility in SIGN may present both greater risk and potential opportunity depending on investor risk tolerance and time horizons.
Q4: What role do institutional factors play in TRX's market position?
TRX demonstrates significant institutional presence through its dominance in stablecoin infrastructure, controlling approximately 60% of global stablecoin transaction volume. The network's utility in cross-border payments and settlements, combined with its designation as Dominica's national blockchain infrastructure in October 2022, reflects institutional-grade adoption. The blockchain's DPoS consensus mechanism with 27 Super Representatives, three-layer architecture, and compatibility with Ethereum smart contracts (Solidity support) facilitate enterprise integration. However, ongoing regulatory scrutiny in multiple jurisdictions remains a consideration for institutional adoption trajectories.
Q5: How do the technical architectures of SIGN and TRX compare?
TRX utilizes a Delegated Proof of Stake (DPoS) consensus mechanism with 27 Super Representatives validating transactions every 3 seconds, rewarding 32 TRX per valid block. The network employs a three-layer architecture (core, storage, and application layers) with transaction fees around 0.1 TRX and 5,000 free daily bandwidth points per account. SIGN's Sign Protocol focuses on cross-chain verification standards for identity authentication and asset credentials, though detailed technical architecture specifications remain less extensively documented. TRX's established infrastructure supports smart contracts, DeFi applications, and NFT platforms, while SIGN's development centers on verification protocol implementation across multiple blockchain networks.
Q6: What are the projected price trajectories for 2026-2031?
For 2026, SIGN's conservative forecast ranges $0.0206-$0.0382 with optimistic scenarios reaching $0.0382-$0.0397, while TRX projects $0.2552-$0.3151 conservatively and $0.3151-$0.3907 optimistically. By 2030-2031, SIGN's baseline scenario suggests $0.0268-$0.0513 with optimistic potential of $0.0498-$0.0703, whereas TRX baseline projects $0.3362-$0.5617 and optimistic scenarios of $0.5017-$0.7591. These forecasts reflect SIGN's consolidation phase during 2028-2029 ($0.0403-$0.0522) compared to TRX's expansion phase ($0.2557-$0.5633), driven by factors including institutional capital flows, ETF developments, and ecosystem growth trajectories.
Q7: What allocation strategies suit different investor profiles?
Conservative investors might consider TRX weighting of 70-80% versus SIGN at 20-30% within crypto portfolio subsets, reflecting TRX's longer operational history since 2017 and established network activity compared to SIGN's emerging status. Aggressive investors exploring higher risk-reward profiles might allocate SIGN at 40-50% versus TRX at 50-60%, acknowledging SIGN's volatility and potential correlation with verification infrastructure adoption. Entry-level participants may prioritize smaller allocations while evaluating network development progress, whereas experienced participants might assess SIGN within emerging infrastructure allocations and TRX for payment infrastructure exposure. Institutional participants typically conduct comprehensive due diligence encompassing technical architecture review, ecosystem metrics, and regulatory risk assessment across jurisdictions.
Q8: What are the primary regulatory considerations for both tokens?
TRX faces ongoing regulatory scrutiny in multiple jurisdictions, particularly concerning its substantial role in stablecoin infrastructure and cross-border payment settlements, with approximately 60% market share in global stablecoin transactions. Changes in payment system regulations or stablecoin frameworks may impact network utility and adoption trajectories differently across regions. SIGN's positioning in credential verification and identity authentication may encounter evolving regulatory frameworks governing digital identity standards and verification protocols across jurisdictions. Both assets face varying regulatory approaches across markets, potentially impacting institutional adoption, exchange listings, and financial infrastructure integration. Jurisdictional variations create different compliance landscapes that participants should evaluate based on their operational locations and regulatory exposure.
* The information is not intended to be and does not constitute financial advice or any other recommendation of any sort offered or endorsed by Gate.