Explore the investment potential of SLAY and LRC, comparing their historical price trends, market status, and technical innovations. Address key investment questions, aiding in decision-making for both new and seasoned investors. Understand asset management strategies, market demand dynamics, and risk assessments. Analyze predictions up to 2030, offering insights into long-term and short-term investment strategies. Discover how daily asset balances and technical factors influence valuation and investment strategies. Access real-time pricing and research tools on Gate to guide your investment journey.
Introduction: SLAY vs LRC Investment Comparison
In the cryptocurrency market, the comparison between SLAY and LRC has been an unavoidable topic for investors. The two not only show significant differences in market cap ranking, application scenarios, and price performance, but also represent different positioning in the crypto asset space.
SatLayer (SLAY): Since its launch, it has gained market recognition for its role as the economic layer for Bitcoin, making BTC a programmable asset for various applications.
Loopring (LRC): Introduced in 2017, it has been recognized as an open, multi-token transaction protocol based on ERC20 and smart contracts, aiming to establish decentralized exchange applications.
This article will comprehensively analyze the investment value comparison between SLAY and LRC, focusing on historical price trends, supply mechanisms, institutional adoption, technological ecosystems, and future predictions, attempting to answer the question most concerning to investors:
"Which is the better buy right now?"
I. Price History Comparison and Current Market Status
SatLayer (SLAY) and Loopring (LRC) Historical Price Trends
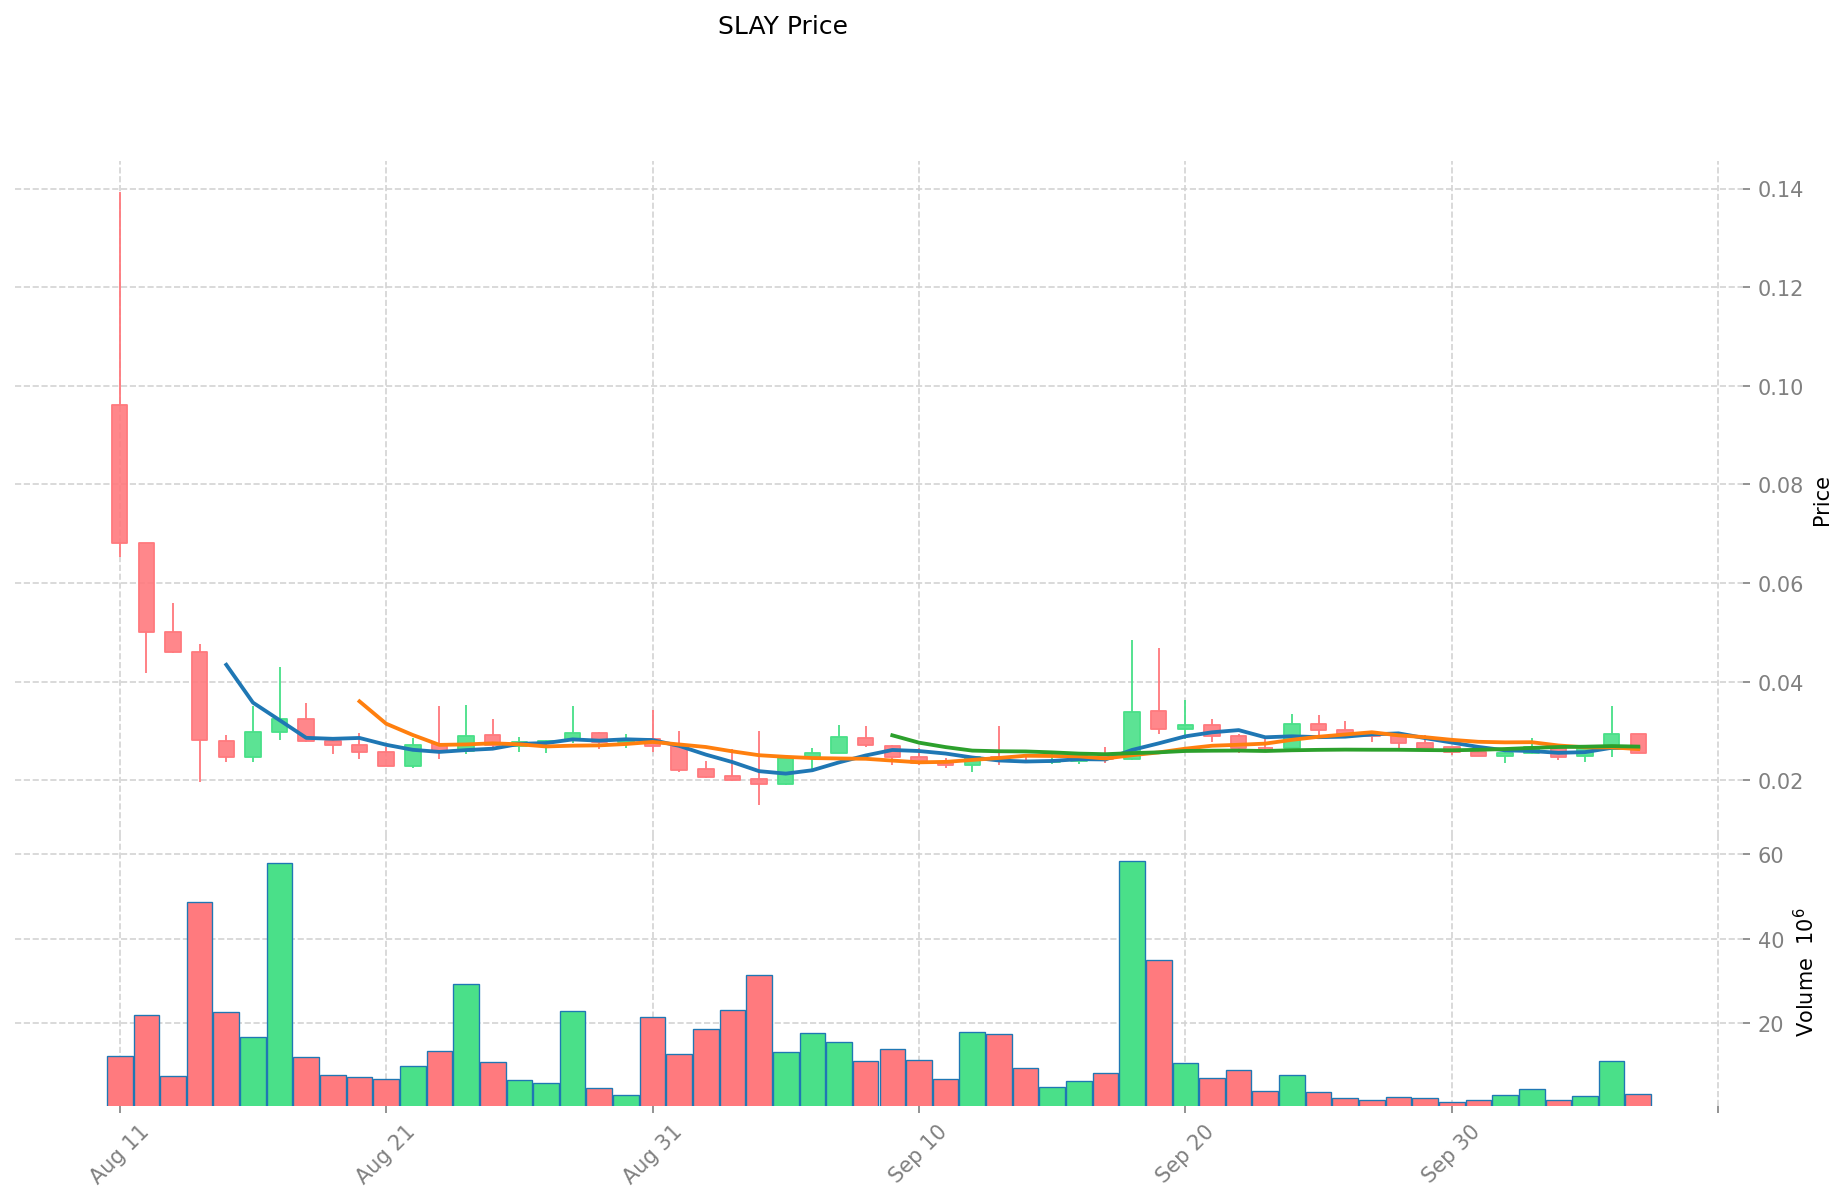
- 2025: SLAY reached its all-time high of $0.13933 on August 11, 2025.
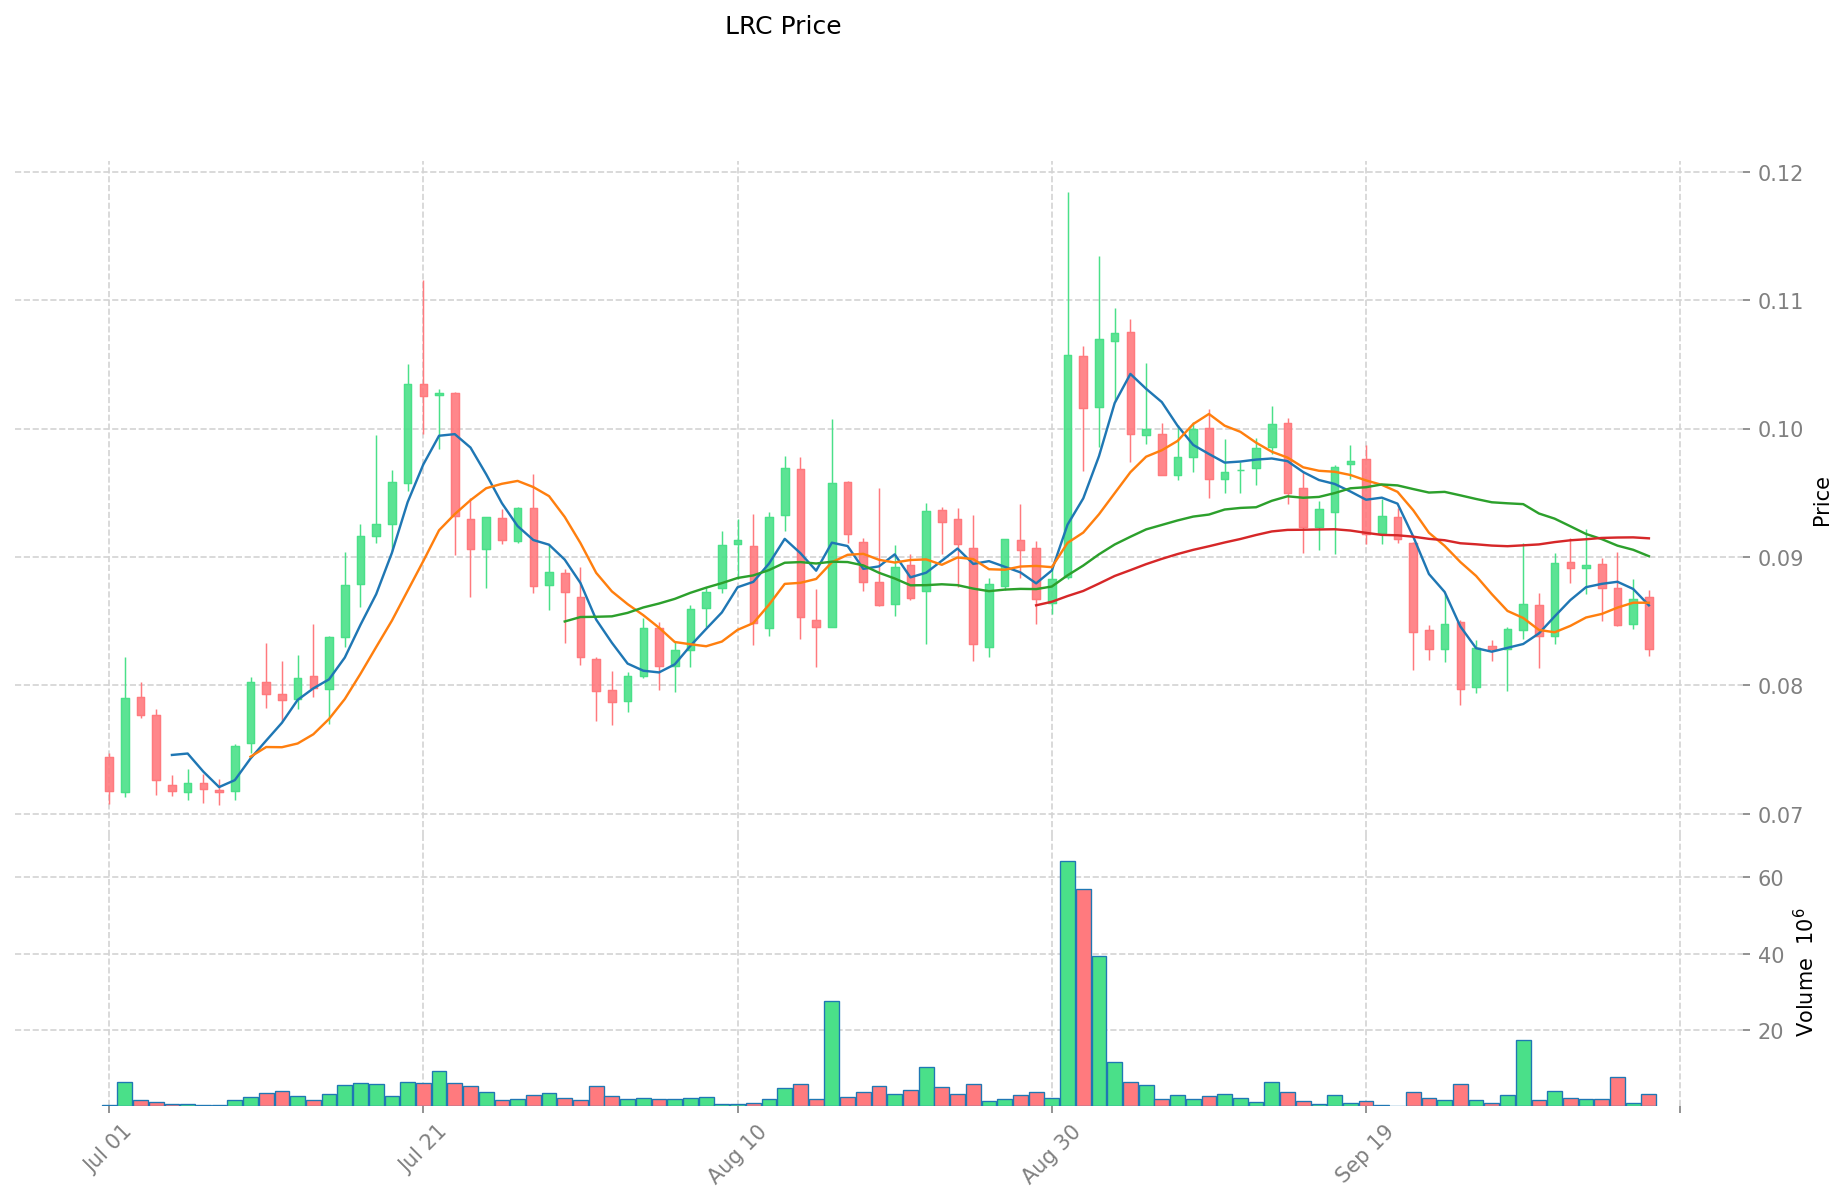
- 2025: LRC experienced significant price volatility, with a 52-week range of $0.4714 to $2.39.
- Comparative analysis: In the recent market cycle, SLAY dropped from its high of $0.13933 to a low of $0.01491, while LRC showed less extreme fluctuations.
Current Market Situation (2025-10-08)
- SLAY current price: $0.02553
- LRC current price: $0.0831
- 24-hour trading volume: SLAY $88,029.27 vs LRC $274,776.89
- Market Sentiment Index (Fear & Greed Index): 70 (Greed)
Click to view real-time prices:
- View SLAY current price Market Price
- View LRC current price Market Price
Core Factors Affecting SLAY vs LRC Investment Value
Daily Average Asset Balance
- The core rule introduces the concept of "daily average asset balance," which has been commonly used in banking statistics
- This is the first time this concept has been introduced to L2 projects
- The rule is considered reasonable for Layer 2 transactions
Asset Management
- Asset management is a direct factor influencing investment returns
- Proper management of crypto assets can significantly impact overall investment performance
- The balance management approach differs between traditional banking and L2 projects
Market Demand
- Market demand directly influences the investment value of both SLAY and LRC
- The growing demand for Layer 2 solutions may affect both tokens' valuation
- Understanding market trends is essential for evaluating long-term investment potential
Technical Innovation
- Technical innovation serves as a key differentiator between competing crypto assets
- Innovations in L2 technology can provide competitive advantages
- The implementation of new features may drive adoption and increase token value
III. 2025-2030 Price Prediction: SLAY vs LRC
Short-term Prediction (2025)
- SLAY: Conservative $0.0199-$0.0255 | Optimistic $0.0255-$0.0329
- LRC: Conservative $0.0439-$0.0828 | Optimistic $0.0828-$0.1193
Mid-term Prediction (2027)
- SLAY may enter a growth phase, with an estimated price range of $0.0318-$0.0388
- LRC may enter a bullish market, with an estimated price range of $0.0881-$0.1510
- Key drivers: Institutional capital inflow, ETF developments, ecosystem growth
Long-term Prediction (2030)
- SLAY: Base scenario $0.0445-$0.0489 | Optimistic scenario $0.0489-$0.0694
- LRC: Base scenario $0.1011-$0.1714 | Optimistic scenario $0.1714-$0.1954
View detailed price predictions for SLAY and LRC
Disclaimer: The above predictions are based on historical data and market analysis. Cryptocurrency markets are highly volatile and subject to change. This information should not be considered as financial advice. Always conduct your own research before making investment decisions.
SLAY:
| 年份 |
预测最高价 |
预测平均价格 |
预测最低价 |
涨跌幅 |
| 2025 |
0.0329208 |
0.02552 |
0.0199056 |
0 |
| 2026 |
0.037109908 |
0.0292204 |
0.02337632 |
14 |
| 2027 |
0.03880323018 |
0.033165154 |
0.03183854784 |
29 |
| 2028 |
0.0435408724289 |
0.03598419209 |
0.0298668794347 |
40 |
| 2029 |
0.058053297098797 |
0.03976253225945 |
0.036183904356099 |
55 |
| 2030 |
0.069449238844355 |
0.048907914679123 |
0.044506202358002 |
91 |
LRC:
| 年份 |
预测最高价 |
预测平均价格 |
预测最低价 |
涨跌幅 |
| 2025 |
0.1193328 |
0.08287 |
0.0439211 |
0 |
| 2026 |
0.150641086 |
0.1011014 |
0.072793008 |
21 |
| 2027 |
0.1510454916 |
0.125871243 |
0.0881098701 |
51 |
| 2028 |
0.189687963201 |
0.1384583673 |
0.123227946897 |
66 |
| 2029 |
0.178839750123045 |
0.1640731652505 |
0.113210484022845 |
97 |
| 2030 |
0.19546036176292 |
0.171456457686772 |
0.101159310035195 |
106 |
IV. Investment Strategy Comparison: SLAY vs LRC
Long-term vs Short-term Investment Strategies
- SLAY: Suitable for investors focused on Bitcoin ecosystem growth and Layer 2 potential
- LRC: Suitable for investors interested in Ethereum-based decentralized exchange protocols
Risk Management and Asset Allocation
- Conservative investors: SLAY: 30% vs LRC: 70%
- Aggressive investors: SLAY: 60% vs LRC: 40%
- Hedging tools: Stablecoin allocation, options, cross-currency portfolios
V. Potential Risk Comparison
Market Risk
- SLAY: Highly dependent on Bitcoin's market performance and adoption of Layer 2 solutions
- LRC: Vulnerable to overall Ethereum ecosystem health and competition from other DEX protocols
Technical Risk
- SLAY: Scalability, network stability
- LRC: Smart contract vulnerabilities, potential issues with zkRollup implementation
Regulatory Risk
- Global regulatory policies may impact both tokens differently, with potential scrutiny on Layer 2 solutions and decentralized exchanges
VI. Conclusion: Which Is the Better Buy?
📌 Investment Value Summary:
- SLAY advantages: Strong connection to Bitcoin ecosystem, potential for growth as BTC becomes more programmable
- LRC advantages: Established presence in Ethereum DeFi space, focus on decentralized exchange technology
✅ Investment Advice:
- New investors: Consider a balanced approach, leaning towards LRC for its more established market presence
- Experienced investors: Explore opportunities in both, with a slight preference for SLAY due to its growth potential
- Institutional investors: Evaluate both based on specific portfolio needs and risk tolerance
⚠️ Risk Warning: Cryptocurrency markets are highly volatile. This article does not constitute investment advice.
None
VII. FAQ
Q1: What are the main differences between SLAY and LRC?
A: SLAY is focused on Bitcoin's ecosystem as an economic layer, while LRC is an Ethereum-based protocol for decentralized exchanges. SLAY aims to make BTC programmable, whereas LRC facilitates token swaps on Ethereum.
Q2: Which token has shown better price performance recently?
A: Based on recent data, LRC has shown less extreme price fluctuations compared to SLAY. LRC's 52-week range was $0.4714 to $2.39, while SLAY dropped from its all-time high of $0.13933 to a low of $0.01491.
Q3: What are the key factors affecting the investment value of SLAY and LRC?
A: The main factors include daily average asset balance, asset management practices, market demand for Layer 2 solutions, and technical innovations in their respective ecosystems.
Q4: How do the long-term price predictions for SLAY and LRC compare?
A: For 2030, SLAY's base scenario predicts a range of $0.0445-$0.0489, with an optimistic scenario of $0.0489-$0.0694. LRC's base scenario for 2030 is $0.1011-$0.1714, with an optimistic scenario of $0.1714-$0.1954.
Q5: What are the primary risks associated with investing in SLAY and LRC?
A: Both face market risks tied to their respective ecosystems (Bitcoin for SLAY, Ethereum for LRC), technical risks related to scalability and smart contract vulnerabilities, and potential regulatory risks as the cryptocurrency space evolves.
Q6: How should investors allocate their portfolio between SLAY and LRC?
A: Conservative investors might consider 30% SLAY and 70% LRC, while aggressive investors could opt for 60% SLAY and 40% LRC. However, individual allocation should be based on personal risk tolerance and investment goals.
Q7: Which token is considered a better buy for new investors?
A: For new investors, LRC may be considered a slightly better option due to its more established market presence in the Ethereum DeFi space. However, a balanced approach considering both tokens is recommended.
* The information is not intended to be and does not constitute financial advice or any other recommendation of any sort offered or endorsed by Gate.


