This comprehensive analysis compares SOUL and QNT, two leading blockchain infrastructure tokens launched in 2018. SOUL (Phantasma) focuses on decentralized content delivery with privacy emphasis, currently trading at $0.01693 with low liquidity of $14,494.97. QNT (Quant Network) specializes in blockchain interoperability via Overledger, trading at $64.87 with superior liquidity at $873,124.39 on Gate. The article examines historical price trends, tokenomics, technical ecosystems, and market dynamics to guide investment decisions. Price forecasts through 2031 suggest distinct recovery trajectories for each asset. Investment strategies differ by risk profile: conservative investors may favor QNT's established market position, while aggressive investors might pursue SOUL's speculative potential. Detailed risk analysis addresses liquidity constraints, market volatility, and regulatory considerations essential for portfolio allocation decisions.
Introduction: Investment Comparison Between SOUL and QNT
In the cryptocurrency market, the comparison between SOUL vs QNT continues to draw investor attention. These two digital assets differ notably in market cap ranking, application scenarios, and price performance, representing distinct positions within the crypto ecosystem.
Phantasma (SOUL): Launched in 2018, this next-generation messaging protocol has positioned itself as a decentralized content delivery system with emphasis on privacy and security.
Quant (QNT): Since its inception in 2018, Quant Network has been recognized for solving blockchain interoperability challenges through its Overledger operating system, establishing itself as a technology provider for enterprise blockchain adoption.
This article examines SOUL vs QNT through analysis of historical price trends, supply mechanisms, technical ecosystems, and market dynamics. We address key considerations for investors evaluating these assets:
"Which is the better buy right now?"
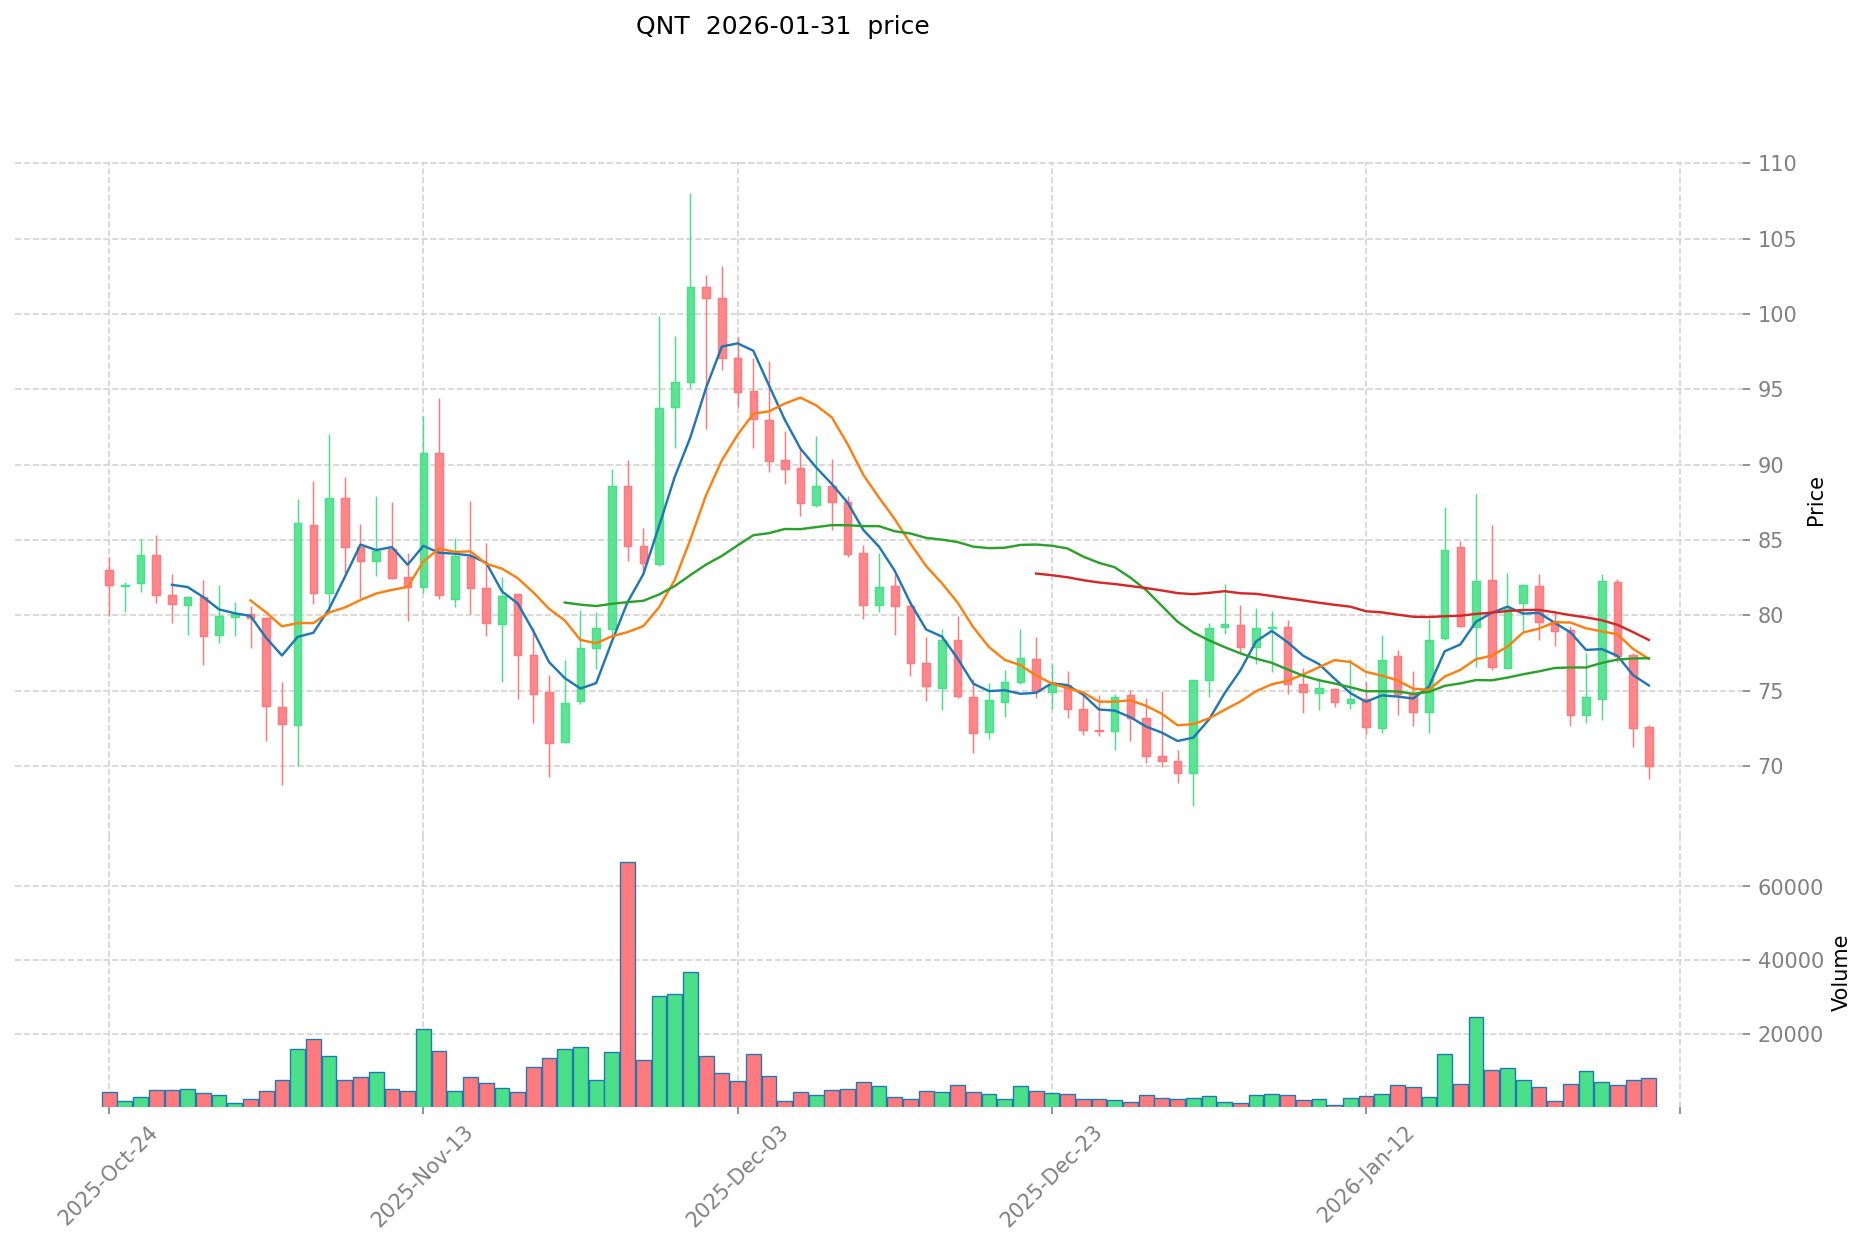
I. Historical Price Comparison and Current Market Status
SOUL (Coin A) and QNT (Coin B) Historical Price Trends
-
2021: SOUL experienced significant price movement, reaching a historical high of $3.96 on December 1, 2021. During the same period, QNT reached its all-time high of $427.42 on September 11, 2021, reflecting strong market momentum across both assets during the broader cryptocurrency bull market.
-
2020: SOUL recorded its historical low of $0.00960482 on March 16, 2020, coinciding with broader market downturns. QNT also experienced its historical low of $0.215773 on August 23, 2018, during an earlier market correction phase.
-
Comparative Analysis: Throughout recent market cycles, SOUL has declined from its peak of $3.96 to current levels around $0.01693, representing a substantial decrease. Meanwhile, QNT has decreased from its high of $427.42 to approximately $64.87, showing a similar downward trend pattern, though at different magnitude levels relative to their respective historical ranges.
Current Market Status (February 1, 2026)
- SOUL Current Price: $0.01693
- QNT Current Price: $64.87
- 24-Hour Trading Volume: SOUL recorded $14,494.97 compared to QNT's significantly higher volume of $873,124.39
- Market Sentiment Index (Fear & Greed Index): 20 (Extreme Fear)
View Real-Time Prices:

II. Core Factors Affecting SOUL vs QNT Investment Value
Supply Mechanism Comparison (Tokenomics)
- SOUL: The reference materials do not contain specific information regarding SOUL's supply mechanism or tokenomics structure.
- QNT: The reference materials do not contain specific information regarding QNT's supply mechanism or tokenomics structure.
- 📌 Historical Pattern: Supply mechanisms can play a role in influencing price cycles through factors such as scarcity dynamics and predictable issuance schedules, though specific historical data for these assets is not available in the provided materials.
Institutional Adoption and Market Application
- Institutional Holdings: The reference materials do not provide comparative data on institutional preference between SOUL and QNT.
- Enterprise Adoption: Information regarding SOUL or QNT applications in cross-border payments, settlements, or investment portfolios is not available in the provided materials.
- National Policies: The reference materials do not contain information about regulatory attitudes toward these assets in different jurisdictions.
Technology Development and Ecosystem Building
- SOUL Technology Upgrades: The reference materials do not contain information about SOUL's technical development or upgrades.
- QNT Technology Development: The reference materials do not contain information about QNT's technical development or upgrades.
- Ecosystem Comparison: Information regarding DeFi, NFT, payment systems, or smart contract implementation for either asset is not available in the provided materials.
Macroeconomic Factors and Market Cycles
- Performance in Inflationary Environments: The reference materials do not provide data on how either asset performs as an inflation hedge.
- Macroeconomic Monetary Policy: Information about the impact of interest rates or dollar index movements on these assets is not available in the provided materials.
- Geopolitical Factors: The reference materials do not contain information about cross-border transaction demand or international developments affecting these assets.
III. 2026-2031 Price Forecast: SOUL vs QNT
Short-term Forecast (2026)
- SOUL: Conservative $0.011122 - $0.0166 | Optimistic $0.0166 - $0.018758
- QNT: Conservative $38.7158 - $65.62 | Optimistic $65.62 - $85.306
Mid-term Forecast (2028-2029)
- SOUL may enter a gradual recovery phase, with projected price range of $0.0134 - $0.0330
- QNT may enter a growth consolidation phase, with projected price range of $49.31 - $122.87
- Key drivers: institutional capital flows, ETF developments, ecosystem expansion
Long-term Forecast (2030-2031)
- SOUL: Base scenario $0.0209 - $0.0307 | Optimistic scenario $0.0271 - $0.0318
- QNT: Base scenario $58.34 - $139.56 | Optimistic scenario $114.39 - $185.61
View detailed price predictions for SOUL and QNT
Disclaimer
SOUL:
| Year |
Predicted High Price |
Predicted Average Price |
Predicted Low Price |
Price Change |
| 2026 |
0.018758 |
0.0166 |
0.011122 |
-1 |
| 2027 |
0.02616492 |
0.017679 |
0.01697184 |
4 |
| 2028 |
0.0300330852 |
0.02192196 |
0.0133723956 |
29 |
| 2029 |
0.032991453702 |
0.0259775226 |
0.013768086978 |
53 |
| 2030 |
0.03184324720308 |
0.029484488151 |
0.02712572909892 |
74 |
| 2031 |
0.031583783707351 |
0.03066386767704 |
0.020851430020387 |
81 |
QNT:
| Year |
Predicted High Price |
Predicted Average Price |
Predicted Low Price |
Price Change |
| 2026 |
85.306 |
65.62 |
38.7158 |
1 |
| 2027 |
107.15746 |
75.463 |
41.50465 |
16 |
| 2028 |
120.5295036 |
91.31023 |
49.3075242 |
40 |
| 2029 |
122.867045488 |
105.9198668 |
85.795092108 |
63 |
| 2030 |
164.72657684736 |
114.393456144 |
58.34066263344 |
76 |
| 2031 |
185.6148219392544 |
139.56001649568 |
125.604014846112 |
115 |
IV. Investment Strategy Comparison: SOUL vs QNT
Long-term vs Short-term Investment Strategies
-
SOUL: May suit investors interested in speculative positions with higher risk tolerance, given its lower price point and significant historical volatility. The asset's current market position suggests it appeals to those willing to accept substantial price fluctuations in exchange for potential recovery scenarios.
-
QNT: May attract investors seeking exposure to blockchain interoperability solutions with a focus on enterprise adoption potential. The asset's higher absolute price level and historical market presence suggest positioning for those interested in technology infrastructure plays within the cryptocurrency sector.
Risk Management and Asset Allocation
- Conservative Investors: SOUL 10-15% vs QNT 85-90% allocation ratio could reflect lower risk appetite, emphasizing the more established market position
- Aggressive Investors: SOUL 30-40% vs QNT 60-70% allocation might suit those seeking higher volatility exposure while maintaining diversification
- Hedging Tools: Stablecoin reserves for portfolio stability, options strategies for downside protection, cross-asset diversification across multiple cryptocurrency categories
V. Potential Risk Comparison
Market Risks
-
SOUL: Lower trading volume of $14,494.97 indicates limited liquidity, which may result in wider bid-ask spreads and increased price slippage during position entries and exits. The substantial decline from historical highs suggests elevated volatility risk.
-
QNT: Higher trading volume of $873,124.39 provides relatively better liquidity conditions, though still subject to broader cryptocurrency market sentiment shifts. The asset demonstrates correlation with overall market cycles, as evidenced by its historical price movements.
Technical Risks
-
SOUL: Information regarding network scalability, infrastructure stability, or technical development roadmap is not available in the reference materials.
-
QNT: Data concerning network architecture resilience, security audit history, or potential technical vulnerabilities is not available in the reference materials.
Regulatory Risks
- Both assets operate within an evolving global regulatory environment for digital assets. Jurisdictional differences in cryptocurrency classification, taxation policies, and compliance requirements may impact trading availability and institutional adoption patterns differently for each asset.
VI. Conclusion: Which Is the Better Buy?
📌 Investment Value Summary:
-
SOUL Considerations: Lower entry price point with speculative recovery potential; however, limited liquidity and substantial distance from historical peaks present elevated risk factors
-
QNT Considerations: Established market presence with focus on enterprise blockchain interoperability solutions; higher trading volume suggests relatively improved liquidity conditions compared to SOUL
✅ Investment Considerations:
-
Novice Investors: Consider starting with smaller position sizes in either asset, prioritizing education on cryptocurrency market dynamics and maintaining disciplined risk management practices. Diversification across multiple assets may help mitigate concentration risk.
-
Experienced Investors: May evaluate portfolio allocation based on risk tolerance, market outlook, and conviction regarding each project's development trajectory. Technical analysis of historical price patterns and volume trends could inform entry and exit strategies.
-
Institutional Investors: Assessment should incorporate due diligence on regulatory compliance status, liquidity depth for larger position sizes, and alignment with institutional investment mandates. Reference materials do not provide specific institutional adoption data for either asset.
⚠️ Risk Disclosure: The cryptocurrency market exhibits extreme volatility. This content does not constitute investment advice, financial guidance, or trading recommendations. Market conditions can change rapidly, and past performance does not indicate future results. Investors should conduct independent research and consider consulting qualified financial advisors before making investment decisions.
VII. FAQ
Q1: What are the main differences between SOUL and QNT in terms of their core technology and purpose?
SOUL (Phantasma) focuses on decentralized content delivery with emphasis on privacy and security as a next-generation messaging protocol, while QNT (Quant Network) specializes in blockchain interoperability through its Overledger operating system, targeting enterprise blockchain adoption. QNT addresses the technical challenge of connecting different blockchain networks, positioning itself as infrastructure for institutional use cases, whereas SOUL concentrates on secure content transmission and decentralized messaging applications. Both launched in 2018 but serve fundamentally different market segments within the cryptocurrency ecosystem.
Q2: How does the liquidity difference between SOUL and QNT impact trading and investment decisions?
SOUL's 24-hour trading volume of $14,494.97 indicates significantly lower liquidity compared to QNT's $873,124.39, creating approximately 60x difference in market depth. This disparity means SOUL investors face higher risks of price slippage, wider bid-ask spreads, and potential difficulty executing larger trades without moving the market. QNT's superior liquidity provides more stable entry and exit points, making it more suitable for investors requiring predictable execution, while SOUL's limited liquidity appeals primarily to smaller position traders willing to accept increased execution risk in exchange for speculative positioning.
Q3: Which asset experienced greater volatility from its historical peak to current price levels?
SOUL has declined approximately 99.6% from its December 2021 peak of $3.96 to the current price of $0.01693, while QNT has decreased approximately 84.8% from its September 2021 high of $427.42 to $64.87. In percentage terms, SOUL demonstrates substantially higher volatility with a more severe drawdown from historical highs. This pattern suggests SOUL carries higher risk-reward characteristics, with greater downside realized but potentially larger percentage recovery potential, whereas QNT has maintained relatively more value retention despite significant decline from peak levels.
Q4: What portfolio allocation strategies might suit different investor risk profiles when considering SOUL vs QNT?
Conservative investors might consider a 10-15% SOUL to 85-90% QNT allocation, emphasizing the more established market position and superior liquidity of QNT while maintaining limited speculative exposure through SOUL. Aggressive investors could explore 30-40% SOUL versus 60-70% QNT ratios, accepting higher volatility in exchange for potential recovery scenarios in the lower-priced asset. Both strategies assume cryptocurrency allocation represents only a portion of overall portfolio diversification, with stablecoin reserves recommended for rebalancing opportunities and risk management across market cycles.
Q5: How do the price forecasts for 2026-2031 differ between SOUL and QNT?
SOUL projections show conservative 2026 range of $0.011122-$0.0166 with potential long-term 2031 reach of $0.020851-$0.031584, representing potential maximum gains of approximately 87% from current levels over five years. QNT forecasts indicate 2026 conservative range of $38.7158-$65.62 with 2031 projections of $58.34-$185.61, suggesting potential maximum upside of approximately 186% from current prices. QNT demonstrates higher absolute price appreciation potential in dollar terms, while SOUL shows comparable percentage-based recovery potential from its significantly lower base price, reflecting different risk-reward profiles for investor consideration.
Q6: What role does the current market sentiment (Fear & Greed Index at 20) play in evaluating these assets?
The Extreme Fear reading of 20 on the Fear & Greed Index indicates widespread market pessimism, historically associated with potential accumulation opportunities for long-term investors but also reflecting genuine downside risks. For both SOUL and QNT, this sentiment context suggests prices may face continued pressure from risk-averse behavior and limited capital inflows. Contrarian investors might view extreme fear as potential buying opportunity, while risk-averse participants may prefer waiting for sentiment improvement. Both assets have declined substantially from historical peaks during this fearful market environment, though recovery timing and magnitude remain uncertain regardless of current sentiment extremes.
Q7: What are the key liquidity and execution risks specific to trading SOUL compared to QNT?
SOUL's significantly lower trading volume creates practical challenges including potential inability to execute large orders without substantial price impact, limited order book depth resulting in wider spreads between buy and sell prices, and reduced availability of sophisticated trading tools like options or leveraged products. QNT's 60x higher daily volume provides more predictable execution for standard trade sizes, better price discovery mechanisms, and potentially more exchange listing options. Investors planning position sizes exceeding $5,000-$10,000 in SOUL should particularly consider splitting orders across time periods, while QNT can accommodate larger single transactions with relatively less market impact concerns.
Q8: How should investors approach risk management differently for SOUL versus QNT positions?
SOUL positions warrant tighter stop-loss parameters due to higher volatility and lower liquidity—potentially 15-25% maximum drawdown thresholds—with smaller initial position sizes relative to total portfolio allocation given execution risks. QNT risk management might employ 25-35% stop-loss levels reflecting its more established price structure, with larger position sizes feasible due to superior liquidity conditions. Both assets benefit from diversification across multiple cryptocurrencies rather than concentration, stablecoin reserve maintenance for rebalancing opportunities, and regular portfolio rebalancing to maintain target allocations as relative performance diverges across market cycles.
* The information is not intended to be and does not constitute financial advice or any other recommendation of any sort offered or endorsed by Gate.