This comprehensive SOV vs HBAR comparison analyzes two emerging blockchain tokens with distinct market positions and investment potential. SOV focuses on decentralized finance infrastructure for Bitcoin lending and margin trading, while HBAR emphasizes high-throughput distributed ledger technology using hashgraph consensus. The article examines historical price trends, showing HBAR's relative stability ($0.09862 current price, $4.24B market cap) compared to SOV's volatility ($0.05937 price, $2.92M market cap), supported by significantly higher HBAR liquidity. Core factors including tokenomics, institutional adoption, and technology ecosystems reveal different growth trajectories through 2031. Investment strategies are tailored for conservative investors favoring HBAR and aggressive investors seeking SOV exposure. Risk analysis covers market volatility, technical infrastructure, and regulatory frameworks affecting both tokens on Gate platform.
Introduction: SOV vs HBAR Investment Comparison
In the cryptocurrency market, the comparison between SOV vs HBAR remains a topic investors cannot avoid. The two differ significantly in market cap ranking, application scenarios, and price performance, representing distinct positions within the crypto asset landscape.
SOV: Launched in 2021, Sovryn has gained recognition through its focus on non-custodial Bitcoin lending and margin trading systems.
HBAR: Introduced in 2020, Hedera has been known for its hashgraph consensus mechanism, delivering high throughput and security in distributed ledger technology.
This article will comprehensively analyze the investment value comparison between SOV vs HBAR, covering historical price trends, supply mechanisms, institutional adoption, technical ecosystems, and future predictions, attempting to answer the question most concerning to investors:
"Which is the better buy right now?"
I. Historical Price Comparison and Market Status
SOV and HBAR Historical Price Trends
-
2021: SOV reached a peak price of $43.98 on October 7, 2021, reflecting early-stage interest in the Sovryn ecosystem. Meanwhile, HBAR achieved its all-time high of $0.569229 on September 15, 2021, driven by growing adoption of the Hedera network.
-
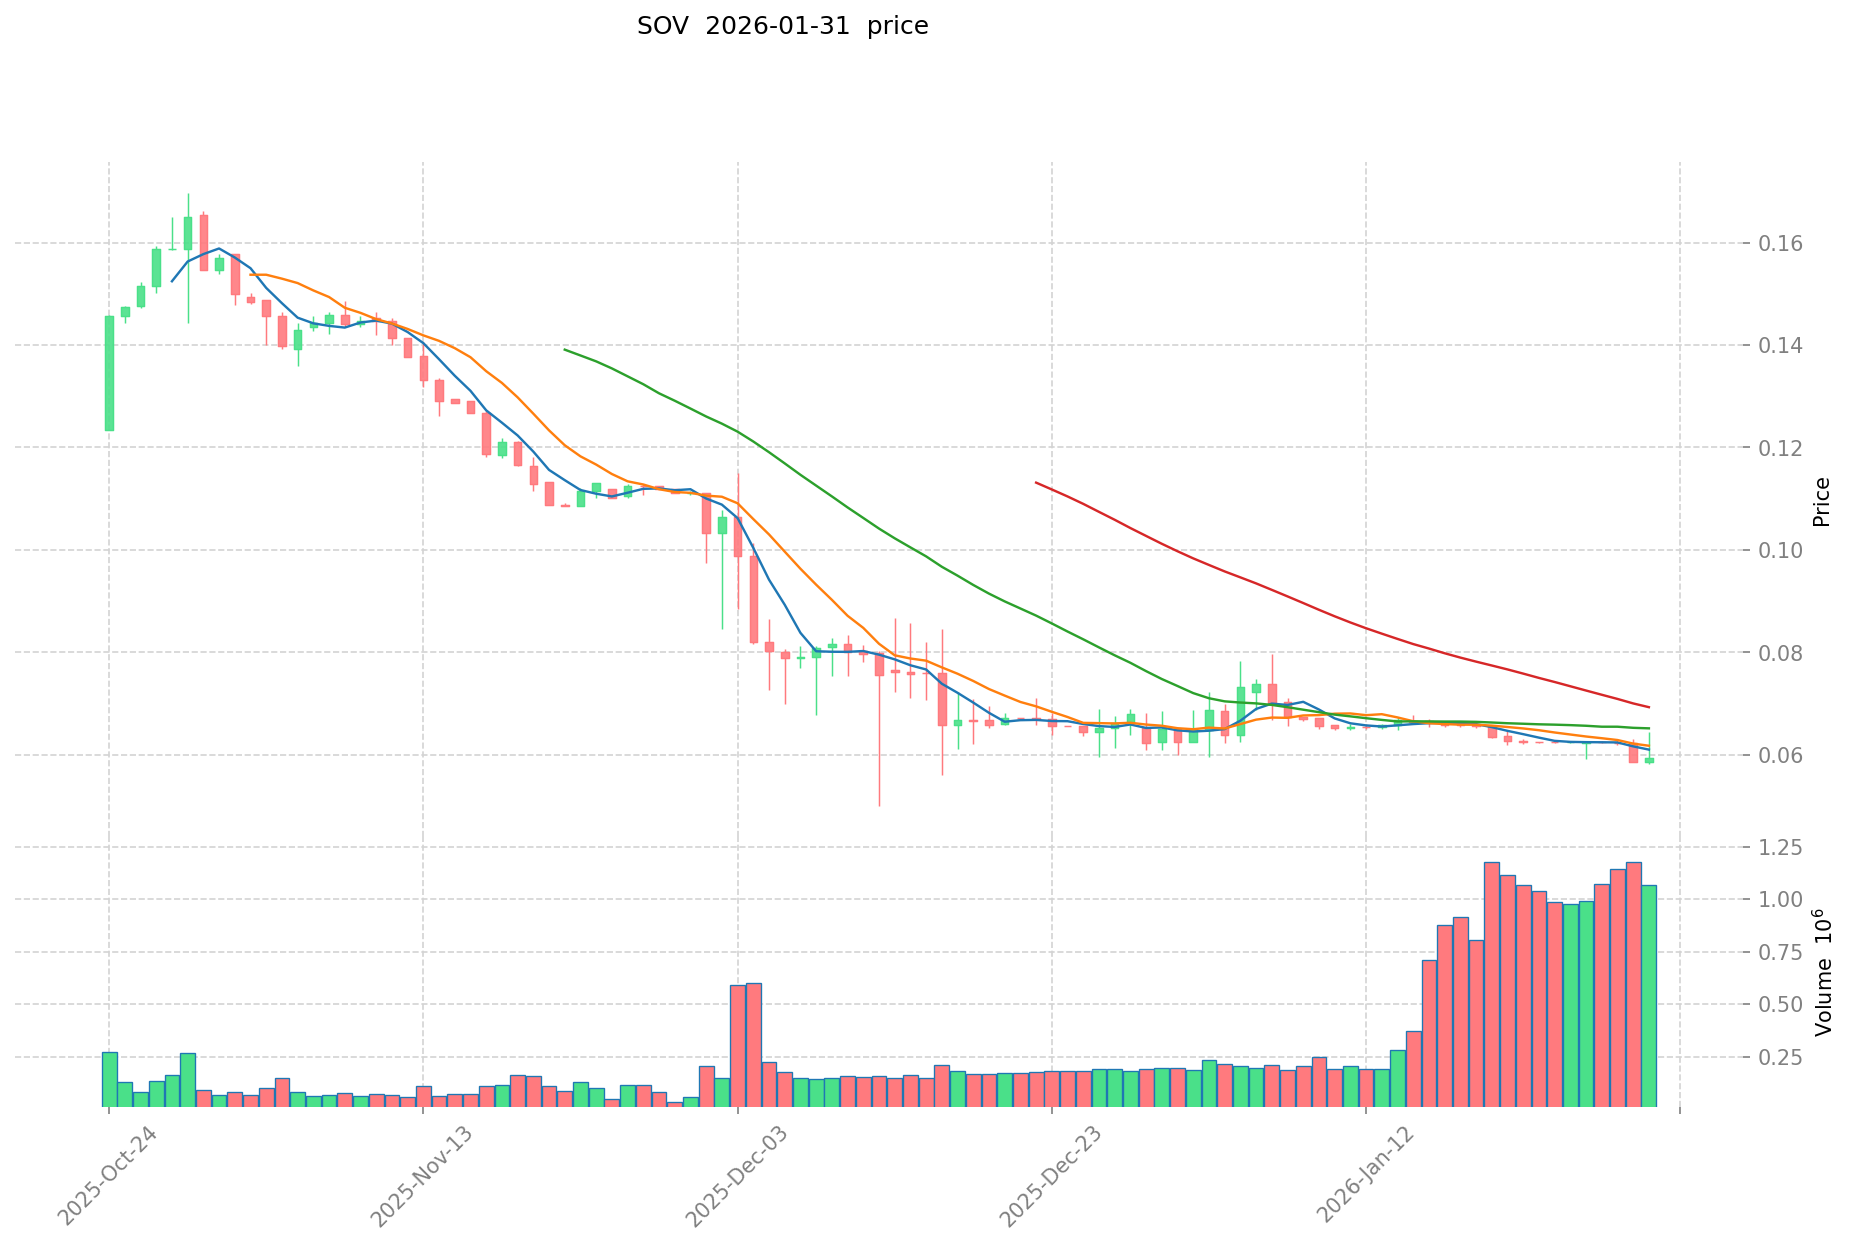
2025: SOV experienced a significant decline, recording a historical low of $0.01002593 on December 19, 2025. HBAR also faced downward pressure, with its all-time low of $0.00986111 occurring on January 3, 2020, although it has since recovered from that level.
-
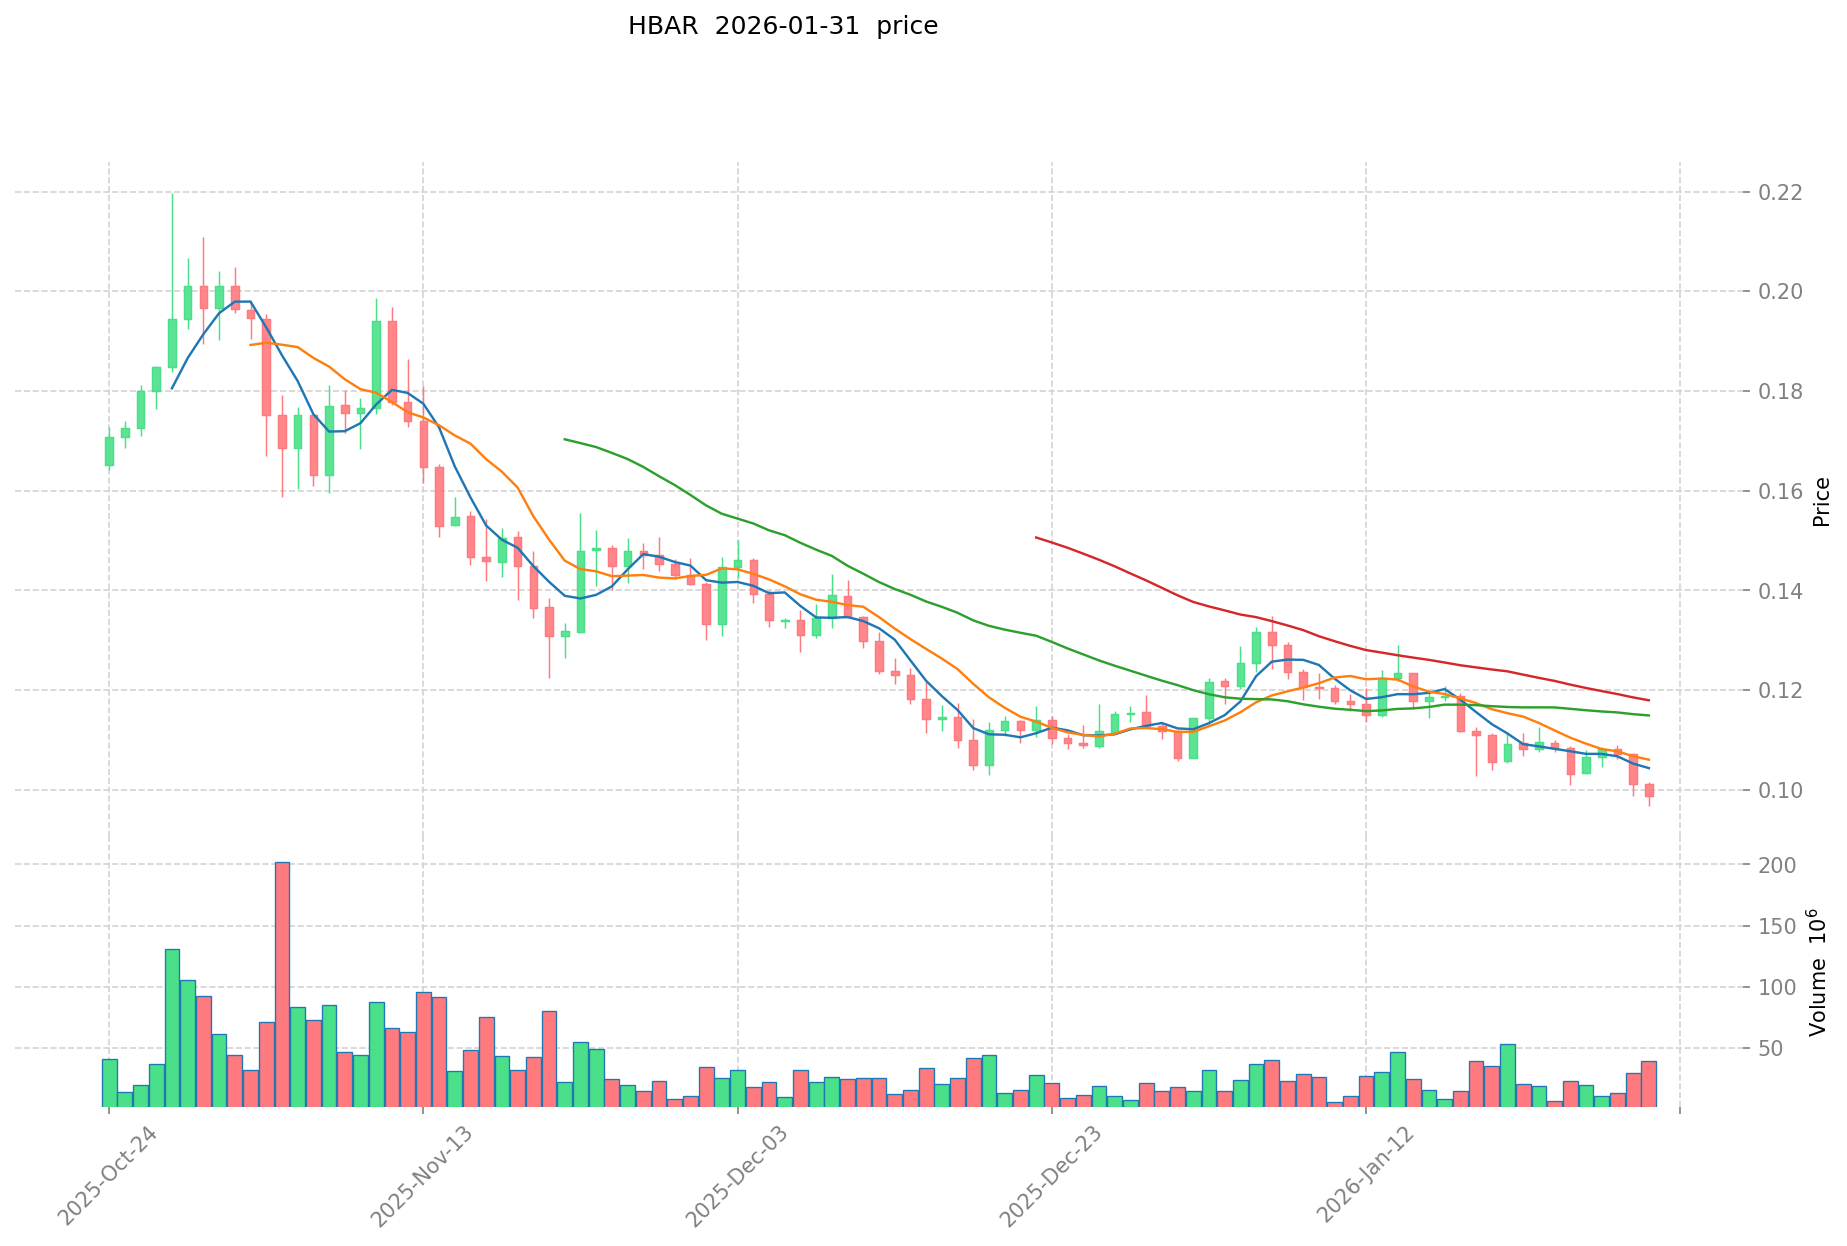
Comparative Analysis: During the most recent market cycle, SOV declined from its all-time high of $43.98 to its current price of $0.05937, representing a substantial contraction. In contrast, HBAR decreased from $0.569229 to $0.09862, showing a relatively more moderate decline compared to SOV in percentage terms.
Current Market Status (January 31, 2026)
- SOV Current Price: $0.05937
- HBAR Current Price: $0.09862
- 24-Hour Trading Volume: SOV recorded $64,056.31, while HBAR posted $3,925,460.32, indicating significantly higher liquidity for HBAR.
- Market Capitalization: SOV's circulating market cap stands at approximately $2.92 million, whereas HBAR's circulating market cap is around $4.24 billion.
- Market Sentiment Index (Fear & Greed Index): 16 (Extreme Fear)
View real-time prices:
II. Core Factors Influencing SOV vs HBAR Investment Value
Tokenomics Comparison
- SOV: The reference materials do not provide specific information about SOV's supply mechanism or tokenomics model.
- HBAR: HBAR is positioned as focusing on high-speed transactions within its ecosystem. The materials note HBAR as an alternative in the Distributed Ledger Technology (DLT) space, emphasizing performance over traditional blockchain structures.
- 📌 Historical Pattern: Supply mechanisms can influence price cycles through scarcity dynamics and emission schedules, though specific historical data for these tokens was not provided in the reference materials.
Institutional Adoption and Market Applications
- Institutional Holdings: The reference materials do not contain specific data comparing institutional holdings between SOV and HBAR.
- Enterprise Adoption: HBAR has been mentioned in the context of high-speed transaction capabilities, suggesting potential applications in scenarios requiring rapid settlement. SOV is referenced in relation to decentralized finance applications, indicating a focus on DeFi use cases.
- Regulatory Environment: The materials do not provide detailed information on specific national policies toward either SOV or HBAR.
Technology Development and Ecosystem Building
- SOV Technology: SOV emphasizes decentralized finance applications, suggesting integration within DeFi protocols and related infrastructure.
- HBAR Technology: HBAR focuses on high-speed transaction capabilities, which may support applications requiring rapid throughput and finality.
- Ecosystem Comparison: Both tokens have growing ecosystems and community support according to the reference materials. HBAR's positioning suggests potential in payment and settlement applications, while SOV's DeFi focus indicates integration with lending, trading, and financial protocol platforms.
Macroeconomic Environment and Market Cycles
- Performance Under Inflation: The reference materials do not provide specific analysis of how SOV or HBAR perform under inflationary conditions.
- Macroeconomic Policy Impact: The materials do not contain detailed information on how interest rates, dollar index movements, or monetary policy specifically affect SOV or HBAR.
- Geopolitical Factors: While cross-border transaction demand and international developments can influence cryptocurrency adoption broadly, the reference materials do not provide specific information on how geopolitical factors distinctly impact SOV versus HBAR.
III. 2026-2031 Price Prediction: SOV vs HBAR
Short-term Forecast (2026)
- SOV: Conservative $0.050 - $0.059 | Optimistic $0.065 - $0.077
- HBAR: Conservative $0.065 - $0.099 | Optimistic $0.099 - $0.107
Mid-term Forecast (2028-2029)
- SOV may enter a consolidation phase, with estimated price range of $0.058 - $0.101
- HBAR may enter a growth phase, with estimated price range of $0.071 - $0.185
- Key drivers: institutional capital inflows, ETF developments, ecosystem expansion
Long-term Forecast (2030-2031)
- SOV: Baseline scenario $0.068 - $0.131 | Optimistic scenario $0.067 - $0.119
- HBAR: Baseline scenario $0.110 - $0.211 | Optimistic scenario $0.151 - $0.245
View detailed price predictions for SOV and HBAR
Disclaimer
SOV:
| Year |
Predicted High Price |
Predicted Average Price |
Predicted Low Price |
Price Change |
| 2026 |
0.077025 |
0.05925 |
0.0503625 |
0 |
| 2027 |
0.091985625 |
0.0681375 |
0.037475625 |
14 |
| 2028 |
0.10087756875 |
0.0800615625 |
0.058444940625 |
34 |
| 2029 |
0.1013259135 |
0.090469565625 |
0.08413669603125 |
52 |
| 2030 |
0.131379903200625 |
0.0958977395625 |
0.068087395089375 |
61 |
| 2031 |
0.11932076245064 |
0.113638821381562 |
0.067046904615121 |
91 |
HBAR:
| Year |
Predicted High Price |
Predicted Average Price |
Predicted Low Price |
Price Change |
| 2026 |
0.1074086 |
0.09854 |
0.0650364 |
0 |
| 2027 |
0.146223506 |
0.1029743 |
0.077230725 |
4 |
| 2028 |
0.13207483718 |
0.124598903 |
0.0996791224 |
26 |
| 2029 |
0.1848050929296 |
0.12833687009 |
0.0705852785495 |
30 |
| 2030 |
0.21137082503823 |
0.1565709815098 |
0.10959968705686 |
58 |
| 2031 |
0.244681301354439 |
0.183970903274015 |
0.150856140684692 |
86 |
IV. Investment Strategy Comparison: SOV vs HBAR
Long-term vs Short-term Investment Strategies
-
SOV: May suit investors focused on decentralized finance applications and emerging DeFi protocol development. The token's positioning in non-custodial Bitcoin lending and margin trading systems suggests alignment with users seeking exposure to Bitcoin-related DeFi infrastructure.
-
HBAR: May suit investors interested in high-throughput distributed ledger technology and enterprise-grade transaction systems. The focus on hashgraph consensus mechanisms and rapid settlement capabilities indicates potential appeal for those tracking institutional blockchain adoption.
Risk Management and Asset Allocation
-
Conservative Investors: SOV 20-30% vs HBAR 70-80%. Given HBAR's higher market capitalization ($4.24 billion vs $2.92 million) and substantially greater liquidity ($3.93 million vs $64,056 in 24-hour volume), conservative portfolios may allocate more weight to HBAR for reduced volatility exposure.
-
Aggressive Investors: SOV 40-50% vs HBAR 50-60%. Investors with higher risk tolerance may increase SOV allocation to capture potential upside from smaller market cap positioning, while maintaining HBAR exposure for ecosystem diversification.
-
Hedging Tools: Stablecoin allocation (15-25% of crypto portfolio), options strategies for downside protection, cross-asset correlation analysis between DeFi tokens and enterprise blockchain platforms.
V. Potential Risk Comparison
Market Risks
-
SOV: Lower liquidity levels ($64,056 daily volume) may amplify price volatility during market stress periods. The significant decline from $43.98 to current levels reflects sensitivity to DeFi sector sentiment shifts and broader crypto market cycles.
-
HBAR: While demonstrating higher liquidity, HBAR experienced notable drawdowns from its 2021 peak of $0.569229 to current price of $0.09862. Market adoption pace for enterprise distributed ledger solutions may influence price trajectory.
Technical Risks
-
SOV: Network scalability considerations related to Bitcoin-based DeFi infrastructure. Dependencies on underlying protocol development and cross-chain integration stability.
-
HBAR: Hashgraph consensus mechanism represents alternative approach to traditional blockchain architecture. Network performance under sustained high-volume conditions and ecosystem developer adoption rates present ongoing technical considerations.
Regulatory Risks
- Global regulatory frameworks continue evolving for both DeFi protocols and enterprise blockchain solutions. SOV's decentralized finance positioning may face scrutiny related to lending protocol regulations. HBAR's enterprise focus may encounter compliance requirements for institutional deployment scenarios. Jurisdictional differences in cryptocurrency classification and reporting standards could affect both assets differently based on their respective use cases.
VI. Conclusion: Which Is the Better Buy?
📌 Investment Value Summary:
-
SOV Characteristics: Positioned in decentralized finance infrastructure with focus on Bitcoin lending and margin trading systems. Smaller market capitalization ($2.92 million) offers higher risk-reward profile. Current extreme fear sentiment (Fear & Greed Index: 16) may present entry opportunities for risk-tolerant investors.
-
HBAR Characteristics: Established distributed ledger technology platform with hashgraph consensus mechanism. Substantially higher market capitalization ($4.24 billion) and daily liquidity ($3.93 million) provide more stable trading environment. Enterprise-focused positioning suggests different adoption pathway compared to consumer DeFi applications.
✅ Investment Considerations:
-
New Investors: May consider beginning with HBAR allocation given higher liquidity and established market presence. Gradual portfolio construction with stablecoin reserves (20-30%) for risk management. Educational focus on understanding both DeFi protocols and enterprise blockchain fundamentals before allocation decisions.
-
Experienced Investors: Portfolio diversification across both assets based on individual risk tolerance and sector exposure preferences. Technical analysis of historical price patterns and volume trends. Monitoring ecosystem development milestones and adoption metrics for both platforms.
-
Institutional Participants: Evaluation of custody solutions, liquidity depth, and regulatory compliance frameworks for each asset class. Consideration of allocation weights based on portfolio mandates and risk parameters. Due diligence on technology infrastructure, governance models, and long-term sustainability factors.
⚠️ Risk Disclosure: Cryptocurrency markets exhibit substantial volatility. Historical performance does not indicate future results. This analysis does not constitute investment advice. Investors should conduct independent research and consult qualified financial advisors before making investment decisions.
VII. FAQ
Q1: What is the primary difference between SOV and HBAR in terms of their technological focus?
SOV focuses on decentralized finance (DeFi) infrastructure, specifically non-custodial Bitcoin lending and margin trading systems, while HBAR emphasizes high-throughput distributed ledger technology using hashgraph consensus mechanisms. SOV operates within the DeFi ecosystem, targeting users seeking exposure to Bitcoin-related financial protocols, whereas HBAR targets enterprise-grade applications requiring rapid transaction settlement and high scalability through its alternative consensus approach to traditional blockchain architecture.
Q2: Which asset demonstrates higher market liquidity and stability?
HBAR demonstrates significantly higher market liquidity and stability compared to SOV. As of January 31, 2026, HBAR records a 24-hour trading volume of $3,925,460.32 and maintains a market capitalization of approximately $4.24 billion, while SOV shows only $64,056.31 in daily volume with a market cap of $2.92 million. This substantial difference in liquidity means HBAR experiences less price slippage during trades and generally exhibits lower volatility, making it more suitable for conservative investors and institutional participants requiring stable entry and exit points.
Q3: What are the historical price performance patterns for SOV and HBAR?
Both assets experienced significant corrections from their all-time highs. SOV peaked at $43.98 on October 7, 2021, and declined to a historical low of $0.01002593 on December 19, 2025, currently trading at $0.05937. HBAR reached its all-time high of $0.569229 on September 15, 2021, with its historical low of $0.00986111 occurring on January 3, 2020, currently priced at $0.09862. In percentage terms, HBAR has shown a more moderate decline from its peak compared to SOV, suggesting relatively better price resilience during market downturns.
Q4: What investment allocation strategy is recommended for different risk profiles?
Conservative investors should consider allocating 20-30% to SOV and 70-80% to HBAR, given HBAR's higher market capitalization and substantially greater liquidity, which reduces volatility exposure. Aggressive investors with higher risk tolerance may increase SOV allocation to 40-50% while maintaining 50-60% in HBAR to capture potential upside from SOV's smaller market cap positioning. Both strategies should incorporate hedging tools such as stablecoin allocation (15-25% of crypto portfolio) and options strategies for downside protection, along with regular portfolio rebalancing based on market conditions.
Q5: What are the long-term price forecasts for SOV and HBAR through 2031?
For SOV, short-term 2026 forecasts range from $0.050-$0.059 (conservative) to $0.065-$0.077 (optimistic), with long-term 2030-2031 baseline scenarios projecting $0.068-$0.131 and optimistic scenarios at $0.067-$0.119. HBAR's short-term 2026 projections range from $0.065-$0.099 (conservative) to $0.099-$0.107 (optimistic), with long-term 2030-2031 baseline scenarios at $0.110-$0.211 and optimistic scenarios reaching $0.151-$0.245. These forecasts suggest HBAR may demonstrate stronger growth potential over the extended timeframe, though both projections depend on factors including institutional capital inflows, ecosystem expansion, and broader market adoption.
Q6: What are the main regulatory risks affecting SOV and HBAR?
Both assets face evolving global regulatory frameworks, but with different risk profiles based on their use cases. SOV's decentralized finance positioning may encounter scrutiny related to lending protocol regulations, as governments worldwide develop frameworks for DeFi activities including Know Your Customer (KYC) requirements and securities classification. HBAR's enterprise focus may face compliance requirements for institutional deployment scenarios, including data privacy regulations and cross-border transaction monitoring. Jurisdictional differences in cryptocurrency classification, reporting standards, and taxation policies could affect both assets differently, with SOV potentially facing more regulatory uncertainty due to the less-defined status of DeFi protocols compared to enterprise blockchain solutions.
Q7: How do the current market conditions (Extreme Fear sentiment) impact investment decisions for SOV vs HBAR?
The current Fear & Greed Index of 16 (Extreme Fear) as of January 31, 2026, suggests market participants are highly risk-averse, which historically has presented contrarian buying opportunities. However, this sentiment affects SOV and HBAR differently due to their distinct risk profiles. For SOV, extreme fear combined with low liquidity ($64,056 daily volume) may create higher entry barriers and increased volatility risk, requiring more careful position sizing. For HBAR, the higher liquidity ($3.93 million daily volume) and established market presence may allow for more systematic accumulation strategies during fearful periods. New investors should prioritize capital preservation during extreme fear phases, while experienced investors may implement dollar-cost averaging strategies weighted toward the more liquid asset (HBAR) until sentiment stabilizes.
Q8: What ecosystem developments should investors monitor for SOV and HBAR?
For SOV, investors should track developments in Bitcoin DeFi infrastructure, including protocol integrations, lending pool growth, margin trading volume metrics, and cross-chain bridge security updates. Key indicators include total value locked (TVL) in Sovryn protocols, partnership announcements with other DeFi platforms, and upgrades to non-custodial trading systems. For HBAR, monitoring focuses on enterprise adoption milestones, including new institutional partnerships, transaction throughput metrics, governance council expansions, and developer activity on the Hedera network. Both ecosystems' growth can be evaluated through metrics such as active addresses, transaction counts, developer community size, and grant program funding allocations, which provide early signals of ecosystem health and potential price catalysts.
* The information is not intended to be and does not constitute financial advice or any other recommendation of any sort offered or endorsed by Gate.