This comprehensive comparison examines SQD versus ENJ, two distinct blockchain tokens operating in infrastructure and gaming sectors respectively. SQD, launched in May 2024, powers a data indexing protocol for decentralized applications, while ENJ represents an established gaming ecosystem with 18.7 million registered players since 2017. The article analyzes historical price performance, current market status, tokenomics structures, and ecosystem development trajectories to provide investors with objective valuation frameworks. Current pricing shows SQD at $0.06982 with trading volume of $180,613.89, compared to ENJ at $0.02902 with $68,705.39 volume on Gate exchange. The analysis covers investment strategies for conservative and aggressive profiles, risk management approaches, and detailed price projections through 2031. Key considerations include SQD's infrastructure scalability potential versus ENJ's proven gaming integration and user adoption, alongside regulatory risks affecting both digital assets. The
Introduction: Investment Comparison Between SQD and ENJ
In the cryptocurrency market, the comparison between SQD vs ENJ has become a topic of interest for investors seeking diversified exposure to blockchain infrastructure and gaming sectors. These two tokens exhibit distinct differences in market capitalization rankings, application scenarios, and price performance, representing different positioning within the crypto asset landscape.
Subsquid (SQD): Launched in May 2024, this token powers a hyper-scalable data access layer designed to provide indexing protocol services for blockchain applications. As an infrastructure-focused project, it aims to deliver the information needed for enhanced user experiences in decentralized applications.
Enjin Coin (ENJ): Operating since 2009 as a gaming community platform and launching its token in November 2017, ENJ has established itself in the blockchain gaming and NFT space. With over 18.7 million registered players and extensive adoption across gaming communities, it represents a more mature ecosystem in the virtual goods and gaming sector.
This article will comprehensively analyze the investment value comparison between SQD vs ENJ through the lens of historical price trends, supply mechanisms, technical ecosystems, and future outlook, attempting to address investors' most pressing question:
"Which token presents more compelling fundamentals for portfolio consideration?"
By examining market performance data, tokenomics structure, and ecosystem development trajectories, we aim to provide an objective framework for understanding these two distinct crypto assets without offering specific investment recommendations.
I. Historical Price Comparison and Current Market Status
Price History of SQD (Coin A) and ENJ (Coin B)
- 2024: SQD reached its all-time high of $0.5 on May 17, 2024, following its initial market launch in May 2024 with a starting price of $0.176.
- 2024: SQD experienced a significant decline, reaching its all-time low of $0.02288 on November 16, 2024.
- 2021: ENJ achieved its all-time high of $4.82 on November 25, 2021, during a period of strong momentum in the gaming and NFT sectors.
- 2017: ENJ recorded its all-time low of $0.01865964 on November 12, 2017, shortly after its initial launch in November 2017.
- Comparative Analysis: During the 2024 market cycle, SQD declined from its high of $0.5 to a low of $0.02288, representing a substantial correction. In contrast, ENJ has experienced a longer-term decline from its 2021 peak of $4.82 to current levels, reflecting broader market adjustments over multiple years.
Current Market Situation (January 26, 2026)
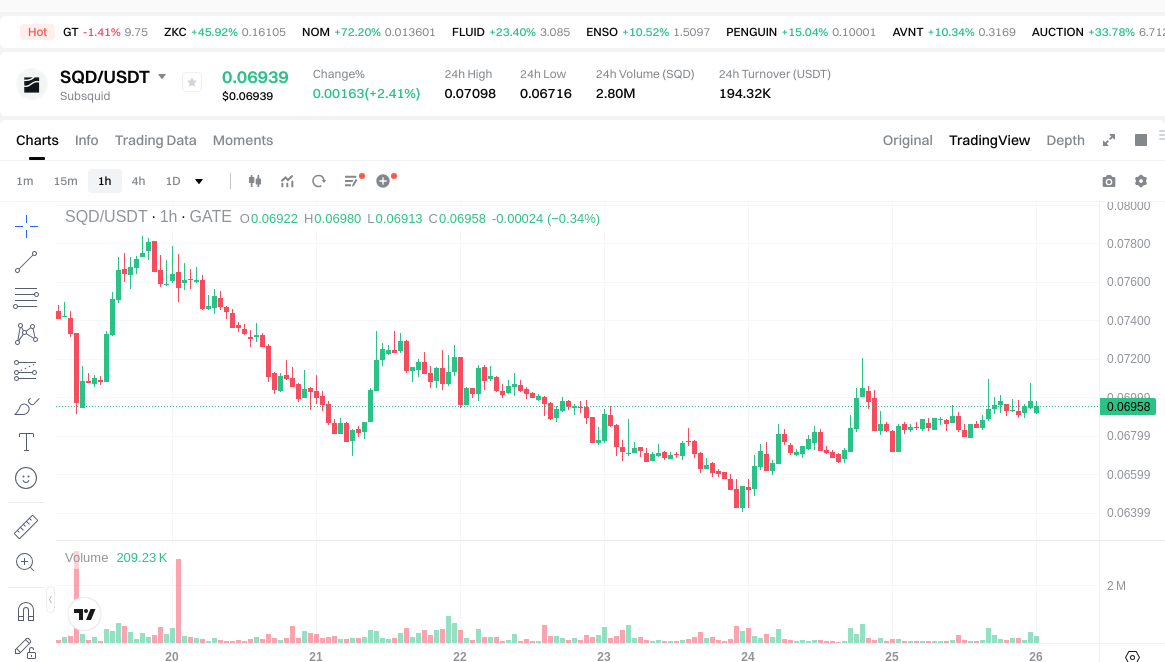
- SQD current price: $0.06982
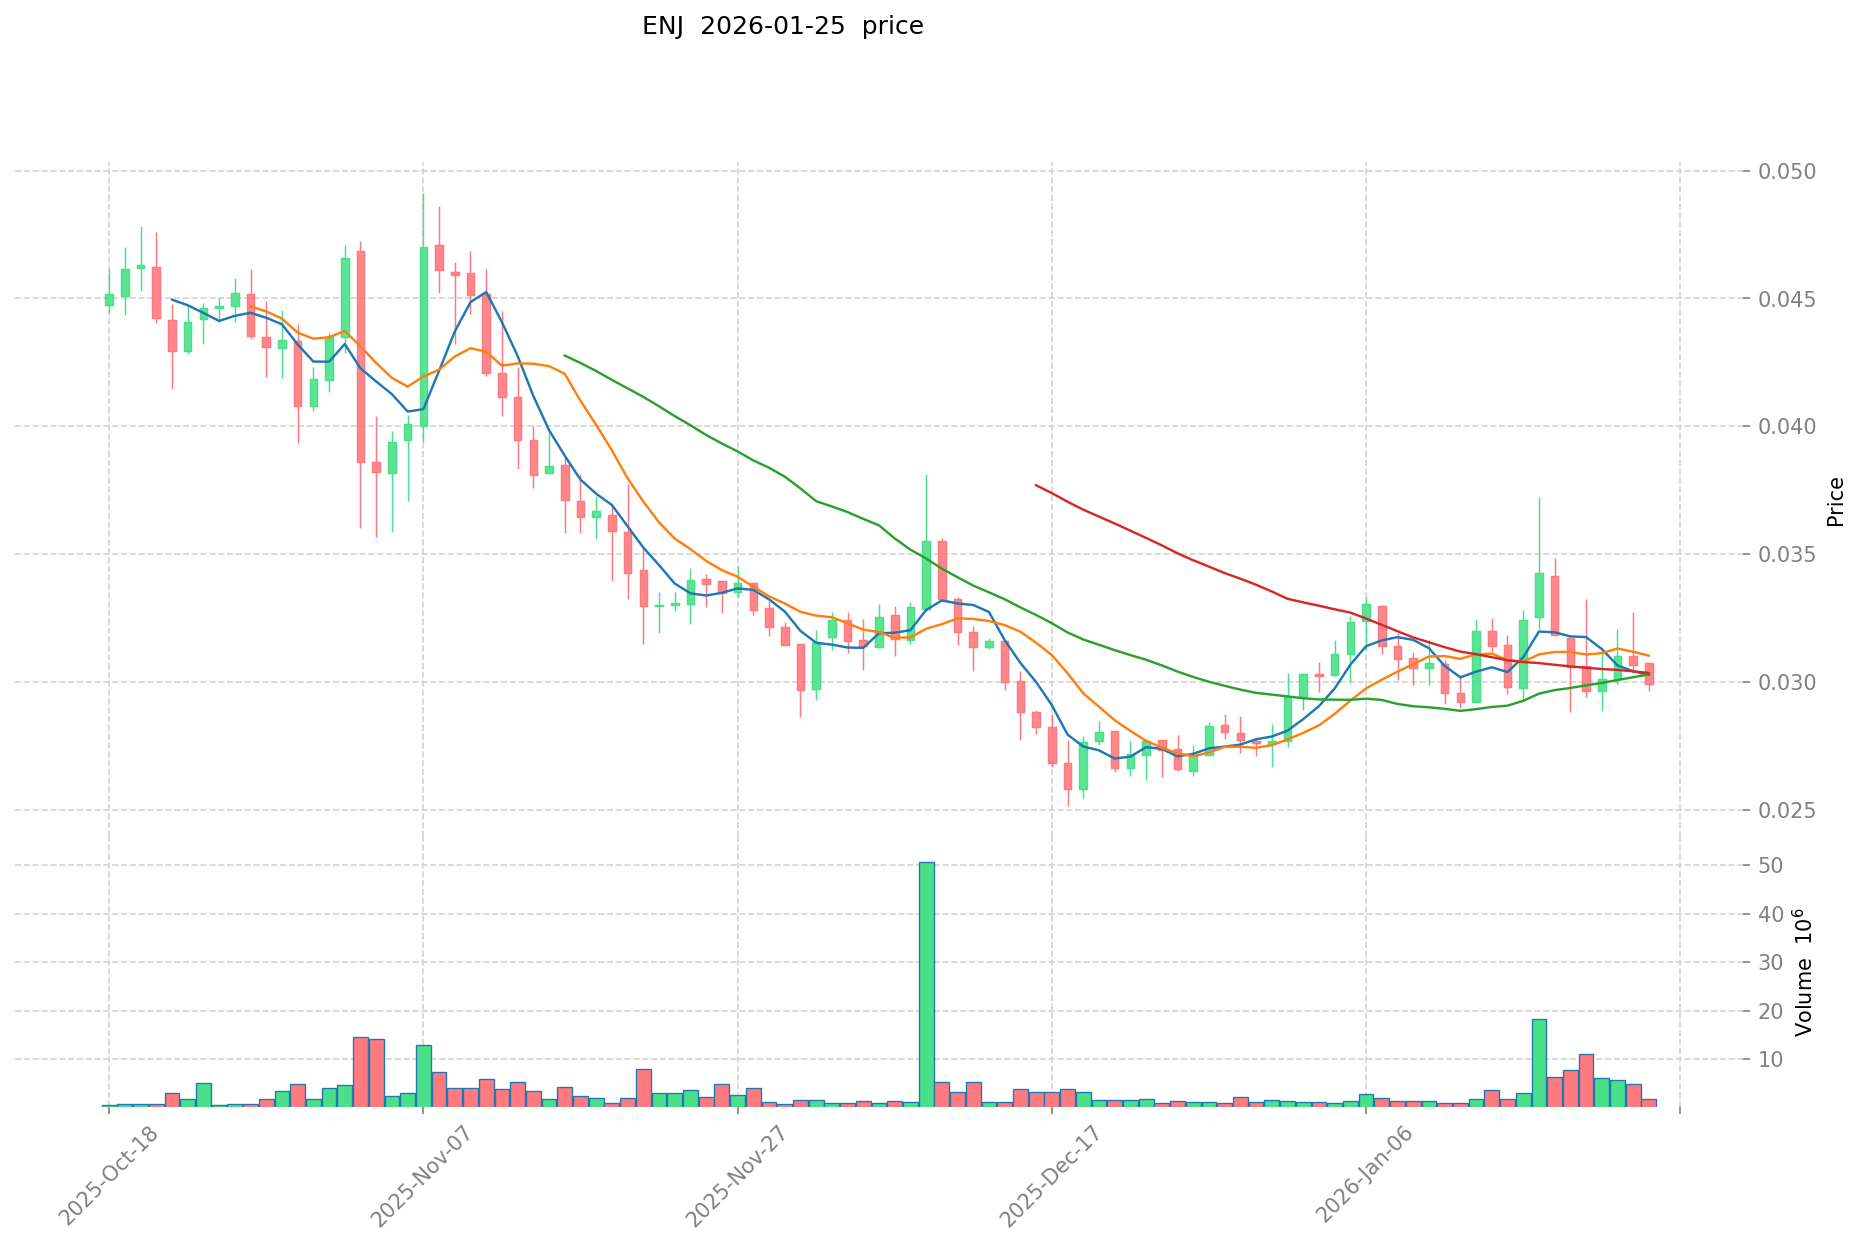
- ENJ current price: $0.02902
- 24-hour trading volume: SQD $180,613.89 vs ENJ $68,705.39
- Market Sentiment Index (Fear & Greed Index): 25 (Extreme Fear)
View real-time prices:
II. Core Factors Affecting SQD vs ENJ Investment Value
Supply Mechanism Comparison (Tokenomics)
Due to insufficient reference materials, specific supply mechanism details for SQD and ENJ cannot be provided at this time.
Institutional Adoption and Market Application
Institutional Holdings: Current data does not provide clear information regarding institutional preference between SQD and ENJ.
Enterprise Adoption: Information about SQD and ENJ's applications in cross-border payments, settlements, and investment portfolios is not available in the provided materials.
National Policies: Regulatory attitudes from different countries toward these two assets are not covered in the reference materials.
Technology Development and Ecosystem Building
SQD Technology Upgrades: Specific technical upgrade information and potential impacts are not available in the provided materials.
ENJ Technology Development: Detailed technology development content and potential impacts are not available in the provided materials.
Ecosystem Comparison: Information regarding DeFi, NFT, payment systems, and smart contract implementations for both projects is not included in the reference materials.
Macroeconomic Factors and Market Cycles
Performance in Inflationary Environment: The reference materials do not contain sufficient data to analyze which asset demonstrates stronger anti-inflation properties.
Macroeconomic Monetary Policy: The impact of interest rates and the US Dollar Index on both assets is not covered in the provided materials.
Geopolitical Factors: Information about cross-border transaction demand and international situations affecting these assets is not available in the reference materials.
III. 2026-2031 Price Prediction: SQD vs ENJ
Short-term Prediction (2026)
- SQD: Conservative $0.0598 - $0.0695 | Optimistic $0.0695 - $0.0827
- ENJ: Conservative $0.0165 - $0.0290 | Optimistic $0.0290 - $0.0429
Mid-term Prediction (2028-2029)
- SQD may enter a consolidation phase, with estimated price range of $0.0478 - $0.0977
- ENJ may enter a growth phase, with estimated price range of $0.0260 - $0.0551
- Key drivers: institutional capital inflows, ETF developments, ecosystem expansion
Long-term Prediction (2030-2031)
- SQD: Baseline scenario $0.0693 - $0.1053 | Optimistic scenario $0.1138 - $0.1183
- ENJ: Baseline scenario $0.0358 - $0.0601 | Optimistic scenario $0.0697 - $0.0745
View detailed price predictions for SQD and ENJ
Disclaimer
SQD:
| Year |
Predicted High Price |
Predicted Average Price |
Predicted Low Price |
Price Change |
| 2026 |
0.0827288 |
0.06952 |
0.0597872 |
0 |
| 2027 |
0.086781816 |
0.0761244 |
0.050242104 |
9 |
| 2028 |
0.09285654312 |
0.081453108 |
0.07167873504 |
16 |
| 2029 |
0.0976134046272 |
0.08715482556 |
0.047935154058 |
24 |
| 2030 |
0.118251667319808 |
0.0923841150936 |
0.0692880863202 |
32 |
| 2031 |
0.11374332250324 |
0.105317891206704 |
0.096892459910167 |
50 |
ENJ:
| Year |
Predicted High Price |
Predicted Average Price |
Predicted Low Price |
Price Change |
| 2026 |
0.0428608 |
0.02896 |
0.0165072 |
0 |
| 2027 |
0.040578752 |
0.0359104 |
0.020468928 |
23 |
| 2028 |
0.0535424064 |
0.038244576 |
0.02600631168 |
31 |
| 2029 |
0.05507218944 |
0.0458934912 |
0.026159289984 |
58 |
| 2030 |
0.0696663196416 |
0.05048284032 |
0.0358428166272 |
73 |
| 2031 |
0.074492479176192 |
0.0600745799808 |
0.05106339298368 |
107 |
IV. Investment Strategy Comparison: SQD vs ENJ
Long-term vs Short-term Investment Strategies
-
SQD: May appeal to investors focused on blockchain infrastructure development and data indexing protocols, particularly those with higher risk tolerance for emerging projects launched in 2024. The token's infrastructure-oriented positioning suggests potential alignment with long-term blockchain adoption trends.
-
ENJ: May suit investors seeking exposure to established gaming and NFT ecosystems with a longer operational history since 2017. The project's maturity and existing user base of over 18.7 million registered players could attract those preferring more established market positions.
Risk Management and Asset Allocation
-
Conservative Investors: Consider a balanced approach with SQD 30-40% vs ENJ 60-70%, favoring the more established project with longer market presence.
-
Aggressive Investors: May explore SQD 60-70% vs ENJ 30-40%, accepting higher volatility for potential infrastructure growth opportunities.
-
Hedging Tools: Stablecoin allocations for capital preservation, options strategies for downside protection, cross-asset portfolio diversification across different blockchain sectors.
V. Potential Risk Comparison
Market Risk
-
SQD: As a project launched in May 2024, exposure to higher volatility is evident from the significant decline from $0.5 to $0.02288 within months. Limited price history creates uncertainty in pattern analysis. Current market sentiment at Extreme Fear (25) amplifies short-term volatility risks.
-
ENJ: Despite longer market presence since 2017, the token has experienced substantial correction from its 2021 peak of $4.82 to current levels near $0.02902, reflecting prolonged downward pressure. Gaming and NFT sector cyclicality presents ongoing valuation challenges.
Technical Risk
-
SQD: Infrastructure scalability and network adoption rates remain critical factors. As a newer protocol, technical maturity and stress-testing under high-volume conditions require further validation.
-
ENJ: Platform stability across gaming integrations and NFT minting operations presents operational considerations. Competition from emerging blockchain gaming solutions could affect market positioning.
Regulatory Risk
- Global regulatory frameworks continue evolving for both infrastructure tokens and gaming-related digital assets. Infrastructure protocols like SQD may face data governance and cross-border data flow regulations, while gaming tokens like ENJ could encounter scrutiny around virtual asset classifications and consumer protection standards across different jurisdictions.
VI. Conclusion: Which Is the Better Buy?
📌 Investment Value Summary:
-
SQD Advantages: Infrastructure positioning in blockchain data indexing, recent market entry potentially offering early adoption opportunities, focus on scalable data access solutions for decentralized applications.
-
ENJ Advantages: Established ecosystem with 18.7 million registered players, longer operational track record since 2017, proven use cases in gaming communities and NFT infrastructure.
✅ Investment Considerations:
-
Beginner Investors: Consider starting with smaller position sizes in either asset, prioritizing education about infrastructure protocols versus gaming ecosystems before significant capital allocation.
-
Experienced Investors: May evaluate portfolio diversification between infrastructure (SQD) and application-layer (ENJ) exposures based on sector rotation strategies and risk tolerance profiles.
-
Institutional Investors: Could assess both tokens within broader blockchain infrastructure and digital entertainment theses, considering liquidity requirements and regulatory compliance frameworks.
⚠️ Risk Warning: The cryptocurrency market exhibits extreme volatility. This article does not constitute investment advice. Both SQD and ENJ carry substantial risks including but not limited to market volatility, technological uncertainties, regulatory changes, and potential total loss of capital. Investors should conduct independent research and consult qualified financial advisors before making investment decisions.
VII. FAQ
Q1: What are the key differences between SQD and ENJ in terms of their core use cases?
SQD functions as a blockchain infrastructure protocol focused on data indexing and scalability for decentralized applications, while ENJ operates as a gaming ecosystem token supporting NFT minting and virtual asset management across gaming communities. SQD, launched in May 2024, provides the backend data access layer that blockchain applications need for enhanced user experiences, positioning itself within the infrastructure segment of the crypto market. In contrast, ENJ has been operational since 2017 with over 18.7 million registered players, establishing itself as an application-layer token specifically designed for the gaming and NFT sectors. This fundamental difference means SQD's value proposition centers on supporting blockchain development infrastructure, whereas ENJ's value derives from actual user engagement within gaming platforms and virtual goods marketplaces.
Q2: How do the price histories of SQD and ENJ reflect their different market positions?
SQD experienced rapid volatility within its first year, declining from $0.5 (May 2024 high) to $0.02288 (November 2024 low), while ENJ has undergone a multi-year correction from $4.82 (November 2021 peak) to current levels around $0.02902. SQD's compressed price history reflects typical early-stage token behavior with sharp initial movements as market participants discover appropriate valuation levels. ENJ's extended downward trajectory from its 2021 peak demonstrates the longer-term challenges facing gaming tokens following the NFT boom period. The current 24-hour trading volume data shows SQD at $180,613.89 compared to ENJ's $68,705.39, indicating relatively higher liquidity for the newer infrastructure token despite its recent launch.
Q3: What should investors consider when choosing between SQD and ENJ for portfolio allocation?
Investors should evaluate their risk tolerance, investment timeline, and sector preference between infrastructure versus application-layer blockchain exposure. SQD may suit those seeking early-stage infrastructure exposure with higher volatility tolerance, particularly investors who believe in the long-term growth of blockchain data indexing protocols. Conservative investors might prefer ENJ's established track record and existing user base of 18.7 million players, accepting the trade-off of lower potential upside for greater operational maturity. A balanced approach could involve allocating 30-40% to SQD and 60-70% to ENJ for risk-averse strategies, or reversing these proportions (60-70% SQD, 30-40% ENJ) for aggressive growth-oriented portfolios, while maintaining stablecoin reserves for capital preservation during market downturns.
Q4: What are the projected price ranges for SQD and ENJ through 2031?
SQD's price projections range from $0.0598-$0.0827 in 2026, potentially reaching $0.1138-$0.1183 under optimistic scenarios by 2031, while ENJ forecasts span $0.0165-$0.0429 for 2026 and $0.0697-$0.0745 in bullish 2031 scenarios. These projections suggest SQD maintains relatively higher absolute price levels throughout the forecast period, though percentage gains vary significantly based on market conditions. The mid-term outlook (2028-2029) anticipates SQD consolidation around $0.0478-$0.0977 while ENJ enters a potential growth phase at $0.0260-$0.0551, reflecting different maturation stages for infrastructure versus gaming sector tokens. However, investors should note these projections carry substantial uncertainty given the extreme volatility of cryptocurrency markets and the limited historical data available for SQD.
Q5: What are the primary risks associated with investing in SQD versus ENJ?
SQD faces infrastructure adoption risks including unproven scalability under high-volume conditions and dependency on blockchain ecosystem growth, while ENJ confronts gaming sector cyclicality and increasing competition from emerging blockchain gaming platforms. SQD's May 2024 launch means limited stress-testing history and higher uncertainty regarding long-term protocol viability, whereas ENJ's established presence brings visibility into operational challenges but also reflects sustained downward pressure from the 2021 peak. Both tokens operate within evolving regulatory environments—SQD potentially facing data governance regulations as an infrastructure protocol, and ENJ subject to virtual asset classification scrutiny and consumer protection standards in gaming jurisdictions. The current Fear & Greed Index reading of 25 (Extreme Fear) amplifies short-term volatility risks for both assets.
Q6: How do trading volumes and market sentiment currently compare between SQD and ENJ?
SQD demonstrates higher 24-hour trading volume at $180,613.89 compared to ENJ's $68,705.39, indicating greater immediate market liquidity despite being a significantly newer token launched in 2024. This volume differential suggests SQD may attract more active trading interest, potentially providing better execution capabilities for entering or exiting positions, though higher volumes can also reflect greater speculative activity rather than fundamental demand. Both tokens currently operate within an Extreme Fear market environment (index reading of 25), which historically correlates with heightened volatility and risk-averse investor behavior across cryptocurrency markets. The volume advantage for SQD may partly reflect initial market discovery dynamics as newer tokens often experience elevated trading activity during their first year of operation.
Q7: What factors should determine the investment timeline when comparing SQD and ENJ?
Short-term investors (2026 timeframe) should consider SQD's infrastructure positioning for potential rapid adoption scenarios versus ENJ's established gaming community foundation, while long-term holders (2030-2031) might evaluate SQD's projected range of $0.0693-$0.1183 against ENJ's $0.0358-$0.0745. The investment timeline significantly impacts risk-return considerations—SQD's recent launch creates greater uncertainty for near-term price discovery but potentially offers higher upside if blockchain infrastructure demand accelerates, whereas ENJ's longer operational history provides more predictable patterns but possibly limited multiple expansion from current depressed levels. Mid-term investors (2028-2029) should assess whether SQD's anticipated consolidation phase or ENJ's projected growth trajectory better aligns with their portfolio objectives and sector rotation strategies within the broader cryptocurrency market cycle.
Q8: Which token presents better characteristics for different investor profiles?
Beginner investors may find ENJ's longer track record and tangible gaming use cases more comprehensible than SQD's technical infrastructure focus, though smaller initial positions in either asset remain prudent for those new to cryptocurrency volatility. Experienced investors might appreciate SQD's infrastructure exposure for portfolio diversification beyond application-layer tokens, potentially allocating based on conviction about blockchain data indexing growth versus gaming sector recovery. Institutional investors could evaluate SQD within blockchain infrastructure theses requiring deeper liquidity analysis, while ENJ fits digital entertainment strategies with clearer user metrics through its 18.7 million registered player base. Risk-averse profiles generally favor ENJ's established operations despite sustained price weakness, whereas risk-tolerant investors accepting potential total loss might pursue SQD's early-stage infrastructure opportunity with appropriate position sizing and hedging strategies.
* The information is not intended to be and does not constitute financial advice or any other recommendation of any sort offered or endorsed by Gate.