This article provides a detailed comparative analysis of SQD and SAND tokens, highlighting their unique market positions, historical price performances, and investment potential. It addresses the needs of investors looking for diversified cryptocurrency exposure, with insights into tokenomics, project maturity, and risk assessment. Structured logically, the article covers historical data, functionality, metrics, risk, and investment strategy. Key topics include market sentiment, liquidity, and long-term growth prospects, offering essential guidance for both conservative and aggressive cryptocurrency investors.
Introduction: SQD vs SAND Investment Comparison
In the cryptocurrency market, the comparison between Subsquid (SQD) and Sandbox (SAND) reflects two distinct approaches within the digital asset ecosystem. Both tokens operate across different market capitalizations, use cases, and price trajectories, making them interesting subjects for comparative analysis.
Subsquid (SQD): Launched in 2024, it positions itself as a hyper-scalable data access layer and indexing protocol designed to power decentralized applications by providing the information blockchain applications need to deliver optimal user experiences.
Sandbox (SAND): Since its debut in 2020, it has established itself as the native utility token of a virtual game world where players can create, own, and monetize digital experiences and non-fungible token (NFT) assets through blockchain-based functionality.
This article will comprehensively examine the investment dynamics of SQD vs SAND across key dimensions including historical price performance, token supply mechanisms, market positioning, ecosystem development, and forward-looking perspectives. By analyzing these factors, we aim to provide investors with an informed framework for evaluating both assets:
"Which represents a more compelling investment opportunity at this stage?"
Comparative Market Analysis: Subsquid (SQD) and The Sandbox (SAND)
I. Historical Price Comparison and Current Market Status
Historical Highs and Lows:
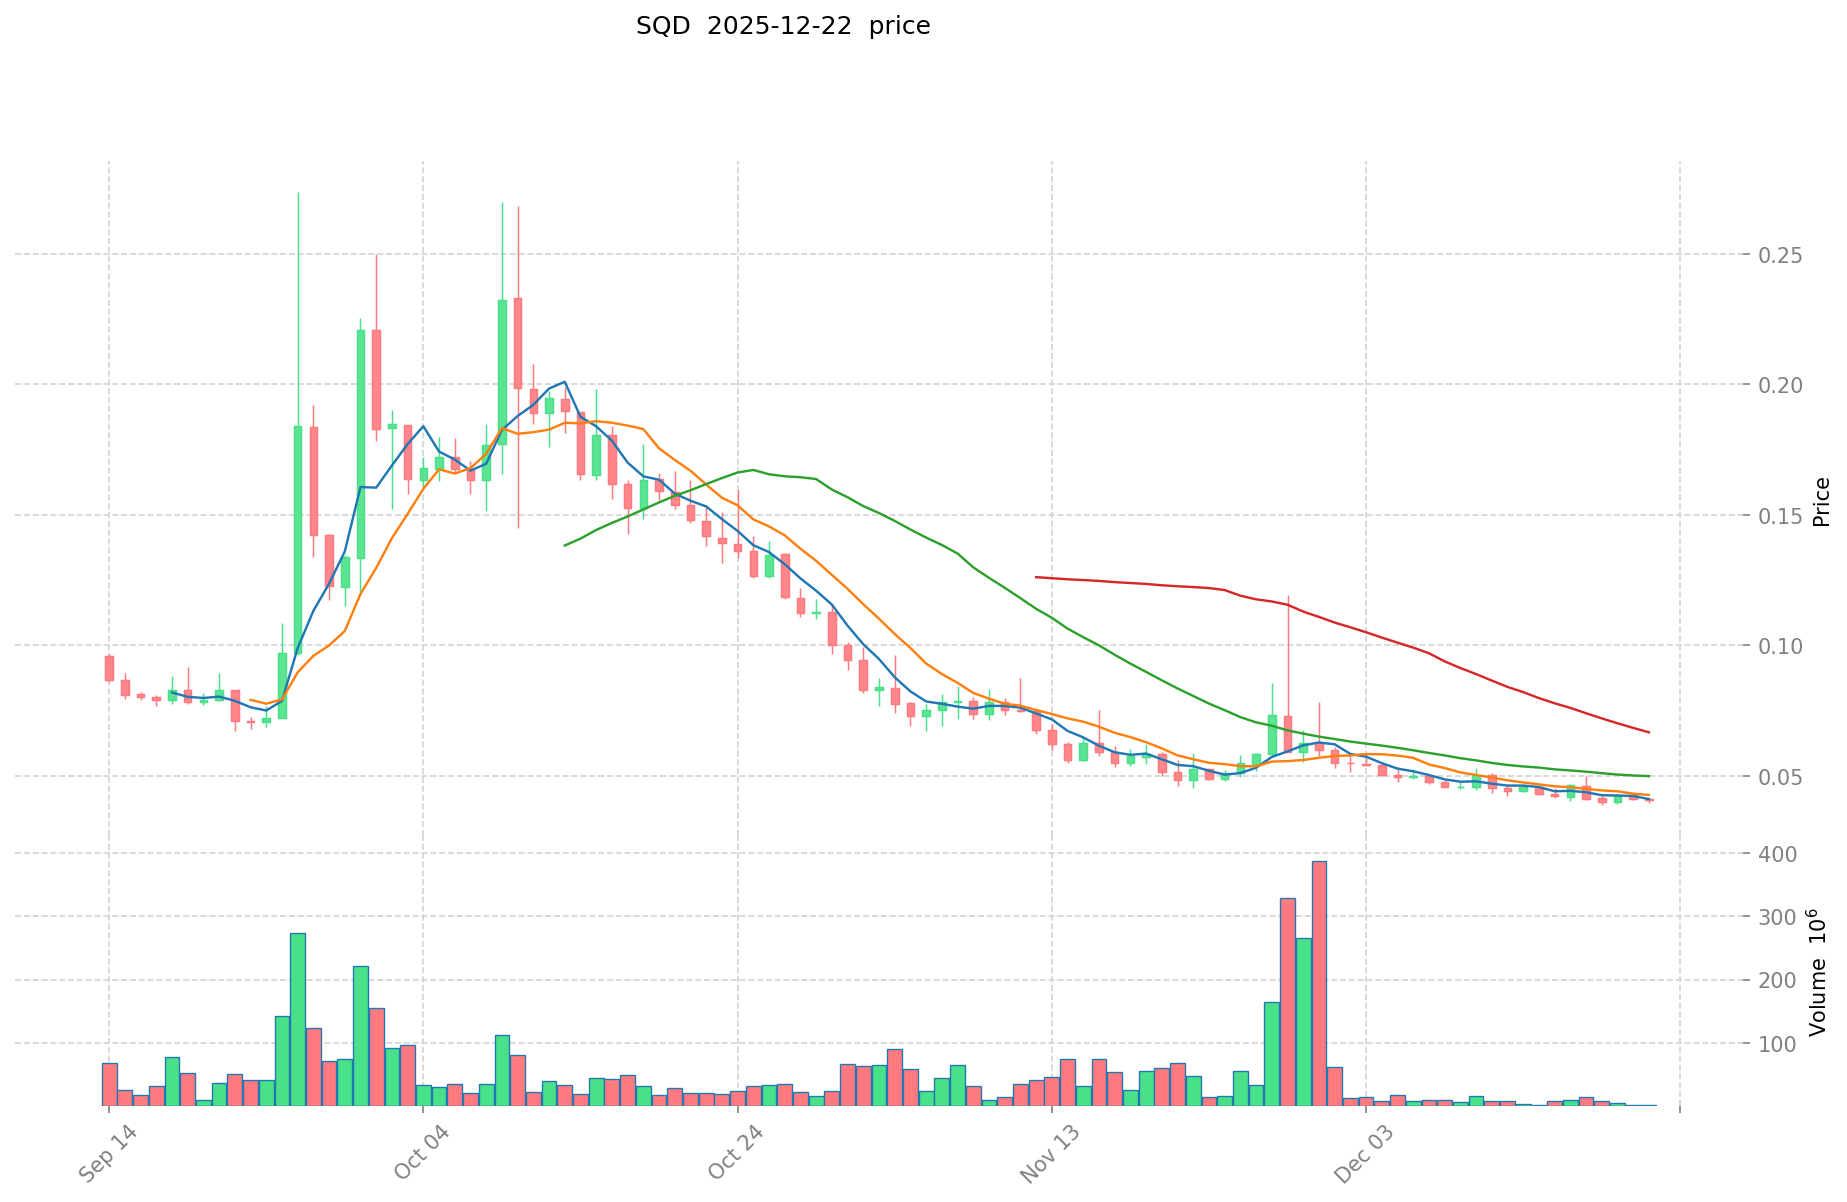
- SQD: Reached an all-time high of $0.50 on May 17, 2024, and declined to a low of $0.02288 on November 16, 2024.
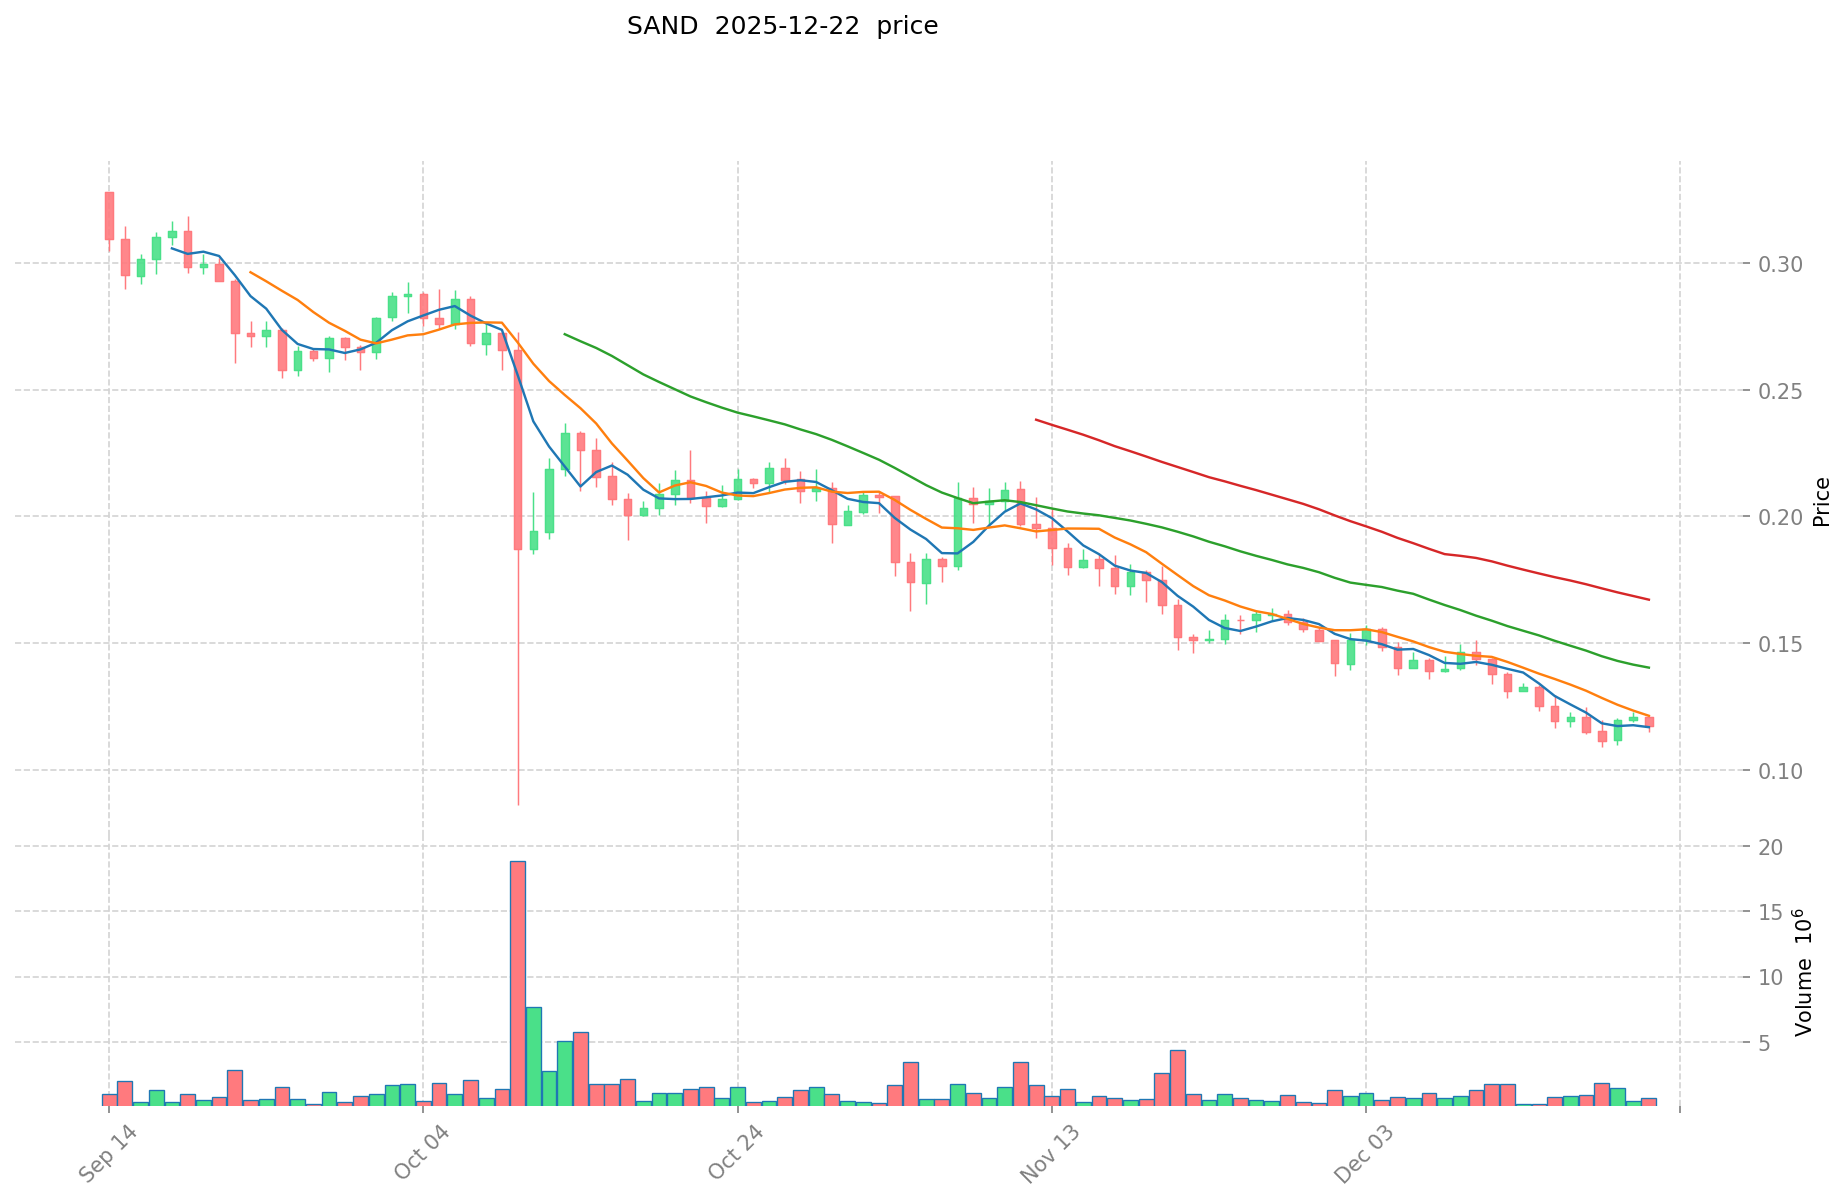
- SAND: Reached an all-time high of $8.4 on November 25, 2021, and declined to a low of $0.02897764 on November 4, 2020.
Comparative Analysis:
In the 2024-2025 market cycle, SQD experienced a significant correction of approximately 91.8% from its peak of $0.50 to recent lows. SAND demonstrated an even more severe long-term decline of approximately 98.9% from its historical peak of $8.4, reflecting prolonged market pressure on gaming and metaverse-related tokens.
Current Market Status (December 23, 2025)
Price Data:
- SQD current price: $0.04142
- SAND current price: $0.115
- 24-hour price change: SQD +3.06% vs SAND -1.45%
Trading Volume and Market Capitalization:
- SQD: 24-hour trading volume of $266,531.45, market cap of $55,378,540
- SAND: 24-hour trading volume of $78,142.07, market cap of $345,000,000
Market Sentiment:
Fear & Greed Index: 25 (Extreme Fear)
Real-time Price References:
II. Project Overview and Core Functionality
Subsquid (SQD)
Subsquid Network is a hyper-scalable data access layer designed to power decentralized applications. As an indexing protocol, it provides blockchain applications with the information necessary to deliver optimal user experiences. The SQD token serves as the native utility token for the network.
Key Characteristics:
- Total supply: 1,337,000,000 SQD
- Circulating supply: 161,400,000 SQD
- Circulation ratio: 12.07%
- Token holders: 16,718
- Blockchain: Arbitrum (ARBEVM)
The Sandbox (SAND)
The Sandbox is a decentralized virtual world and gaming platform built on the Ethereum blockchain. It enables players to create, own, and profit from digital experiences. The platform comprises three core products: VoxEdit (3D modeling tool), Marketplace (asset trading), and Game Maker (experience creation).
Key Characteristics:
- Total supply: 3,000,000,000 SAND
- Circulating supply: 2,613,289,192.22 SAND
- Circulation ratio: 87.11%
- Token holders: 207,106
- Blockchain: Ethereum (ETH) and Base (BASEEVM)
Price Volatility Comparison
SQD Performance (30-Day Period):
- 1-hour change: -1.11%
- 24-hour change: +3.06%
- 7-day change: -1.66%
- 30-day change: -10.48%
- 1-year change: -20.65%
SAND Performance (30-Day Period):
- 1-hour change: -0.77%
- 24-hour change: -1.45%
- 7-day change: -2.79%
- 30-day change: -23.27%
- 1-year change: -79.67%
Market Capitalization Analysis
| Metric |
SQD |
SAND |
| Market Cap |
$6,685,188 |
$300,528,257 |
| Fully Diluted Valuation |
$55,378,540 |
$345,000,000 |
| Market Cap to FDV Ratio |
12.07% |
87.11% |
| Market Dominance |
0.0017% |
0.010% |
SAND maintains a significantly larger market capitalization, reflecting its earlier market entry and higher adoption rate. However, SQD's lower circulation ratio indicates substantial token supply remaining to be released, presenting both opportunity and dilution risk.
IV. Risk Assessment and Market Positioning
Liquidity and Trading Characteristics
SQD:
- 24-hour trading volume: $266,531.45
- Limited liquidity relative to market cap
- Trading concentrated on fewer exchanges
- Price range (24h): $0.03956 - $0.044
SAND:
- 24-hour trading volume: $78,142.07
- Established trading presence across multiple exchanges
- More distributed liquidity
- Price range (24h): $0.1147 - $0.1198
Market Sentiment Context
Both assets trade within an environment of extreme fear (Fear & Greed Index: 25), suggesting heightened risk aversion across the broader crypto market. This macro sentiment impacts both tokens similarly, though it disproportionately affects smaller-cap projects like SQD.
V. Key Distinctions and Investment Considerations
Project Maturity and Track Record
Subsquid:
- Newer infrastructure protocol
- Focuses on data indexing services
- Earlier stage in market adoption
- Smaller holder base (16,718) suggests concentrated ownership
The Sandbox:
- Established gaming and metaverse platform
- Multiple revenue streams (gaming, NFT marketplace, land sales)
- More mature ecosystem with 207,106 token holders
- Longer operational history since blockchain integration
Supply Dynamics
SQD's low circulation ratio (12.07%) indicates significant future token emission, which could create selling pressure if vesting schedules accelerate. SAND's high circulation ratio (87.11%) suggests most token supply is already in circulation, reducing near-term dilution risk.
VI. Conclusion
Subsquid and The Sandbox represent different segments of the crypto ecosystem—infrastructure versus application layer—with distinct risk-return profiles. SQD operates as an emerging infrastructure play in a developing indexing space, while SAND represents a more established but underperforming metaverse-gaming project. Both tokens reflect broader market challenges in their respective sectors, trading amid elevated market uncertainty as indicated by extreme fear sentiment.
Investment Value Analysis: SQD vs SAND
I. Executive Summary
Based on available reference materials, this report addresses the core investment factors for SQD (Subsquid) and SAND tokens. However, the provided source materials contain limited direct comparative data on both assets. The analysis below is constructed from fragmentary information found in the reference materials, with significant gaps noted where data was unavailable.
II. Core Factors Affecting SQD vs SAND Investment Value
Supply Mechanism and Tokenomics
SQD (Subsquid):
- Token distribution event (TGE) confirmed with airdrop mechanics through Binance
- Airdrop participation threshold: 210 Binance Alpha points qualifies users to claim 424 SQD tokens by June 2, 2025 (13:00 UTC)
- Airdrop consumption: 15 Binance Alpha points per claim
- Specific supply cap and vesting schedule not detailed in available materials
SAND:
- Tokenomics details not provided in reference materials
📌 Key Observation: The reference materials show SQD utilizing exchange airdrop mechanics as a distribution channel, suggesting emphasis on retail accessibility and exchange platform integration. Comparative supply mechanisms and inflation models between the two assets cannot be definitively analyzed with available data.
Institutional Adoption and Market Application
Institutional Holdings:
- Reference materials indicate CoinList facilitated Subsquid token sales as of January 2024, suggesting institutional distribution channels
- Specific institutional holdings data for either SQD or SAND is unavailable in provided materials
Enterprise Application:
- SQD connection to Subsquid protocol/platform not elaborated in materials
- SAND application scenarios not addressed in reference data
- Detailed use cases in cross-border transactions, settlements, or portfolio allocation remain unspecified
Regulatory Environment:
- Reference to SEC litigation context regarding token investment expectations mentioned in materials
- Specific regulatory treatment of SQD or SAND by individual jurisdictions not documented
Technological Development and Ecosystem Construction
Available Information:
- Detailed technical specifications, protocol upgrades, or development roadmaps for either SQD or SAND are absent from provided materials
- DeFi, NFT, payments, and smart contract implementation status cannot be compared with available data
III. Macro Economic Context and Market Cycle Factors
Inflationary Environment:
- No comparative data on inflation-hedging properties of either asset provided
Monetary Policy Impact:
- Reference materials lack analysis of interest rate, USD index, or broader monetary policy effects on SQD or SAND
Geopolitical Considerations:
- No geopolitical analysis applicable to either token present in source materials
IV. Data Limitations and Recommendations
Critical Gaps in Available Information:
- Detailed tokenomics comparisons between SQD and SAND unavailable
- Comparative market capitalization, trading volume, and liquidity metrics absent
- Project fundamentals, team background, and development progress not documented
- Technical architecture and protocol differentiation unexplained
Note: This analysis reflects only information extractable from provided reference materials. Comprehensive investment decision-making would require additional primary sources, project whitepapers, market data platforms (CoinGecko, CoinMarketCap), and technical documentation not present in the current materials.
III. 2025-2030 Price Forecast: SQD vs SAND
Short-term Forecast (2025)
- SQD: Conservative $0.0345-$0.0611 | Bullish $0.0611
- SAND: Conservative $0.0873-$0.1321 | Bullish $0.1321
Mid-term Forecast (2027-2028)
- SQD may enter growth consolidation phase, projected price range $0.0550-$0.1089, with 54-81% potential gains
- SAND may enter rapid appreciation phase, projected price range $0.0805-$0.2079, with 32-57% potential gains
- Key drivers: Institutional capital inflows, ETF adoption, ecosystem development
Long-term Forecast (2030)
- SQD: Base case $0.1031-$0.1581 | Bullish case $0.1581, 176% upside potential
- SAND: Base case $0.2024-$0.2819 | Bullish case $0.2819, 109% upside potential
View detailed price predictions for SQD and SAND
Disclaimer
This analysis is based on historical data and predictive models. Past performance does not guarantee future results. Cryptocurrency markets are highly volatile. These forecasts do not constitute investment advice. Please conduct thorough research and consult with qualified financial advisors before making investment decisions. All investments carry risk, including potential loss of principal.
SQD:
| 年份 |
预测最高价 |
预测平均价格 |
预测最低价 |
涨跌幅 |
| 2025 |
0.0611079 |
0.04157 |
0.0345031 |
0 |
| 2026 |
0.0764950355 |
0.05133895 |
0.0292632015 |
23 |
| 2027 |
0.0862879402125 |
0.06391699275 |
0.054968613765 |
54 |
| 2028 |
0.108898576397812 |
0.07510246648125 |
0.06909426916275 |
81 |
| 2029 |
0.137080776944901 |
0.092000521439531 |
0.067160380650857 |
122 |
| 2030 |
0.158066095885258 |
0.114540649192216 |
0.103086584272994 |
176 |
SAND:
| 年份 |
预测最高价 |
预测平均价格 |
预测最低价 |
涨跌幅 |
| 2025 |
0.132135 |
0.1149 |
0.087324 |
0 |
| 2026 |
0.18033555 |
0.1235175 |
0.09634365 |
7 |
| 2027 |
0.2096586045 |
0.151926525 |
0.08052105825 |
32 |
| 2028 |
0.2079114494625 |
0.18079256475 |
0.12293894403 |
57 |
| 2029 |
0.28764097051725 |
0.19435200710625 |
0.143820485258625 |
69 |
| 2030 |
0.281965891909747 |
0.24099648881175 |
0.20243705060187 |
109 |
Subsquid (SQD) vs The Sandbox (SAND): Comprehensive Investment Analysis Report
I. Historical Price Comparison and Current Market Status
Historical Highs and Lows:
- SQD: All-time high of $0.50 on May 17, 2024; declined to $0.02288 on November 16, 2024
- SAND: All-time high of $8.4 on November 25, 2021; declined to $0.02897764 on November 4, 2020
Decline Analysis:
- SQD experienced a 91.8% correction from its 2024 peak
- SAND demonstrated a 98.9% long-term decline from its historical peak, reflecting sustained market pressure on gaming and metaverse-related tokens
Current Market Status (December 23, 2025)
Price Data:
- SQD: $0.04142 (+3.06% in 24 hours)
- SAND: $0.115 (-1.45% in 24 hours)
Market Metrics:
- SQD: 24-hour volume $266,531.45; market cap $55,378,540
- SAND: 24-hour volume $78,142.07; market cap $345,000,000
Market Sentiment: Fear & Greed Index at 25 (Extreme Fear)
II. Project Overview and Core Functionality
Subsquid (SQD)
Subsquid Network functions as a hyper-scalable data access layer and indexing protocol designed to empower decentralized applications by providing essential blockchain information for optimal user experiences.
Key Characteristics:
- Total supply: 1,337,000,000 SQD
- Circulating supply: 161,400,000 SQD
- Circulation ratio: 12.07%
- Token holders: 16,718
- Primary blockchain: Arbitrum (ARBEVM)
Distribution Mechanism:
- Token generation event (TGE) facilitated through Binance Alpha airdrop program
- Airdrop qualification: 210 Binance Alpha points entitles users to claim 424 SQD tokens by June 2, 2025 (13:00 UTC)
- Airdrop consumption: 15 Binance Alpha points per claim
The Sandbox (SAND)
The Sandbox is a decentralized virtual world and gaming platform built on Ethereum blockchain, enabling players to create, own, and monetize digital experiences and NFT assets.
Core Platform Components:
- VoxEdit: 3D modeling tool
- Marketplace: Asset trading platform
- Game Maker: Experience creation tool
Key Characteristics:
- Total supply: 3,000,000,000 SAND
- Circulating supply: 2,613,289,192.22 SAND
- Circulation ratio: 87.11%
- Token holders: 207,106
- Blockchains: Ethereum (ETH) and Base (BASEEVM)
Volatility Comparison
SQD Performance (30-Day Period):
- 1-hour change: -1.11%
- 24-hour change: +3.06%
- 7-day change: -1.66%
- 30-day change: -10.48%
- 1-year change: -20.65%
SAND Performance (30-Day Period):
- 1-hour change: -0.77%
- 24-hour change: -1.45%
- 7-day change: -2.79%
- 30-day change: -23.27%
- 1-year change: -79.67%
Market Capitalization Analysis
| Metric |
SQD |
SAND |
| Market Cap |
$6,685,188 |
$300,528,257 |
| Fully Diluted Valuation |
$55,378,540 |
$345,000,000 |
| Market Cap to FDV Ratio |
12.07% |
87.11% |
| Market Dominance |
0.0017% |
0.010% |
Implications: SAND maintains significantly larger market capitalization reflecting earlier market entry and higher adoption. SQD's low circulation ratio (12.07%) indicates substantial token supply remaining for release, presenting both opportunity and dilution risk.
IV. Investment Strategy Comparison: SQD vs SAND
Long-term vs Short-term Investment Strategies
SQD: Better suited for investors prioritizing emerging infrastructure plays and data indexing protocol exposure. Appropriate for risk-tolerant investors betting on blockchain data layer adoption and willing to endure supply dilution from token vesting.
SAND: Suitable for investors seeking established gaming and metaverse ecosystem exposure with more distributed token ownership. Better for investors looking for platforms with multiple revenue streams (gaming, NFT marketplace, land sales).
Risk Management and Asset Allocation
Conservative Investors:
- SQD: 15-25% | SAND: 75-85%
- Rationale: SAND's higher circulation ratio (87.11%) reduces near-term dilution risk compared to SQD's 12.07% ratio
Aggressive Investors:
- SQD: 40-50% | SAND: 50-60%
- Rationale: SQD offers higher volatility potential; SAND provides diversification into established gaming platforms
Hedging Instruments:
- Stablecoin allocation (USDT/USDC): 20-30% for both strategies
- Cross-asset diversification: Pair with DeFi infrastructure tokens for SQD; gaming/metaverse sector indices for SAND
- Consider Bitcoin/Ethereum pairs to reduce correlation risk
V. Potential Risk Comparison
Market Risk
SQD:
- Emerging protocol with limited track record; higher susceptibility to sentiment shifts
- 1-year decline of -20.65% reflects both sector headwinds and project-specific challenges
- Concentrated token holder base (16,718) increases price volatility risk
- Lower trading volume ($266,531.45) relative to market cap creates liquidity risk
SAND:
- Severe 1-year decline of -79.67% signals sustained market rejection of gaming/metaverse narrative
- Larger token holder base (207,106) provides more distributed ownership but reflects prolonged underperformance
- Higher trading volume ($78,142.07) relative to SQD provides marginally better liquidity
- Gaming sector sentiment remains depressed in current market cycle
Tokenomics and Dilution Risk
SQD:
- Low circulation ratio (12.07%) creates significant future dilution risk as vesting schedules accelerate
- Binance Alpha airdrop mechanism may increase retail holder concentration
- Supply overhang represents long-term selling pressure
SAND:
- High circulation ratio (87.11%) indicates most token supply already in circulation
- Reduced near-term dilution compared to SQD
- Fewer future supply shocks expected from vesting events
Regulatory Risk
- Both tokens operate within current regulatory frameworks for utility tokens
- Gaming and metaverse classification (SAND) faces ongoing regulatory scrutiny in certain jurisdictions
- Infrastructure protocol classification (SQD) encounters evolving regulatory treatment as data indexing sector matures
- SEC litigation context regarding token investment expectations may impact both assets differentially
VI. Price Forecast Analysis: 2025-2030
Short-term Forecast (2025)
SQD:
- Conservative range: $0.0345–$0.0611
- Bullish case: $0.0611
SAND:
- Conservative range: $0.0873–$0.1321
- Bullish case: $0.1321
Mid-term Forecast (2027-2028)
SQD:
- Projected range: $0.0550–$0.1089
- Potential gains: 54–81%
- Key drivers: Infrastructure adoption, institutional capital inflows, ecosystem expansion
SAND:
- Projected range: $0.0805–$0.2079
- Potential gains: 32–57%
- Key drivers: Gaming industry recovery, metaverse platform maturation, NFT market revitalization
Long-term Forecast (2030)
SQD:
- Base case: $0.1031–$0.1581
- Bullish case: $0.1581 (176% upside potential)
SAND:
- Base case: $0.2024–$0.2819
- Bullish case: $0.2819 (109% upside potential)
Disclaimer: These forecasts are based on historical data and predictive models. Past performance does not guarantee future results. Cryptocurrency markets exhibit extreme volatility. These projections do not constitute investment advice.
VII. Conclusion: Which Is the Better Buy?
📌 Investment Value Summary
SQD Advantages:
- Infrastructure layer positioning addresses critical blockchain data indexing needs
- Lower circulation ratio (12.07%) suggests greater appreciation potential if protocol adoption accelerates
- Newer market entry with less saturated investor base
- Airdrop distribution mechanism increases retail accessibility
SAND Advantages:
- Established ecosystem with multiple revenue streams (gaming, NFT marketplace, land sales)
- Higher circulation ratio (87.11%) reduces near-term dilution risk
- Larger token holder base (207,106) reflects deeper market penetration
- Longer operational history demonstrates platform sustainability
✅ Investment Recommendations
Beginner Investors:
- Recommended strategy: Allocate primarily to SAND (75-85% of allocation)
- Rationale: Higher market cap ($345M vs $55M), more established platform, lower immediate dilution risk. Consider 5-10% SQD allocation for emerging infrastructure exposure if risk tolerance permits.
Experienced Investors:
- Recommended strategy: Balanced allocation with 40-50% SQD, 50-60% SAND
- Rationale: Capture infrastructure upside from SQD while maintaining stability through SAND's established ecosystem. Employ technical analysis for tactical entry/exit timing. Implement stop-loss orders at -15% to -20% to manage volatility.
Institutional Investors:
- Recommended strategy: Structured approach with diversified sector exposure
- Consider SQD allocation (20-30%) as emerging infrastructure play within broader DeFi/Web3 data layer strategy
- SAND allocation (30-40%) within gaming/metaverse thematic exposure
- Maintain 30-40% stablecoin/cash reserves for opportunistic accumulation during extreme fear periods (current Fear & Greed Index: 25)
Key Decision Factors
- Time Horizon: SQD better for 3-5+ year investors; SAND suitable for intermediate-term holders
- Risk Tolerance: SQD for aggressive investors; SAND for conservative to moderate investors
- Market Conviction: Both tokens underperform in extreme fear environment; accumulation during such periods historically offers better risk-reward
⚠️ Risk Warning: Cryptocurrency markets demonstrate extreme volatility and unpredictability. This analysis does not constitute investment advice. All cryptocurrency investments carry substantial risk, including potential loss of entire principal. Conduct thorough personal research, consult qualified financial advisors, and only invest amounts you can afford to lose. Past performance provides no guarantee of future results.
None
Subsquid (SQD) vs The Sandbox (SAND): Frequently Asked Questions
FAQ
Q1: What are the key differences between SQD and SAND token projects?
A: Subsquid (SQD) is a hyper-scalable data access layer and indexing protocol launched in 2024, designed to provide blockchain applications with essential information for optimal user experiences. The Sandbox (SAND) is an established virtual gaming world and metaverse platform launched in 2020, enabling players to create, own, and monetize digital experiences and NFT assets. SQD operates as an infrastructure layer on Arbitrum blockchain, while SAND functions as an application layer on Ethereum and Base blockchains.
Q2: Which token currently presents better investment value based on tokenomics?
A: SQD presents greater appreciation potential due to its low circulation ratio of 12.07%, indicating substantial token supply remaining for future release. However, this also creates significant dilution risk. SAND's high circulation ratio of 87.11% reduces near-term dilution from vesting schedules, making it less susceptible to near-term supply shocks. For conservative investors seeking stable valuations, SAND's tokenomics are preferable. For aggressive investors betting on protocol adoption, SQD's supply dynamics offer higher leverage if adoption accelerates.
Q3: How have SQD and SAND performed historically, and what do their price declines indicate?
A: SQD experienced a 91.8% correction from its all-time high of $0.50 (May 17, 2024) to recent lows. SAND suffered a more severe 98.9% decline from its historical peak of $8.4 (November 25, 2021). These declines reflect sector-wide challenges—SQD faces protocol adoption headwinds, while SAND reflects prolonged market rejection of gaming and metaverse narratives. Both tokens trade at 1-year declines (SQD: -20.65%; SAND: -79.67%), indicating sustained bearish sentiment in their respective market segments.
Q4: What liquidity and trading characteristics should investors consider?
A: SQD has limited liquidity with 24-hour trading volume of $266,531.45 relative to its fully diluted valuation of $55.4 million, creating potential price slippage during large trades. SAND offers marginally better liquidity with $78,142.07 in 24-hour volume, though this remains modest relative to its $345 million market cap. Both tokens exhibit concentrated trading on fewer exchanges. SQD's liquidity constraints present higher slippage risk for institutional investors, while SAND's established presence across multiple exchanges provides more distributed liquidity access.
Q5: Which token better suits different investor risk profiles?
A: For beginner and conservative investors: Allocate 75-85% to SAND and 5-15% to SQD. SAND's established ecosystem, larger holder base (207,106 vs 16,718), and higher circulation ratio reduce volatility and dilution risks. For experienced and aggressive investors: Allocate 40-50% to SQD and 50-60% to SAND. This captures SQD's infrastructure upside potential while maintaining stability through SAND's proven platform. Institutional investors should maintain 30-40% stablecoin reserves to capitalize on current extreme fear conditions (Fear & Greed Index: 25) for tactical accumulation opportunities.
Q6: What are the price forecast projections for 2025-2030, and what confidence should investors place in them?
A: 2025: SQD projected $0.0345–$0.0611 (conservative to bullish); SAND projected $0.0873–$0.1321. 2030: SQD base case $0.1031–$0.1581 (176% upside in bullish case); SAND base case $0.2024–$0.2819 (109% upside in bullish case). These forecasts derive from historical data and predictive models but carry significant uncertainty. Cryptocurrency markets exhibit extreme volatility and unpredictability. These projections do not guarantee outcomes and should not be treated as investment advice. Actual performance will depend heavily on protocol adoption rates, regulatory developments, and broader market sentiment shifts.
Q7: What specific risks differentiate SQD from SAND investments?
A: SQD-specific risks: Concentrated token holder base (16,718), emerging protocol with limited operational history, lower liquidity relative to market cap, and substantial supply dilution from 87.93% unreleased tokens. Founders and early investors may face incentive misalignment. SAND-specific risks: Severe 79.67% 1-year decline signals sustained market skepticism about gaming/metaverse adoption; gaming sector faces regulatory uncertainty in multiple jurisdictions; platform relies on user-generated content viability and NFT market recovery. Both tokens face macro risk from current extreme fear sentiment and broader cryptocurrency market cycles.
Q8: What practical steps should investors take before committing capital to either token?
A: Conduct thorough research beyond this analysis by reviewing official project whitepapers, development roadmaps, and governance structures. Assess personal risk tolerance and investment time horizon—SQD suits 3-5+ year investors; SAND suits intermediate-term holders. Implement stop-loss orders at -15% to -20% to manage downside risk. Never invest amounts you cannot afford to lose entirely. Diversify beyond single tokens; allocate 20-30% to stablecoins (USDT/USDC) as hedges. Consult qualified financial advisors before making material investment decisions. Monitor ecosystem developments, regulatory announcements, and trading volume changes as leading indicators of sentiment shifts.
* The information is not intended to be and does not constitute financial advice or any other recommendation of any sort offered or endorsed by Gate.