This comprehensive analysis compares SWARMS, a newly launched enterprise-scale AI coordination framework launched December 2024, with XTZ (Tezos), an established self-amending blockchain platform operating since 2017. The article examines historical price trends revealing SWARMS' extreme volatility versus XTZ's relative stability, analyzes tokenomics and market adoption patterns, and provides 2026-2031 price forecasts on Gate. Key differences include market cap rankings (SWARMS 1153 vs XTZ 112), holder bases (5.7M+ for XTZ), and risk profiles. Designed for investors across experience levels, this guide addresses investment suitability, optimal allocation strategies, comparative risks, and practical considerations for selecting between emerging AI-driven tokens and established smart contract platforms in the decentralized ecosystem.
Introduction: Investment Comparison Between SWARMS and XTZ
In the cryptocurrency market, the comparison between SWARMS vs XTZ remains a topic of ongoing interest among investors. These two assets differ significantly in market capitalization ranking, application scenarios, and price performance, representing distinct positioning within the crypto asset landscape.
SWARMS: Launched in December 2024, this enterprise-scale multi-agent collaboration framework has attracted attention with its focus on decentralized AI coordination systems. Currently ranked at 1153 by market cap, SWARMS operates with a nearly complete circulating supply of 999,984,830 tokens.
XTZ (Tezos): Since its launch in October 2017, Tezos has established itself as a self-amending blockchain platform emphasizing formal verification and on-chain governance. Ranked at 112 by market cap, XTZ maintains a circulating supply of approximately 1.07 billion tokens with over 5.7 million holders.
This article will provide a comprehensive analysis of SWARMS vs XTZ investment value comparison, examining historical price trends, supply mechanisms, institutional adoption, technological ecosystems, and future outlook. We aim to address the key question that concerns investors:
"Which is the better buy right now?"
Through detailed examination of market data, technical fundamentals, and adoption metrics, readers will gain insights into how these two crypto assets compare across multiple dimensions, enabling more informed investment decisions based on their individual risk tolerance and investment objectives.
I. Historical Price Comparison and Current Market Status
Historical Price Trends of SWARMS (Coin A) and XTZ (Coin B)
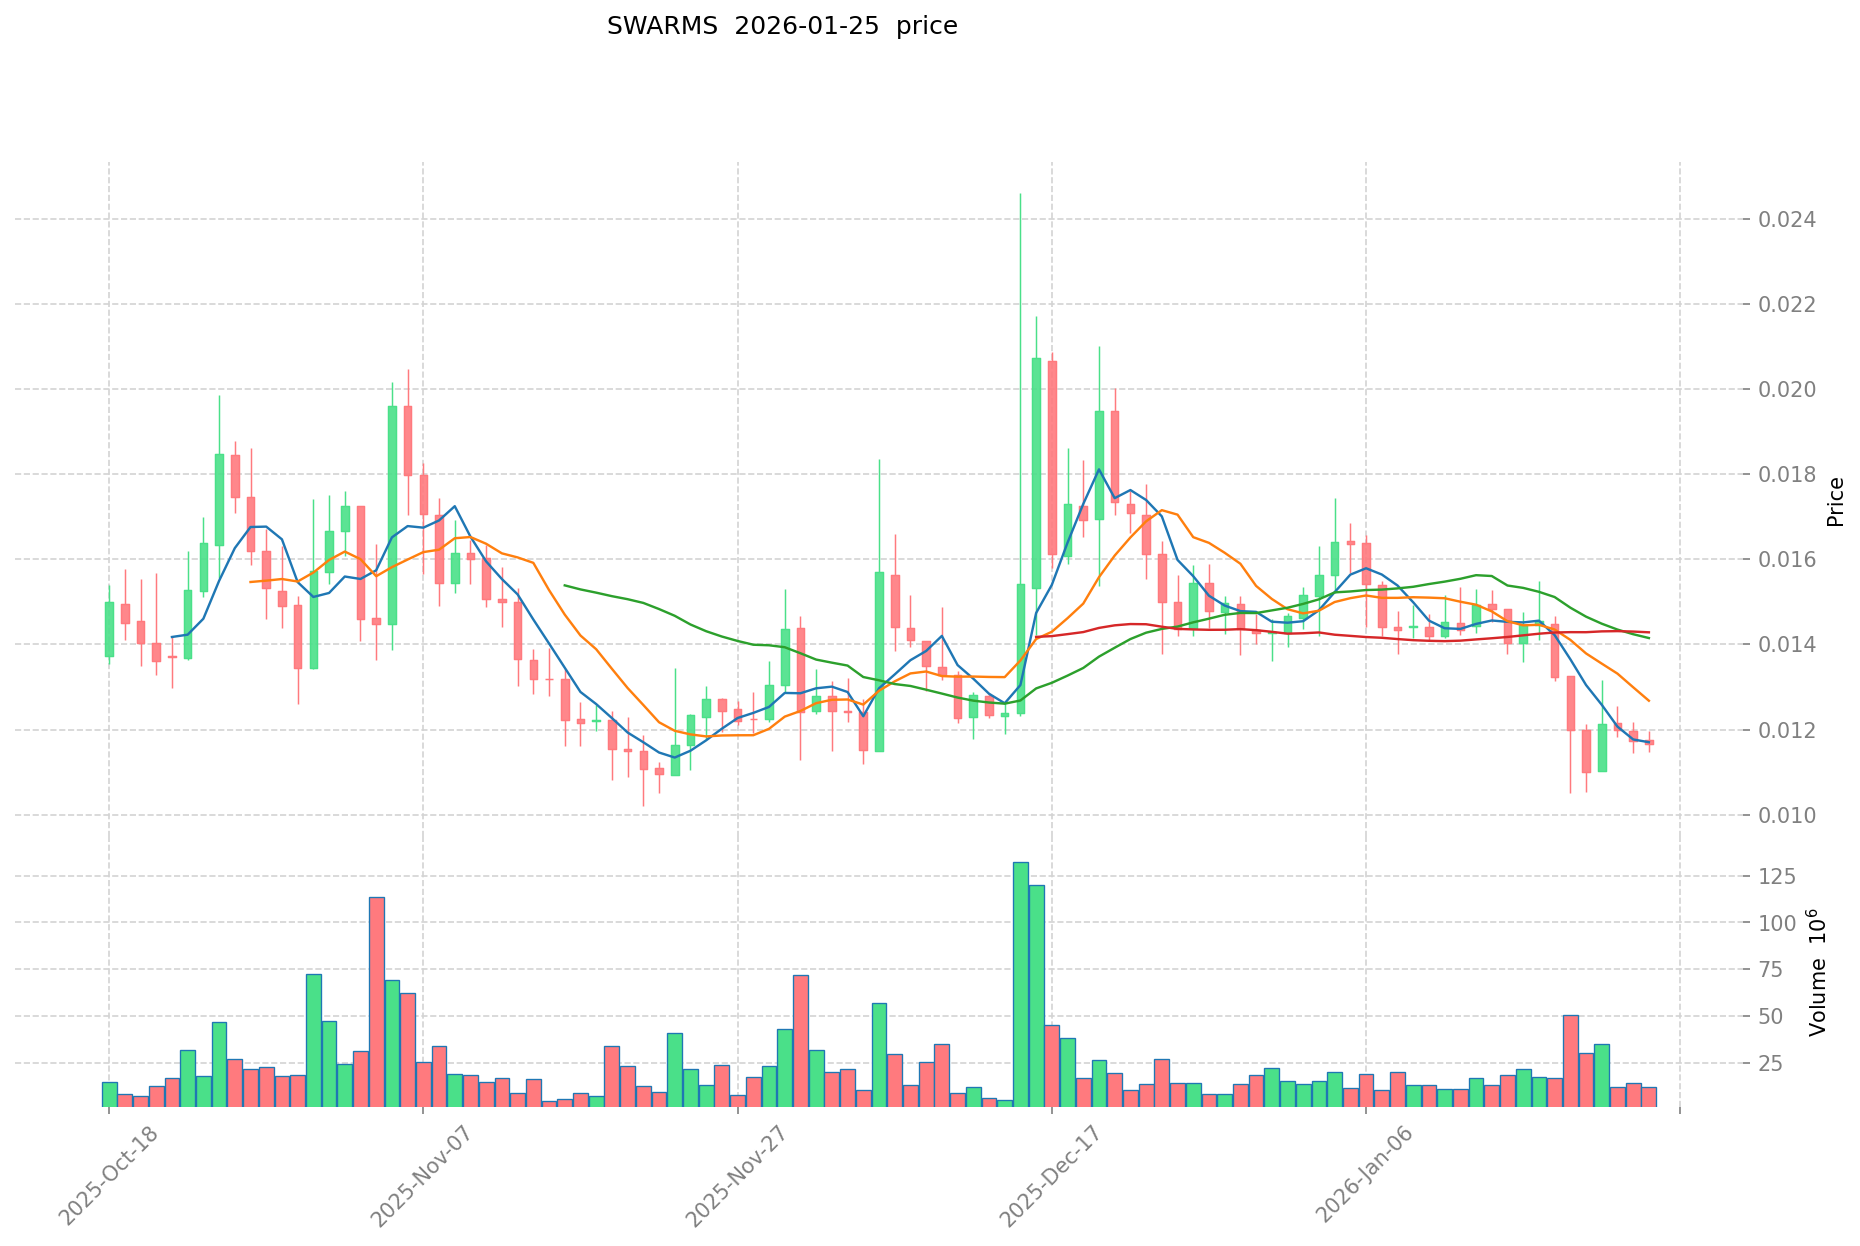
- 2025: SWARMS experienced significant volatility after its launch in December 2024, reaching a peak of $0.628 on January 7, 2025.
- 2021: XTZ was influenced by market conditions during the cryptocurrency bull cycle, with price reaching $9.12 on October 4, 2021.
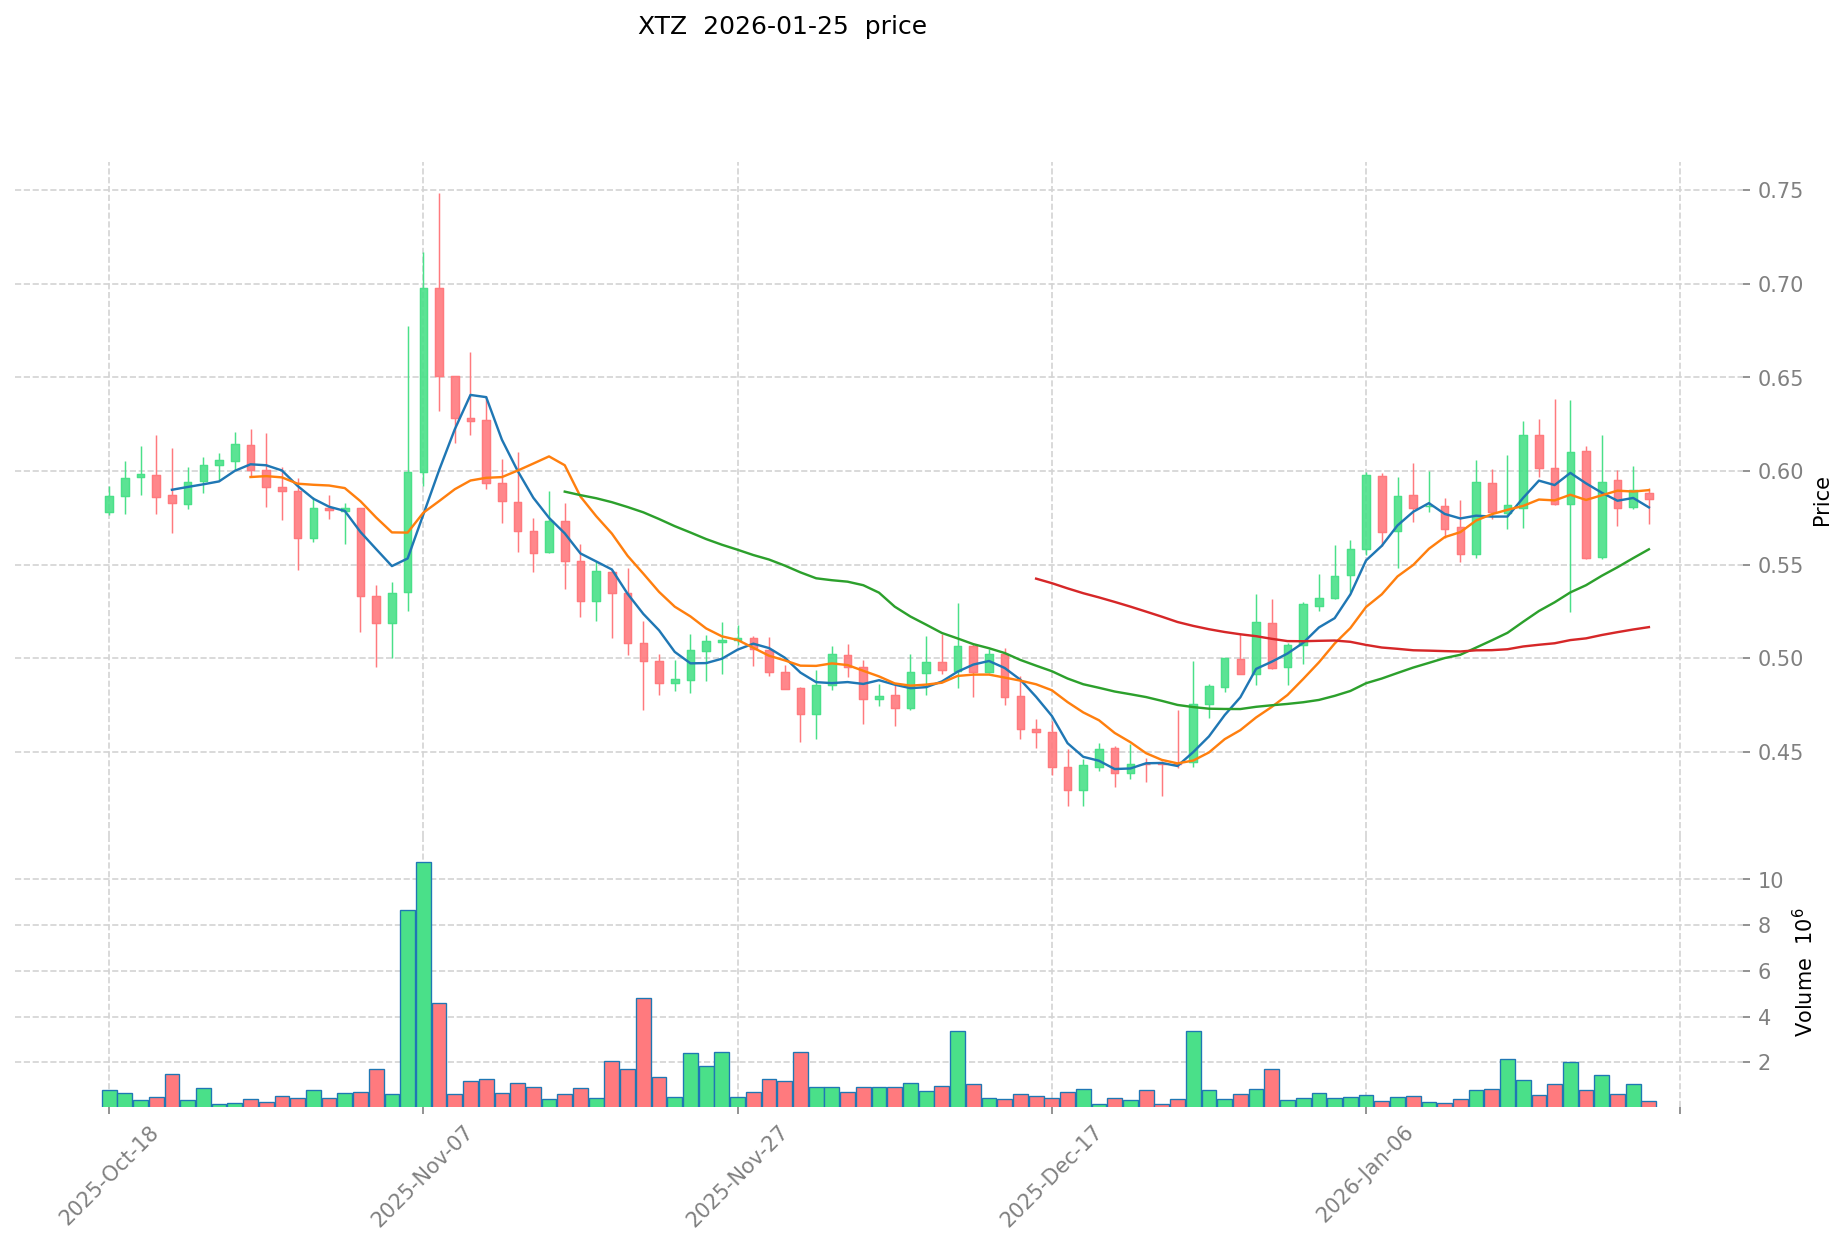
- Comparative Analysis: During the recent market period, SWARMS declined from its high of $0.628 to a low of $0.00531 recorded on October 10, 2025, representing substantial downward movement. In contrast, XTZ has shown relative stability within its established trading range, having reached its historical high of $9.12 in 2021 and its historical low of $0.350476 in December 2018.
Current Market Status (2026-01-26)
- SWARMS current price: $0.010873
- XTZ current price: $0.5636
- 24-hour trading volume: SWARMS $205,420.10 vs XTZ $219,001.44
- Market Sentiment Index (Fear & Greed Index): 25 (Extreme Fear)
View real-time prices:
II. Core Factors Affecting SWARMS vs XTZ Investment Value
Supply Mechanism Comparison (Tokenomics)
Due to limited available data on the specific supply mechanisms of SWARMS and XTZ, a detailed comparison cannot be provided at this time. Investors should conduct independent research into the tokenomics of both assets, including total supply, circulating supply, emission schedules, and any deflationary or inflationary mechanisms that may be in place.
Institutional Adoption and Market Applications
Without sufficient information regarding institutional holdings, enterprise adoption cases, or specific regulatory stances toward SWARMS and XTZ across different jurisdictions, a comprehensive comparison of their market applications cannot be established. Investors are encouraged to monitor developments in institutional interest, real-world use cases, and evolving regulatory frameworks that may impact both assets.
Technology Development and Ecosystem Building
Insufficient data is available to detail specific technology upgrades, development roadmaps, or ecosystem activities for SWARMS and XTZ. Key considerations for investors include ongoing protocol improvements, developer activity, decentralized finance (DeFi) integrations, non-fungible token (NFT) platforms, payment infrastructure, and smart contract deployment trends within each ecosystem.
Macroeconomic Factors and Market Cycles
The relationship between SWARMS and XTZ performance under varying macroeconomic conditions, including inflationary environments, monetary policy shifts, interest rate changes, and U.S. dollar index movements, cannot be adequately assessed with the current information set. Additionally, geopolitical factors and cross-border transaction demand may influence both assets differently, warranting further analysis as data becomes available.
III. 2026-2031 Price Forecast: SWARMS vs XTZ
Short-term Forecast (2026)
- SWARMS: Conservative $0.0055 - $0.0108 | Optimistic $0.0108 - $0.0125
- XTZ: Conservative $0.417 - $0.564 | Optimistic $0.564 - $0.739
Mid-term Forecast (2028-2029)
- SWARMS may enter a consolidation phase, with estimated price range of $0.0115 - $0.0162
- XTZ may enter a growth phase, with estimated price range of $0.476 - $0.920
- Key drivers: institutional capital inflows, ETF developments, ecosystem expansion
Long-term Forecast (2030-2031)
- SWARMS: Baseline scenario $0.0094 - $0.0147 | Optimistic scenario $0.0123 - $0.0247
- XTZ: Baseline scenario $0.690 - $0.847 | Optimistic scenario $1.029 - $1.225
View detailed price predictions for SWARMS and XTZ
Disclaimer
SWARMS:
| Year |
Predicted High Price |
Predicted Average Price |
Predicted Low Price |
Price Change |
| 2026 |
0.01249088 |
0.010768 |
0.00549168 |
0 |
| 2027 |
0.0137227392 |
0.01162944 |
0.0111642624 |
6 |
| 2028 |
0.016225394688 |
0.0126760896 |
0.011535241536 |
16 |
| 2029 |
0.01488426440832 |
0.014450742144 |
0.0115605937152 |
32 |
| 2030 |
0.018921079226246 |
0.01466750327616 |
0.009387202096742 |
34 |
| 2031 |
0.024687608139268 |
0.016794291251203 |
0.012259832613378 |
54 |
XTZ:
| Year |
Predicted High Price |
Predicted Average Price |
Predicted Low Price |
Price Change |
| 2026 |
0.738578 |
0.5638 |
0.417212 |
0 |
| 2027 |
0.74886735 |
0.651189 |
0.41676096 |
15 |
| 2028 |
0.84703409175 |
0.700028175 |
0.476019159 |
24 |
| 2029 |
0.92050204871625 |
0.773531133375 |
0.649766152035 |
37 |
| 2030 |
1.211233725195243 |
0.847016591045625 |
0.736904434209693 |
50 |
| 2031 |
1.224658938163316 |
1.029125158120434 |
0.689513855940691 |
82 |
IV. Investment Strategy Comparison: SWARMS vs XTZ
Long-term vs Short-term Investment Strategies
- SWARMS: May be considered by investors with higher risk tolerance who are focused on emerging AI coordination technologies and willing to accept volatility in early-stage projects. The asset's recent launch and limited historical data suggest it remains in an experimental phase.
- XTZ: May appeal to investors seeking exposure to established blockchain infrastructure with emphasis on governance mechanisms and formal verification, though price stability has varied across market cycles.
Risk Management and Asset Allocation
- Conservative Investors: SWARMS 5-10% vs XTZ 15-20%
- Aggressive Investors: SWARMS 20-30% vs XTZ 30-40%
- Hedging Tools: Stablecoin allocation for liquidity management, options strategies where available, cross-asset portfolio diversification
V. Potential Risk Comparison
Market Risk
- SWARMS: The asset has experienced considerable price fluctuations since launch, declining from $0.628 to as low as $0.00531 within a relatively short timeframe. Limited trading volume of approximately $205,420 may contribute to liquidity concerns and heightened volatility.
- XTZ: While XTZ has demonstrated more established market presence with over 5.7 million holders, it remains subject to broader cryptocurrency market cycles and sentiment shifts. The current price of $0.5636 reflects distance from historical peaks observed in 2021.
Technical Risk
- SWARMS: As a newly launched framework, questions remain regarding network stability, scalability under increased load, and long-term technical viability. The nearly complete circulating supply may limit flexibility in addressing future development needs.
- XTZ: Considerations include ongoing protocol evolution, network participation rates in governance processes, and competitive positioning relative to other smart contract platforms. Technical upgrades and ecosystem development pace may influence adoption trajectories.
Regulatory Risk
- Global regulatory frameworks continue to evolve, with potential differential impacts on AI-focused tokens versus established smart contract platforms. Investors should monitor jurisdiction-specific developments, classification determinations, and compliance requirements that may affect both assets differently.
VI. Conclusion: Which Is the Better Buy?
📌 Investment Value Summary:
- SWARMS Characteristics: Early-stage positioning in decentralized AI coordination, recent market entry with associated volatility, lower market capitalization ranking (1153)
- XTZ Characteristics: Established blockchain platform since 2017, emphasis on formal verification and on-chain governance, broader holder base exceeding 5.7 million participants
✅ Investment Considerations:
- Novice Investors: Consider beginning with smaller allocations to understand market dynamics, prioritize established assets with greater liquidity, and implement risk management practices including diversification across multiple asset classes.
- Experienced Investors: May evaluate both assets within a balanced portfolio approach, considering SWARMS for speculative allocation alongside more established holdings like XTZ, while maintaining awareness of correlation patterns during market cycles.
- Institutional Investors: Should conduct comprehensive due diligence on governance structures, custody solutions, regulatory compliance frameworks, and liquidity profiles for both assets before determining appropriate allocation strategies.
⚠️ Risk Disclosure: Cryptocurrency markets exhibit significant volatility. This analysis does not constitute investment advice. Individuals should conduct independent research and consult with qualified financial advisors before making investment decisions.
VII. FAQ
Q1: What is the main difference between SWARMS and XTZ in terms of project focus?
SWARMS is a newly launched (December 2024) enterprise-scale multi-agent collaboration framework focused on decentralized AI coordination systems, while XTZ (Tezos) is an established self-amending blockchain platform emphasizing formal verification and on-chain governance since October 2017. SWARMS represents an experimental approach to AI-driven coordination with a market cap ranking of 1153, whereas XTZ has established itself as a mature smart contract platform ranked at 112 by market capitalization with over 5.7 million holders, indicating significantly different stages of development and market adoption.
Q2: How do the price volatilities of SWARMS and XTZ compare?
SWARMS has demonstrated substantially higher volatility with extreme price swings, declining from its peak of $0.628 on January 7, 2025, to as low as $0.00531 by October 10, 2025—representing approximately 99% downward movement within less than a year. In contrast, XTZ has shown relatively more stable price behavior within established trading ranges, with its historical high of $9.12 in October 2021 and current price of $0.5636, reflecting the typical volatility patterns of more established cryptocurrency assets rather than the dramatic fluctuations characteristic of newly launched tokens.
Q3: Which asset is more suitable for conservative investors?
XTZ appears more suitable for conservative investors based on several factors: longer operational history since 2017, broader holder base exceeding 5.7 million participants, higher market cap ranking (112 vs 1153), and more established liquidity profiles. Conservative allocation strategies suggest 15-20% portfolio weight for XTZ compared to only 5-10% for SWARMS. However, conservative investors should note that both assets remain subject to cryptocurrency market volatility and should maintain appropriate diversification across multiple asset classes with stable investments forming the portfolio foundation.
Q4: What are the projected price ranges for SWARMS and XTZ by 2031?
According to baseline forecasts, SWARMS is projected to trade within a range of $0.0094 to $0.0147 by 2031, with optimistic scenarios suggesting $0.0123 to $0.0247, representing a potential 54% increase from 2026 levels under favorable conditions. XTZ baseline projections estimate a range of $0.690 to $0.847 by 2031, with optimistic scenarios suggesting $1.029 to $1.225, representing an 82% potential increase from 2026 levels. These projections assume continued ecosystem development, institutional adoption, and favorable macroeconomic conditions, though actual outcomes may vary significantly based on market dynamics.
Q5: What trading volume differences exist between SWARMS and XTZ?
As of the current market status, SWARMS records a 24-hour trading volume of approximately $205,420.10, while XTZ shows a slightly higher trading volume of $219,001.44, indicating relatively similar short-term trading activity despite significant differences in market capitalization and holder base. The low trading volumes for both assets compared to their market caps may indicate limited liquidity, which could contribute to price volatility and wider bid-ask spreads. Investors should consider liquidity constraints when planning entry and exit strategies, particularly for larger position sizes.
Q6: How do institutional adoption patterns differ between SWARMS and XTZ?
Due to limited available data on institutional holdings and enterprise adoption for both assets, a comprehensive comparison cannot be definitively established. However, XTZ's longer operational history since 2017 and substantially larger holder base of over 5.7 million participants suggest greater likelihood of institutional awareness and potential adoption pathways. SWARMS, having launched only in December 2024, remains in early stages where institutional participation data has not yet materialized. Investors interested in institutional adoption metrics should monitor future developments including custody solution availability, regulatory clarity, and enterprise use case announcements for both assets.
Q7: What are the primary risk factors investors should consider for each asset?
For SWARMS, primary risks include extreme price volatility (99% decline from peak), limited trading liquidity ($205,420 daily volume), early-stage technical uncertainties regarding network stability and scalability, and the asset's experimental positioning in decentralized AI coordination without established use cases. For XTZ, key risks involve distance from historical price peaks (current $0.5636 vs $9.12 high), competitive pressures from other smart contract platforms, governance participation uncertainties, and broader cryptocurrency market cycle dependencies. Both assets face evolving regulatory frameworks that may impact classification and compliance requirements differently based on their distinct technological focuses.
Q8: Under what market conditions might SWARMS outperform XTZ?
SWARMS could potentially outperform XTZ during periods of heightened speculative interest in AI-focused blockchain projects, breakthrough developments in multi-agent coordination technology demonstrating practical applications, or significant improvements in trading liquidity that reduce volatility concerns. Additionally, successful ecosystem partnerships, institutional validation of decentralized AI coordination systems, or favorable regulatory clarity specifically for AI-integrated blockchain assets could create outperformance scenarios. However, given SWARMS' early stage and extreme historical volatility, such outperformance would likely come with substantially elevated risk compared to XTZ's more established market position.
* The information is not intended to be and does not constitute financial advice or any other recommendation of any sort offered or endorsed by Gate.