This comprehensive guide compares SWFTC and LTC investment value across multiple dimensions including historical price trends, supply mechanisms, and market adoption. SWFTC, launched in 2018 as a cross-chain exchange platform token, contrasts with LTC's established 2011 peer-to-peer payment positioning. Current market data shows LTC dominates in liquidity ($10.3M daily volume vs SWFTC's $17K) and market cap ($5.39B vs $50.96M). The article provides detailed tokenomics analysis, institutional adoption patterns, technological ecosystem comparisons, and price predictions through 2031, offering differentiated investment strategies for conservative, aggressive, and institutional investors. Risk assessments highlight SWFTC's higher volatility against LTC's market maturity, alongside regulatory considerations affecting both assets.
Introduction: Investment Comparison Between SWFTC and LTC
In the cryptocurrency market, the comparison between SWFTC and LTC remains a topic that investors cannot avoid. These two assets exhibit significant differences not only in market cap ranking, application scenarios, and price performance, but also represent distinct positioning within the crypto asset landscape.
SwftCoin (SWFTC): Launched in 2018, it has gained market recognition through its positioning as the native utility token of SWFT Blockchain, powering an AI-driven ecosystem (SWFTGPT) and serving as the first AI token featured on Coinbase.
Litecoin (LTC): Since its launch in 2011, it has been regarded as "digital silver," representing one of the highest trading volume and market capitalization cryptocurrencies globally, created by Charlie Lee as a peer-to-peer cryptocurrency based on the Bitcoin protocol with modifications in hashing algorithm and maximum supply.
This article will provide a comprehensive analysis of the investment value comparison between SWFTC and LTC, focusing on historical price trends, supply mechanisms, institutional adoption, technical ecosystems, and future predictions, attempting to answer the question that concerns investors most:
"Which is the better buy right now?"
I. Historical Price Comparison and Current Market Status
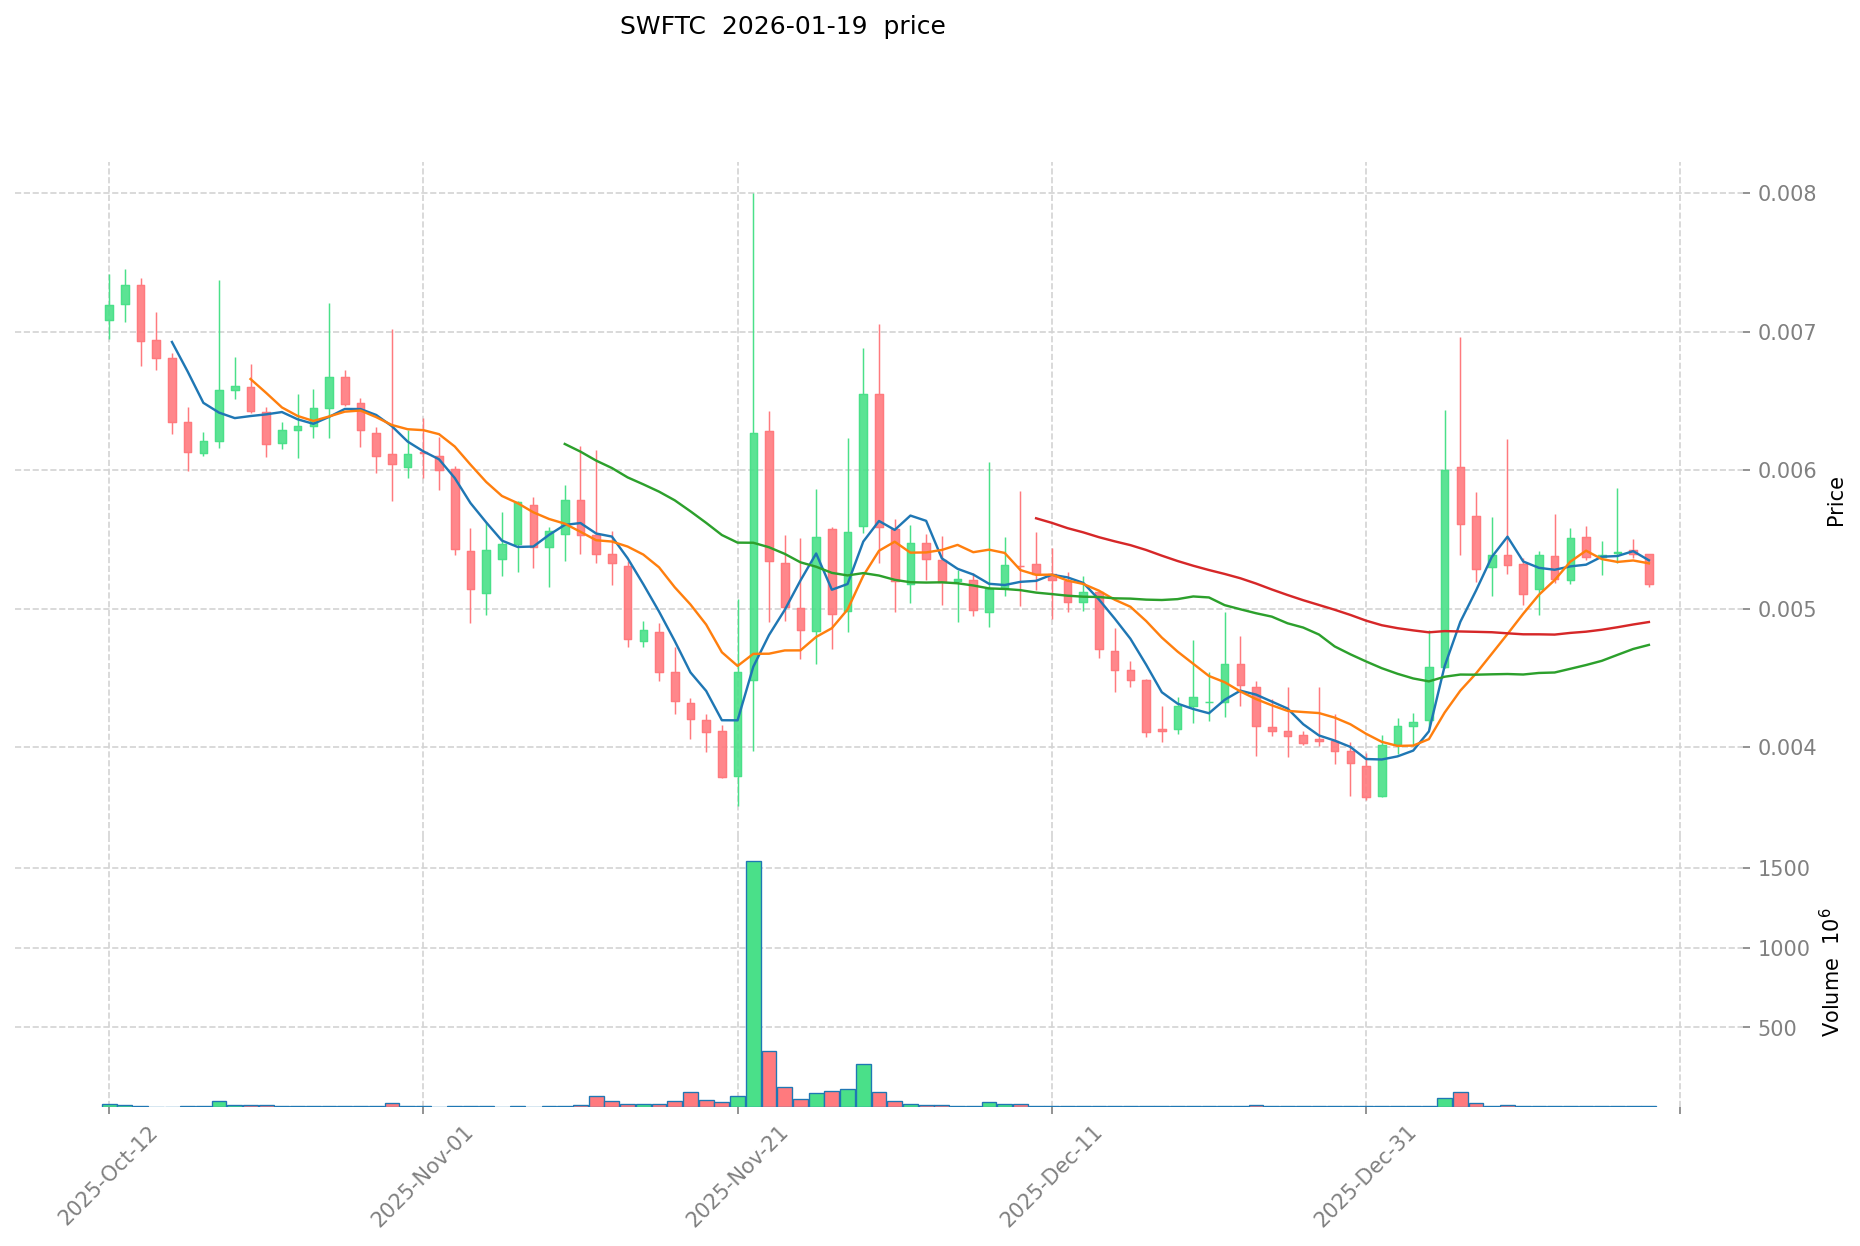
SWFTC and LTC Historical Price Trends
- 2020: SWFTC recorded its historical low at $0.00046438 on March 13, 2020, reflecting broader market weakness during the early pandemic period.
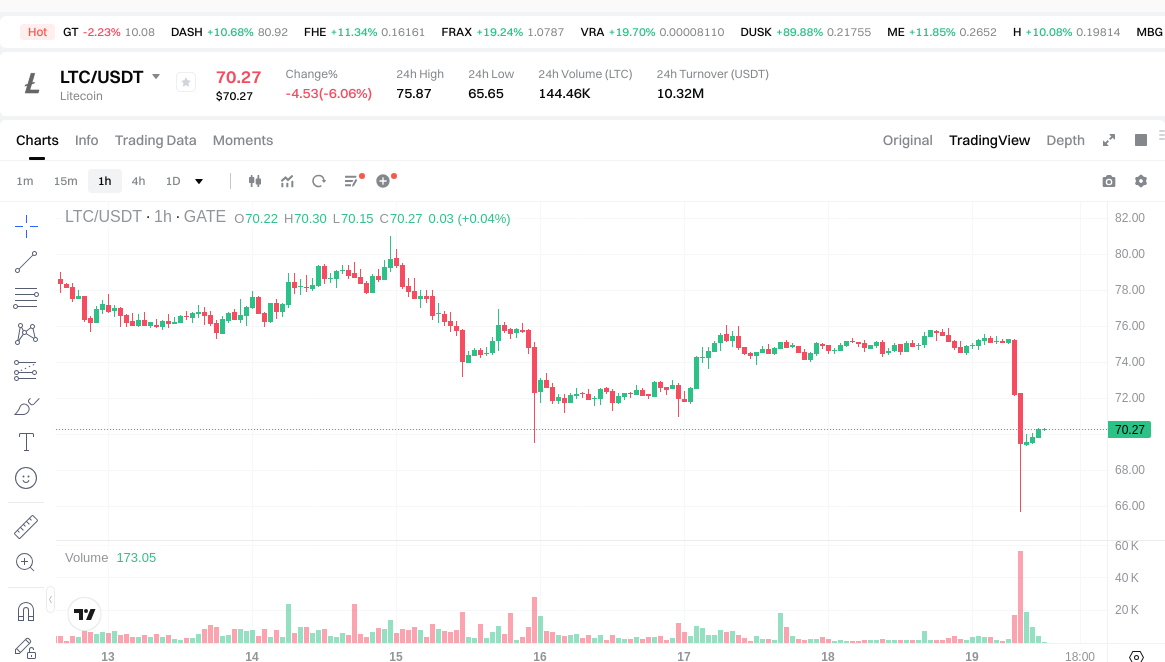
- 2021: LTC reached its historical high at $410.26 on May 10, 2021, driven by increased institutional interest and broader cryptocurrency market momentum.
- 2025: SWFTC achieved its historical high at $0.04665833 on February 1, 2025, while LTC experienced significant volatility throughout the year.
- Comparative Analysis: During recent market cycles, SWFTC demonstrated substantial volatility with a range from its all-time low of $0.00046438 to its peak of $0.04665833, representing considerable percentage movements. In contrast, LTC maintained a broader price range from $1.15 (January 14, 2015) to $410.26 (May 10, 2021), reflecting its more established market position.
Current Market Status (January 19, 2026)
- SWFTC Current Price: $0.005096
- LTC Current Price: $70.25
- 24-Hour Trading Volume: SWFTC $17,385.16 vs LTC $10,315,879.34
- Market Capitalization: SWFTC $50.96M vs LTC $5.39B
- Price Changes (24H): SWFTC -4.28% vs LTC -6.29%
- Market Sentiment Index (Fear & Greed Index): 44 (Fear)
View real-time prices:
- Check SWFTC current price Market Price
- Check LTC current price Market Price
II. Core Factors Influencing SWFTC vs LTC Investment Value
Supply Mechanism Comparison (Tokenomics)
- SWFTC: The token operates within a cross-chain exchange ecosystem, with value influenced by platform transaction volume and token utility demand.
- LTC: Implements a halving mechanism similar to Bitcoin, with a fixed maximum supply of 84 million coins, creating scarcity through periodic block reward reductions.
- 📌 Historical Pattern: Supply mechanisms drive price cycles through scarcity dynamics and demand fluctuations in the crypto market.
Institutional Adoption and Market Application
- Institutional Holdings: LTC has gained broader institutional recognition due to its longer operational history and established market position.
- Enterprise Adoption: LTC demonstrates stronger presence in cross-border payment solutions and settlement systems, while SWFTC focuses on facilitating multi-chain token exchanges within its platform ecosystem.
- National Policy: Regulatory attitudes vary across jurisdictions, with established cryptocurrencies like LTC generally receiving clearer regulatory frameworks compared to newer platform tokens.
Technological Development and Ecosystem Building
- SWFTC Technology: Operates as a cross-chain exchange platform token, with value tied to the efficiency and adoption of its multi-chain trading infrastructure.
- LTC Technology: Benefits from network security enhancements and transaction speed optimizations, maintaining its position as a proven payment-oriented cryptocurrency.
- Ecosystem Comparison: LTC demonstrates broader integration across payment processors and merchant acceptance networks, while SWFTC's ecosystem centers around cross-chain trading functionality.
Macroeconomic Factors and Market Cycles
- Performance Under Inflation: Traditional economic factors such as inflation and monetary policy shifts can drive investors toward alternative assets, potentially affecting demand for both tokens.
- Macroeconomic Policy: Interest rate changes and currency fluctuations, particularly in regions like Belize (relevant to SWFTC trading pairs), can influence investor sentiment and asset allocation decisions.
- Geopolitical Considerations: Cross-border transaction demand and international market dynamics contribute to the overall adoption patterns of both cryptocurrencies.
III. 2026-2031 Price Prediction: SWFTC vs LTC
Short-term Prediction (2026)
- SWFTC: Conservative $0.00453633 - $0.005097 | Optimistic $0.005097 - $0.00728871
- LTC: Conservative $51.9258 - $70.17 | Optimistic $70.17 - $103.8516
Mid-term Prediction (2028-2029)
- SWFTC may enter a gradual growth phase, with estimated price range of $0.004492297017 - $0.010819914734655
- LTC may enter a volatile expansion phase, with estimated price range of $63.91378314 - $161.40938454
- Key drivers: institutional capital inflows, ETF developments, ecosystem expansion
Long-term Prediction (2031)
- SWFTC: Base scenario $0.007923186627748 - $0.011651745040806 | Optimistic scenario $0.011651745040806 - $0.015962890705904
- LTC: Base scenario $137.27524645624734 - $149.2122244089645 | Optimistic scenario $149.2122244089645 - $188.00740275529527
View detailed price predictions for SWFTC and LTC
Disclaimer
SWFTC:
| Year |
Predicted High Price |
Predicted Average Price |
Predicted Low Price |
Price Change |
| 2026 |
0.00728871 |
0.005097 |
0.00453633 |
0 |
| 2027 |
0.0082984257 |
0.006192855 |
0.00501621255 |
21 |
| 2028 |
0.008549855613 |
0.00724564035 |
0.004492297017 |
42 |
| 2029 |
0.010819914734655 |
0.0078977479815 |
0.006397175865015 |
54 |
| 2030 |
0.013944658723535 |
0.009358831358077 |
0.00851653653585 |
83 |
| 2031 |
0.015962890705904 |
0.011651745040806 |
0.007923186627748 |
128 |
LTC:
| Year |
Predicted High Price |
Predicted Average Price |
Predicted Low Price |
Price Change |
| 2026 |
103.8516 |
70.17 |
51.9258 |
0 |
| 2027 |
129.646092 |
87.0108 |
76.569504 |
23 |
| 2028 |
161.40938454 |
108.328446 |
63.91378314 |
54 |
| 2029 |
159.1453200186 |
134.86891527 |
130.8228478119 |
92 |
| 2030 |
151.417331173629 |
147.0071176443 |
89.674341763023 |
109 |
| 2031 |
188.00740275529527 |
149.2122244089645 |
137.27524645624734 |
112 |
IV. Investment Strategy Comparison: SWFTC vs LTC
Long-term vs Short-term Investment Strategies
- SWFTC: Suitable for investors interested in cross-chain exchange platforms and emerging token ecosystems, with a focus on platform utility growth and adoption within multi-chain trading environments.
- LTC: Suitable for investors seeking established payment infrastructure with longer operational history and broader institutional recognition in the cryptocurrency market.
Risk Management and Asset Allocation
- Conservative Investors: SWFTC 20% vs LTC 80%
- Aggressive Investors: SWFTC 40% vs LTC 60%
- Hedging Tools: Stablecoin allocation, options strategies, cross-asset portfolio diversification
V. Potential Risk Comparison
Market Risk
- SWFTC: Exhibits higher volatility with limited trading volume ($17,385.16 in 24-hour period) and smaller market capitalization ($50.96M), potentially resulting in greater price fluctuations during market uncertainty.
- LTC: Demonstrates broader market liquidity with substantial trading volume ($10,315,879.34 in 24-hour period) and larger market capitalization ($5.39B), though remains subject to cryptocurrency market cycles and sentiment shifts.
Technical Risk
- SWFTC: Platform dependency on cross-chain exchange infrastructure performance, network stability considerations, and multi-chain integration complexity.
- LTC: Network security maintenance requirements, mining ecosystem dynamics, and ongoing protocol development challenges.
Regulatory Risk
- Global regulatory frameworks may affect both assets differently, with established cryptocurrencies like LTC potentially receiving clearer regulatory treatment compared to platform-specific utility tokens. Jurisdictional variations in cryptocurrency classification and taxation policies present ongoing compliance considerations for both assets.
VI. Conclusion: Which Is the Better Buy?
📌 Investment Value Summary:
- SWFTC Advantages: Cross-chain exchange utility positioning, platform-driven token demand model, and integration within multi-chain trading infrastructure.
- LTC Advantages: Established market position since 2011, broader institutional recognition, substantial liquidity, and proven payment-oriented cryptocurrency functionality.
✅ Investment Recommendations:
- Novice Investors: Consider LTC for its longer operational history, greater liquidity, and established market presence before exploring smaller market cap alternatives.
- Experienced Investors: Evaluate portfolio diversification strategies incorporating both established assets like LTC and platform-specific tokens like SWFTC based on individual risk tolerance and market analysis.
- Institutional Investors: Assess LTC for its broader integration across payment systems and merchant networks, while monitoring SWFTC's platform development and ecosystem growth metrics.
⚠️ Risk Disclaimer: Cryptocurrency markets exhibit substantial volatility. This content does not constitute investment advice.
VII. FAQ
Q1: What are the main differences between SWFTC and LTC in terms of market positioning?
SWFTC and LTC serve fundamentally different purposes in the cryptocurrency ecosystem. SWFTC operates as a utility token for the SWFT Blockchain cross-chain exchange platform, launched in 2018, with value derived from platform transaction volume and multi-chain trading infrastructure adoption. LTC, launched in 2011, functions as "digital silver" – a peer-to-peer payment cryptocurrency with proven merchant acceptance and broader institutional recognition. The key distinction lies in SWFTC's platform-specific utility versus LTC's established position as a payment-oriented cryptocurrency with $5.39B market capitalization compared to SWFTC's $50.96M.
Q2: How do the supply mechanisms differ between SWFTC and LTC?
LTC implements a halving mechanism similar to Bitcoin, with a fixed maximum supply of 84 million coins and periodic block reward reductions that create scarcity over time. SWFTC operates within a cross-chain exchange ecosystem where token value is influenced by platform transaction volume and utility demand rather than predetermined halving schedules. This fundamental difference means LTC's price dynamics follow predictable supply reduction patterns, while SWFTC's value correlates more directly with platform adoption and cross-chain trading activity.
Q3: Which cryptocurrency demonstrates better liquidity and trading volume?
LTC significantly outperforms SWFTC in liquidity metrics. As of January 19, 2026, LTC records $10,315,879.34 in 24-hour trading volume compared to SWFTC's $17,385.16 – a difference of over 593 times. This substantial liquidity gap means LTC offers easier entry and exit positions with minimal price slippage, while SWFTC's limited trading volume may result in greater price volatility during larger transactions. For investors prioritizing liquidity and market depth, LTC presents a considerably more liquid investment option.
Q4: What are the projected price ranges for SWFTC and LTC through 2031?
Short-term predictions for 2026 suggest SWFTC may range between $0.00453633 - $0.00728871, while LTC could fluctuate between $51.9258 - $103.8516. Long-term projections for 2031 estimate SWFTC reaching $0.007923186627748 - $0.015962890705904 (base to optimistic scenarios), representing a potential 128% increase from 2026 averages. LTC's 2031 projections suggest $137.27524645624734 - $188.00740275529527, indicating a 112% potential increase. These predictions assume continued ecosystem development, institutional adoption trends, and favorable macroeconomic conditions, though cryptocurrency markets remain inherently volatile.
Q5: How should investors allocate between SWFTC and LTC based on risk tolerance?
Conservative investors might consider an 80% LTC / 20% SWFTC allocation, prioritizing LTC's established market position, superior liquidity, and longer operational history since 2011. Aggressive investors could adopt a 60% LTC / 40% SWFTC strategy, increasing exposure to SWFTC's potential growth within the cross-chain exchange sector while maintaining LTC as a portfolio anchor. Risk management should incorporate stablecoin allocations, options strategies, and cross-asset diversification. Novice investors are generally advised to focus primarily on LTC before exploring smaller market cap alternatives like SWFTC.
Q6: What are the primary risks associated with investing in SWFTC versus LTC?
SWFTC carries higher volatility risk due to its smaller market capitalization ($50.96M), limited trading volume, and platform-specific dependency on cross-chain exchange infrastructure performance. Technical risks include network stability considerations and multi-chain integration complexity. LTC faces market cycle exposure despite broader liquidity, along with mining ecosystem dynamics and protocol development challenges. Regulatory risk affects both assets differently – LTC benefits from clearer regulatory frameworks due to its established status, while SWFTC as a platform-specific utility token faces evolving jurisdictional classifications. Both remain subject to cryptocurrency market volatility and macroeconomic policy shifts.
Q7: Which cryptocurrency offers better institutional adoption prospects?
LTC demonstrates significantly stronger institutional adoption, benefiting from its 15-year operational history, integration across payment processors, and merchant acceptance networks. Its $5.39B market capitalization and substantial daily trading volume ($10,315,879.34) attract institutional interest seeking established cryptocurrency exposure. SWFTC's institutional prospects center around cross-chain exchange platform growth and multi-chain trading infrastructure adoption, representing a more specialized institutional use case. For investors prioritizing institutional backing and broader market acceptance, LTC presents a more mature investment option with proven track record in payment solutions and settlement systems.
Q8: How do current market conditions affect SWFTC and LTC investment decisions?
As of January 19, 2026, the Fear & Greed Index stands at 44 (Fear), indicating cautious market sentiment. Under these conditions, SWFTC's 24-hour price decline of -4.28% and LTC's -6.29% reflect broader cryptocurrency market weakness. Current market conditions favor LTC's superior liquidity for investors seeking easier position adjustments, though both assets face downward pressure. SWFTC's current price of $0.005096 represents a significant decline from its February 2025 all-time high of $0.04665833, while LTC at $70.25 trades well below its May 2021 peak of $410.26. During fearful market periods, LTC's established position and deeper liquidity generally provide more stable investment characteristics compared to smaller market cap alternatives.
* The information is not intended to be and does not constitute financial advice or any other recommendation of any sort offered or endorsed by Gate.