This comprehensive guide compares T and ETC tokens across multiple dimensions to help investors make informed decisions. T (Threshold), launched in 2022 through NuCypher and Keep Network merger, focuses on privacy-preserving blockchain infrastructure. ETC (Ethereum Classic), the original Ethereum chain since 2016, emphasizes decentralized smart contracts under 'code is law' principles. The analysis examines historical price trends, current market status, tokenomics, institutional adoption, and technical ecosystems. ETC demonstrates stronger fundamentals with defined 210.7 million token maximum supply, higher trading volume ($1.58M vs $39K daily), and institutional backing through Grayscale. T offers emerging technology exposure with lower entry pricing. Price forecasts through 2031 suggest ETC baseline growth to $13.34-$20.67 while T ranges $0.0144-$0.0247. Investment suitability varies by risk tolerance and portfolio objectives, requiring careful consideration of liquidity differences and ecosystem developme
Introduction: T vs ETC Investment Comparison
In the cryptocurrency market, the comparison of T vs ETC remains an essential topic for investors. The two differ significantly in market cap ranking, application scenarios, and price performance, representing distinct positioning in the crypto asset landscape.
T (Threshold): Launched in 2022 through the merger of NuCypher (NU) and Keep Network (KEEP), T has established its presence by focusing on privacy-preserving infrastructure for digital assets on public blockchains.
ETC (Ethereum Classic): Since its inception in 2015, ETC has been recognized as the continuation of the original Ethereum chain, upholding the "code is law" principle and supporting decentralized smart contract execution.
This article will comprehensively analyze the investment value comparison of T vs ETC through historical price trends, supply mechanisms, institutional adoption, technical ecosystems, and future predictions, attempting to address investors' primary concern:
"Which is the better buy right now?"
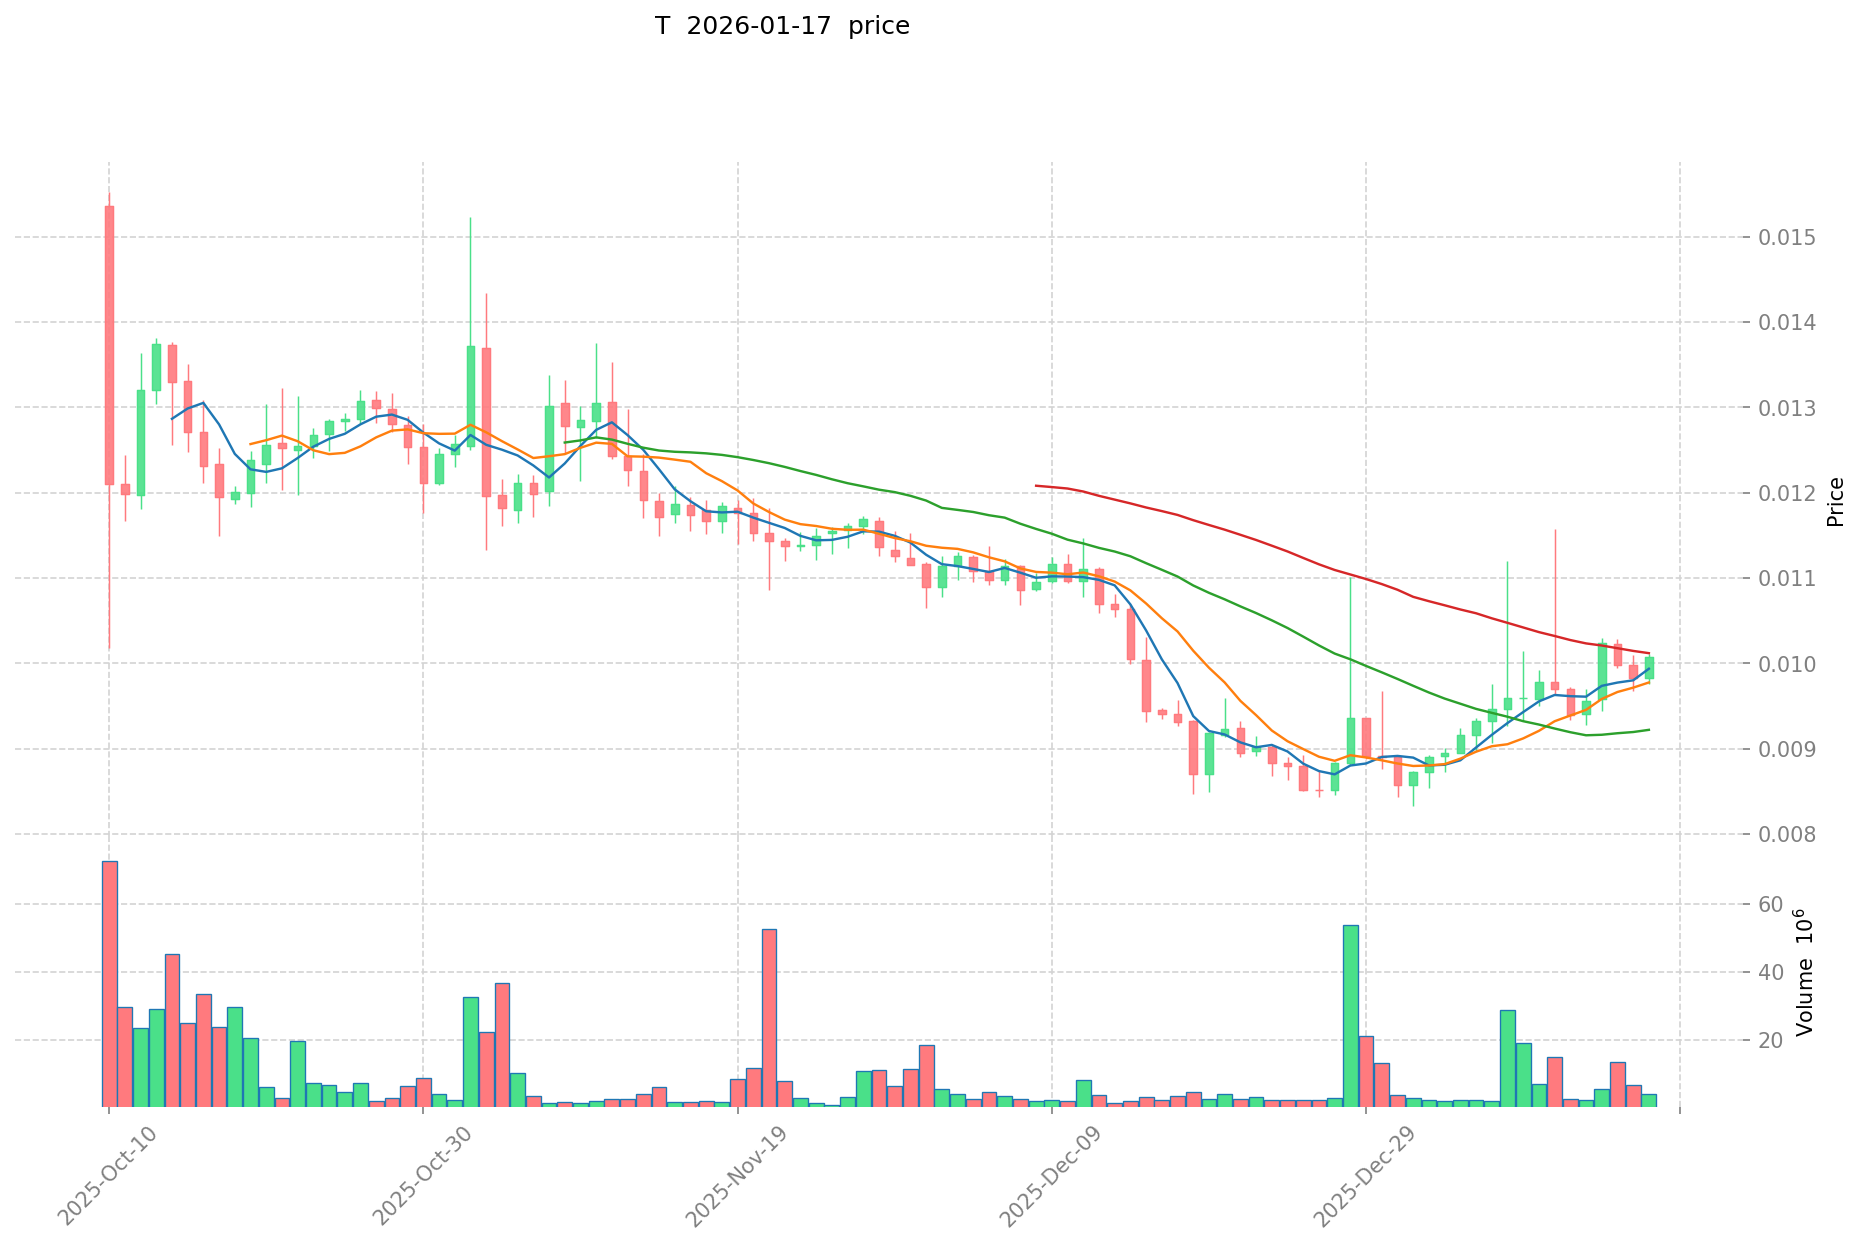
I. Historical Price Comparison and Current Market Status
Threshold (T) and Ethereum Classic (ETC) Historical Price Trends
-
2021-2022: Threshold (T) emerged from the merger of NuCypher (NU) and Keep Network (KEEP) tokens in February 2022, with conversion ratios of 1 NU = 3.26 T and 1 KEEP = 4.78 T. The token reached its all-time high of $0.226934 on March 2, 2022.
-
2016-2021: Ethereum Classic (ETC) originated from the Ethereum blockchain hard fork in July 2016 following the DAO hack incident. The token achieved its all-time high of $167.09 on May 7, 2021, during a period of market expansion.
-
Comparative Analysis: During recent market cycles, Threshold (T) declined from its peak of $0.226934 to a low of $0.00833935 on January 1, 2026, representing notable volatility. In contrast, Ethereum Classic (ETC) moved from its 2021 peak of $167.09 to a low of $0.615038 on July 25, 2016, showing different cyclical patterns.
Current Market Status (January 17, 2026)
- Threshold (T) Current Price: $0.010198
- Ethereum Classic (ETC) Current Price: $12.813
- 24-Hour Trading Volume: T recorded $39,573.90 compared to ETC's $1,583,086.86
- Market Sentiment Index (Fear & Greed Index): 50 (Neutral)
View real-time prices:
II. Core Factors Influencing T vs ETC Investment Value
Supply Mechanism Comparison (Tokenomics)
- T: Information regarding T's supply mechanism is not available in the provided materials.
- ETC: ETC adopts a limited supply model similar to Bitcoin, with a maximum supply cap of 210.7 million tokens. Currently, approximately 153.9 million tokens are in circulation, accounting for 73.05% of the maximum supply. The remaining tokens will be gradually released through mining. ETC implements periodic block reward halving events, which directly impact the supply side. Historical data suggests that prices typically rise following each halving due to supply contraction.
- 📌 Historical Pattern: Limited supply assets like ETC possess scarcity characteristics, potentially offering long-term appreciation potential. The halving mechanism creates cyclical supply constraints that have historically correlated with price increases.
Institutional Adoption and Market Applications
- Institutional Holdings: ETC has garnered support from institutional investors such as Grayscale ETC Trust. These institutional participants not only provide market liquidity but also enhance ETC's market recognition. Information regarding institutional adoption of T is not available in the provided materials.
- Enterprise Adoption: ETC operates as a platform for executing smart contracts without third-party intermediaries and has become one of the leading cryptocurrencies globally in terms of trading volume and market capitalization. Specific enterprise adoption details for both T and ETC in cross-border payments, settlements, and investment portfolios are not extensively covered in the materials.
- National Policies: ETC maintains the Proof of Work (PoW) consensus mechanism, differentiating itself from Ethereum's transition to Proof of Stake (PoS). This creates a distinct competitive positioning. Comprehensive regulatory attitudes across different countries toward both assets are not detailed in the provided materials.
Technical Development and Ecosystem Building
- T Technical Upgrades: Information regarding T's technical development and upgrades is not available in the provided materials.
- ETC Technical Development: ETC adheres to the "code is law" principle as the original blockchain following Ethereum's 2016 hard fork. The platform continues technical development focused on maintaining its PoW consensus mechanism and smart contract capabilities.
- Ecosystem Comparison: ETC functions as a smart contract platform with established presence in the cryptocurrency market. Detailed comparisons of DeFi, NFT, payment applications, and smart contract implementations between T and ETC are not comprehensively covered in the available materials.
Macroeconomic Factors and Market Cycles
- Performance Under Inflation: Assets with limited supply characteristics, such as ETC, may offer inflation hedging properties due to their scarcity. Specific comparative analysis of inflation resistance between T and ETC is not available in the provided materials.
- Macroeconomic Monetary Policy: The cryptocurrency market as a whole is influenced by interest rates and the US Dollar Index. As of late October 2025, the Fear and Greed Index showed a reading of 34 (Fear), indicating that investors maintain a cautious stance toward the cryptocurrency market overall. Specific impacts of monetary policy on T versus ETC are not detailed in the materials.
- Geopolitical Factors: ETC's position as a decentralized platform may provide value in cross-border transaction scenarios. However, specific analysis of geopolitical influences and international situation impacts on both T and ETC is not extensively covered in the provided materials.
III. 2026-2031 Price Forecast: T vs ETC
Short-term Forecast (2026)
- T: Conservative $0.0065-$0.0102 | Optimistic $0.0102-$0.0140
- ETC: Conservative $6.65-$12.80 | Optimistic $12.80-$16.77
Mid-term Forecast (2028-2029)
- T may enter a consolidation phase with projected price range of $0.0099-$0.0205 in 2028, potentially expanding to $0.0162-$0.0261 by 2029
- ETC may experience gradual appreciation with estimated range of $10.96-$20.55 in 2028, followed by $9.12-$20.39 in 2029
- Key drivers: institutional capital inflows, ETF developments, ecosystem expansion
Long-term Forecast (2030-2031)
- T: Baseline scenario $0.0144-$0.0247 | Optimistic scenario $0.0218-$0.0312
- ETC: Baseline scenario $13.34-$20.67 | Optimistic scenario $19.14-$20.70
View detailed price predictions for T and ETC
Disclaimer: Price predictions are based on historical data analysis and market modeling. Actual prices may vary significantly due to market volatility, regulatory changes, technological developments, and other unforeseen factors. This information is for reference purposes only and does not constitute investment advice.
T:
| Year |
Predicted High Price |
Predicted Average Price |
Predicted Low Price |
Price Change |
| 2026 |
0.01397126 |
0.010198 |
0.00652672 |
0 |
| 2027 |
0.0174018672 |
0.01208463 |
0.0062840076 |
18 |
| 2028 |
0.020493115554 |
0.0147432486 |
0.009877976562 |
44 |
| 2029 |
0.02607490947396 |
0.017618182077 |
0.01620872751084 |
72 |
| 2030 |
0.024686596726292 |
0.02184654577548 |
0.019443425740177 |
114 |
| 2031 |
0.031177205476187 |
0.023266571250886 |
0.014425274175549 |
128 |
ETC:
| Year |
Predicted High Price |
Predicted Average Price |
Predicted Low Price |
Price Change |
| 2026 |
16.76538 |
12.798 |
6.65496 |
0 |
| 2027 |
15.6685914 |
14.78169 |
12.5644365 |
15 |
| 2028 |
20.553939945 |
15.2251407 |
10.962101304 |
18 |
| 2029 |
20.39407596765 |
17.8895403225 |
9.123665564475 |
39 |
| 2030 |
20.673152796681 |
19.141808145075 |
15.31344651606 |
49 |
| 2031 |
20.70377968971312 |
19.907480470878 |
13.33801191548826 |
55 |
IV. Investment Strategy Comparison: T vs ETC
Long-term vs Short-term Investment Strategies
-
T: May be suitable for investors with higher risk tolerance who are interested in privacy-preserving infrastructure and emerging blockchain technologies. The token's relatively lower price point and recent market positioning suggest it may appeal to those seeking potential appreciation from ecosystem development.
-
ETC: May be appropriate for investors seeking exposure to established smart contract platforms with defined supply mechanisms. The limited supply model and proof-of-work consensus mechanism position ETC for consideration by those interested in scarcity-driven value propositions and alternative layer-1 platforms.
Risk Management and Asset Allocation
-
Conservative Investors: A potential allocation framework could include T at 20-30% and ETC at 70-80% within a cryptocurrency portfolio segment, reflecting ETC's longer operational history and established market presence.
-
Aggressive Investors: A more balanced allocation of T at 40-50% and ETC at 50-60% may align with higher risk tolerance, allowing exposure to both emerging privacy infrastructure and established smart contract platforms.
-
Hedging Instruments: Portfolio risk management may incorporate stablecoin allocations for liquidity preservation, options strategies for downside protection, and cross-asset diversification across multiple cryptocurrency categories.
V. Potential Risk Comparison
Market Risks
-
T: The token faces liquidity considerations with 24-hour trading volume of $39,573.90 as of January 17, 2026. Market depth and trading activity remain developing factors that may impact price discovery and execution.
-
ETC: While maintaining higher trading volumes of $1,583,086.86, ETC experiences market volatility characteristic of cryptocurrency assets. Historical price movements show significant fluctuations between peak and trough levels, reflecting broader market cycle influences.
Technical Risks
-
T: Technical development information and network performance metrics are limited in available materials, presenting information asymmetry considerations for potential investors evaluating long-term technical viability.
-
ETC: The proof-of-work consensus mechanism faces ongoing considerations regarding mining distribution, network hashrate concentration, and potential security considerations inherent to PoW-based networks.
Regulatory Risks
- Regulatory frameworks for cryptocurrency assets continue evolving across jurisdictions. Both T and ETC may face varying degrees of regulatory scrutiny depending on classification determinations, compliance requirements, and jurisdictional policy developments. Privacy-focused technologies and smart contract platforms each present distinct regulatory consideration profiles that may impact future market accessibility and institutional adoption patterns.
VI. Conclusion: Which Is the Better Buy?
📌 Investment Value Summary:
-
T Advantages: Privacy-preserving infrastructure positioning, merger heritage combining NuCypher and Keep Network technologies, relatively lower entry price point with potential for ecosystem-driven appreciation.
-
ETC Advantages: Established operational history since 2016, defined maximum supply of 210.7 million tokens creating scarcity dynamics, proof-of-work consensus mechanism differentiation, institutional recognition through vehicles such as Grayscale ETC Trust, functioning smart contract platform with market presence.
✅ Investment Considerations:
-
Newer Investors: May benefit from understanding fundamental differences between privacy infrastructure tokens and established smart contract platforms. ETC's longer operational history and clearer supply mechanics may provide more accessible entry points for learning cryptocurrency investment dynamics.
-
Experienced Investors: Could consider portfolio allocation strategies incorporating both assets based on individual risk profiles, with attention to liquidity differences, ecosystem development trajectories, and technical positioning within the broader cryptocurrency landscape.
-
Institutional Investors: May evaluate ETC's institutional adoption indicators, regulatory clarity developments, and market infrastructure maturity. T's privacy-focused positioning may warrant assessment within emerging technology allocation frameworks.
⚠️ Risk Disclosure: Cryptocurrency markets exhibit substantial volatility and unpredictability. This analysis does not constitute investment advice, financial recommendations, or solicitation to buy or sell any assets. Investors should conduct independent research, assess personal risk tolerance, and consult qualified financial advisors before making investment decisions.
VII. FAQ
Q1: What is the fundamental difference between T and ETC in terms of their blockchain purpose?
T (Threshold) is a privacy-preserving infrastructure token designed to protect digital assets on public blockchains, while ETC (Ethereum Classic) is an established smart contract platform that maintains the original Ethereum blockchain following the 2016 hard fork. T focuses on privacy technology integration from the merger of NuCypher and Keep Network, whereas ETC prioritizes decentralized smart contract execution under the "code is law" principle with proof-of-work consensus.
Q2: Which token has better liquidity for trading purposes?
ETC demonstrates significantly better liquidity with a 24-hour trading volume of $1,583,086.86 compared to T's $39,573.90 as of January 17, 2026. This substantial difference means ETC offers more efficient price discovery, tighter bid-ask spreads, and easier entry/exit positions for investors. T's lower trading volume may result in higher slippage and potentially more volatile price movements during order execution.
Q3: How does the supply mechanism differ between T and ETC, and why does it matter?
ETC implements a defined maximum supply cap of 210.7 million tokens with periodic block reward halving events, similar to Bitcoin's scarcity model. Currently, 153.9 million tokens (73.05%) are in circulation, with remaining tokens released through mining. This creates supply constraints that historically correlate with price appreciation during halving cycles. T's supply mechanism details are not publicly documented in available materials, making comparative scarcity analysis challenging for investors evaluating long-term value propositions.
Q4: What is the risk-return profile comparison for conservative versus aggressive investors?
For conservative investors, a suggested allocation framework might include 20-30% T and 70-80% ETC within a cryptocurrency portfolio segment, reflecting ETC's established market presence and operational history since 2016. Aggressive investors with higher risk tolerance might consider a more balanced 40-50% T and 50-60% ETC allocation, gaining exposure to both emerging privacy infrastructure and established smart contract platforms. ETC's institutional recognition and longer track record provide relative stability, while T's privacy-focused positioning offers potential appreciation from ecosystem development.
Q5: What are the price forecast ranges for 2026 and long-term outlook through 2031?
For 2026, T's conservative forecast ranges from $0.0065-$0.0102 with an optimistic scenario of $0.0102-$0.0140, while ETC projects a conservative range of $6.65-$12.80 and optimistic range of $12.80-$16.77. By 2031, T's baseline scenario estimates $0.0144-$0.0247 with an optimistic range of $0.0218-$0.0312, representing a 128% change from current levels. ETC's 2031 baseline projects $13.34-$20.67 with an optimistic scenario of $19.14-$20.70, indicating a 55% increase. These projections are based on historical data modeling and may vary significantly due to market volatility, regulatory developments, and unforeseen factors.
Q6: What institutional adoption advantages does ETC have over T?
ETC has garnered institutional support through vehicles such as Grayscale ETC Trust, providing market liquidity and enhanced recognition among traditional financial participants. This institutional backing not only validates ETC's market positioning but also facilitates potential capital inflows from regulated investment channels. Available materials do not document comparable institutional adoption for T, representing an information asymmetry consideration. Institutional presence typically correlates with improved market infrastructure, regulatory engagement, and long-term sustainability indicators that may influence investment decision-making.
Q7: What are the primary regulatory risk differences between T and ETC?
Both assets face evolving regulatory frameworks across jurisdictions, but with distinct profiles. T's privacy-preserving infrastructure may encounter heightened regulatory scrutiny in jurisdictions implementing strict privacy coin regulations or anti-money laundering requirements focused on transaction transparency. ETC, as an established smart contract platform operating since 2016, faces considerations typical of layer-1 blockchain networks, including securities classification determinations and compliance requirements. The proof-of-work consensus mechanism also presents jurisdiction-specific considerations where mining activities face regulatory attention. Investors should monitor regulatory developments in their respective jurisdictions that may impact market accessibility and institutional adoption patterns.
Q8: How should newer investors approach the T vs ETC investment decision?
Newer investors may benefit from ETC's longer operational history, clearer supply mechanics, and established market presence as a more accessible entry point for understanding cryptocurrency investment dynamics. ETC's defined maximum supply of 210.7 million tokens and institutional recognition provide tangible fundamentals for analysis. T's privacy-focused positioning and merger heritage offer potential appreciation opportunities but come with lower liquidity ($39,573.90 vs $1,583,086.86 24-hour volume) and less documented technical development information. Beginning with smaller allocations, conducting thorough independent research, and understanding personal risk tolerance are essential steps before committing capital to either asset.
* The information is not intended to be and does not constitute financial advice or any other recommendation of any sort offered or endorsed by Gate.