This comprehensive analysis compares TA (Trusta.AI) and DOT (Polkadot), two distinct blockchain platforms with divergent market positioning. TA, launched in 2025, focuses on AI-identity infrastructure with current volatility ranging from $0.01652 to $0.3854. DOT, established since 2019, operates as a multi-chain interoperability platform, trading near $1.877. The article examines historical price trends, institutional adoption, technological ecosystems, and market forecasts through 2031. TA projects optimistic scenarios reaching $0.089 by 2031, while DOT targets $3.62. Conservative investors may favor DOT's established track record, while aggressive investors might pursue TA's higher growth potential. All cryptocurrency investments require thorough due diligence, risk management strategies, and independent financial consultation given inherent market volatility and regulatory uncertainties.
Introduction: TA vs DOT Investment Comparison
In the cryptocurrency market, the comparison between TA and DOT has been a topic that investors cannot avoid. The two not only have significant differences in market cap ranking, application scenarios, and price performance, but also represent different positioning of crypto assets.
TA (TA): Since its launch in 2025, it has gained market recognition by focusing on creating a trusted identity network for AI and crypto, establishing a universal credit system for all forms of intelligence.
DOT (DOT): Since its launch in 2019, it has been regarded as a multi-chain interoperability platform, and is one of the cryptocurrencies with significant global trading volume and market presence.
This article will comprehensively analyze the investment value comparison between TA and DOT from the perspectives of historical price trends, supply mechanisms, institutional adoption, technical ecosystems, and future predictions, and attempt to answer the question that investors are most concerned about:
"Which is the better buy right now?"
I. Historical Price Comparison and Market Status
TA (Trusta.AI) and DOT (Polkadot) Historical Price Trends
- 2025: TA experienced notable price fluctuations following its launch, with its all-time high (ATH) recorded at $0.3854 on September 2, 2025, and its all-time low (ATL) reaching $0.01652 on October 10, 2025.
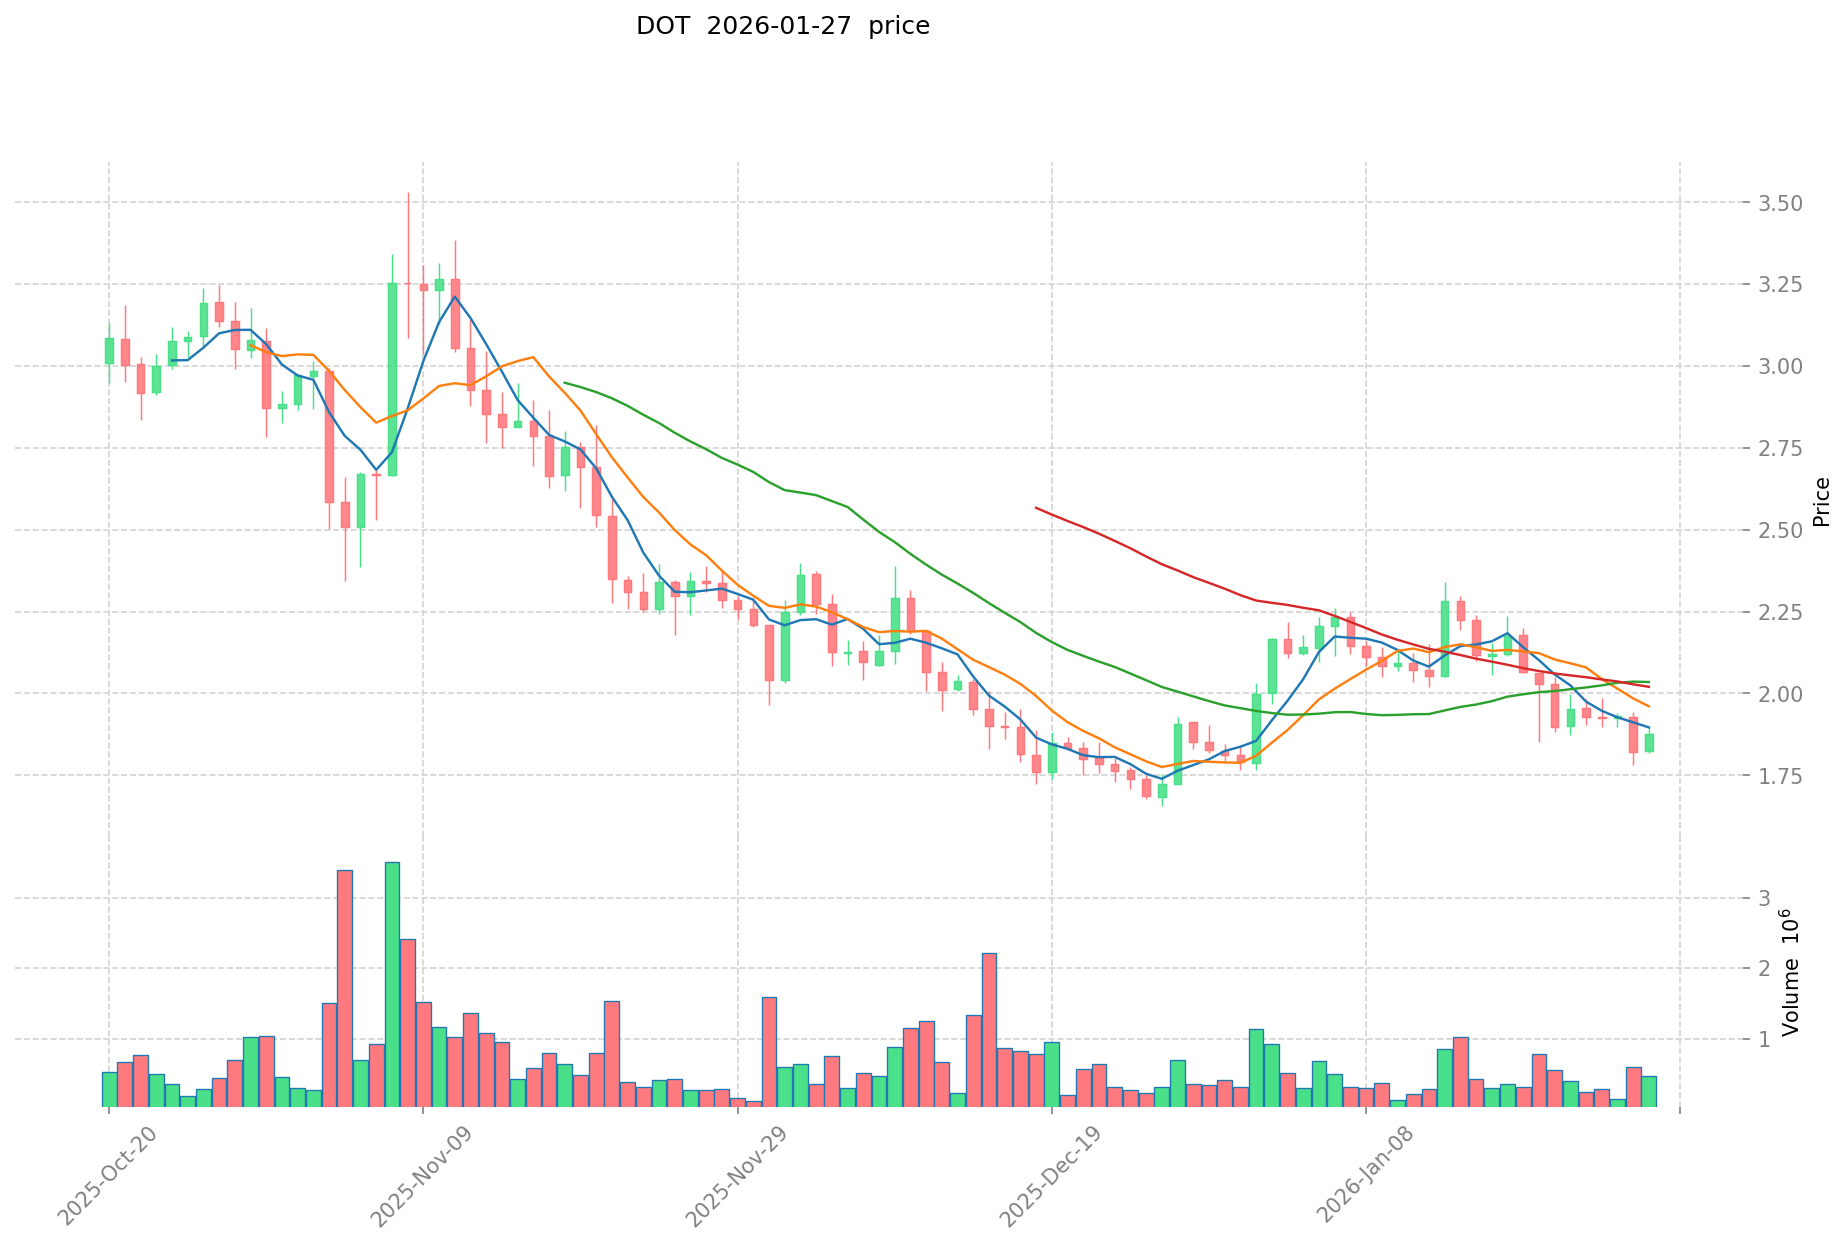
- 2021: DOT was influenced by strong market momentum during the crypto bull market, with its price reaching an ATH of $54.98 on November 4, 2021.
- Comparative Analysis: During different market cycles, TA has shown significant volatility within a relatively short trading history, ranging from $0.01652 to $0.3854. In contrast, DOT demonstrated a broader price range over a longer period, declining from its peak of $54.98 to a recent low of $1.66 recorded on December 26, 2025.
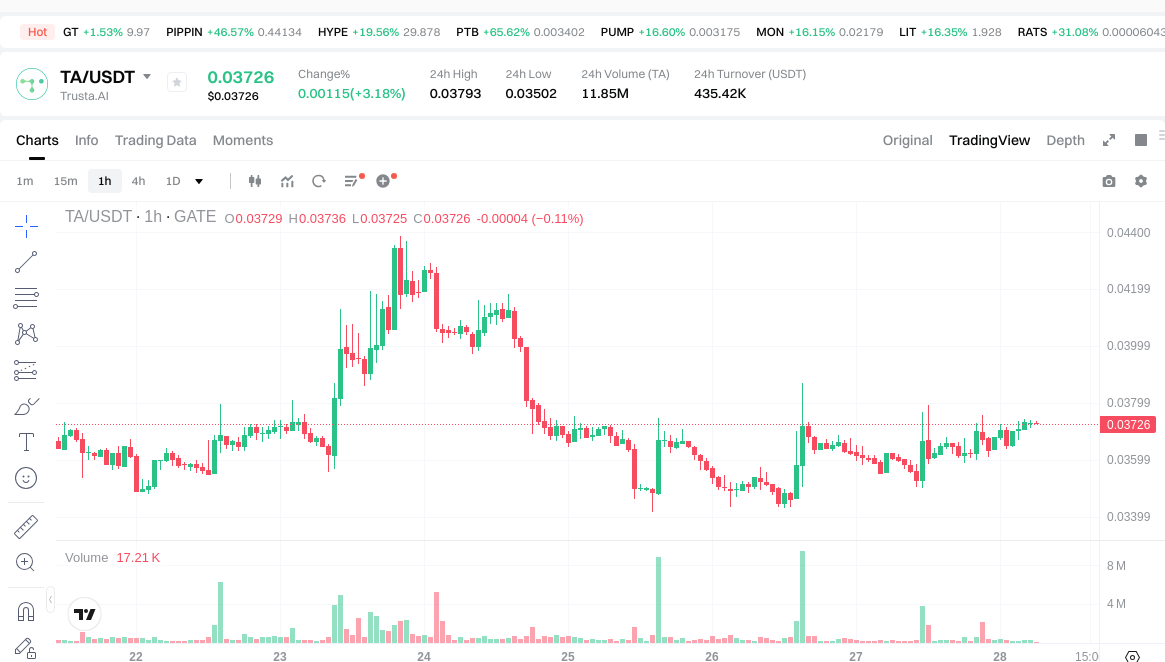
Current Market Situation (January 28, 2026)
- TA Current Price: $0.03735
- DOT Current Price: $1.877
- 24-Hour Trading Volume: TA recorded $437,131.53 compared to DOT's $462,274.28
- Market Sentiment Index (Fear & Greed Index): 29 (Fear)
View real-time prices:
II. Core Factors Influencing TA vs DOT Investment Value
Supply Mechanism Comparison (Tokenomics)
Due to the absence of specific information regarding TA and DOT's supply mechanisms in the provided materials, a detailed comparison cannot be presented. Generally, tokenomics frameworks encompass elements such as total supply caps, emission schedules, and deflationary mechanisms. These structural components tend to influence price dynamics through scarcity principles and market expectations.
- 📌 Historical Pattern: Supply mechanisms have historically influenced price cycles through anticipated scarcity events and programmed emission reductions, though specific patterns vary by asset design.
Institutional Adoption and Market Application
- Institutional Holdings: The reference materials do not contain data on institutional preference between TA and DOT.
- Enterprise Adoption: Information regarding TA or DOT's application in cross-border payments, settlement systems, or investment portfolios is not available in the provided sources.
- National Policy: Regulatory stances toward these specific assets across different jurisdictions are not documented in the materials.
Technology Development and Ecosystem Construction
- TA Technology Upgrades: Specific technical developments and their potential impacts are not detailed in the available information.
- DOT Technology Development: Similarly, concrete information about DOT's technological progression is not present in the reference materials.
- Ecosystem Comparison: Data comparing DeFi integration, NFT implementations, payment infrastructure, or smart contract deployment between TA and DOT is not available.
Macroeconomic Environment and Market Cycles
- Performance in Inflationary Environments: The comparative anti-inflation characteristics of TA versus DOT are not addressed in the provided materials.
- Macroeconomic Monetary Policy: The reference materials note that factors such as interest rates and currency dynamics influence investment environments broadly, though specific impacts on TA and DOT are not documented. As mentioned in the materials, company profitability and cash flow conditions affect payment capacity during economic fluctuations.
- Geopolitical Factors: While the materials acknowledge that cross-border transaction demand and international situations affect investment landscapes, specific implications for TA and DOT are not elaborated.
III. 2026-2031 Price Forecast: TA vs DOT
Short-term Forecast (2026)
- TA: Conservative $0.019-$0.037 | Optimistic $0.037-$0.047
- DOT: Conservative $1.80-$2.43 | Optimistic $1.88-$2.50
Medium-term Forecast (2028-2029)
- TA may enter a consolidation phase with projected price range of $0.032-$0.073
- DOT may enter a growth phase with projected price range of $1.48-$3.07
- Key drivers: institutional capital inflows, ETF developments, ecosystem expansion
Long-term Forecast (2030-2031)
- TA: Base scenario $0.043-$0.078 | Optimistic scenario $0.052-$0.089
- DOT: Base scenario $1.85-$2.92 | Optimistic scenario $2.69-$3.62
View detailed price predictions for TA and DOT
Disclaimer
TA:
| Year |
Predicted High Price |
Predicted Average Price |
Predicted Low Price |
Price Change |
| 2026 |
0.0473202 |
0.03726 |
0.0190026 |
0 |
| 2027 |
0.05920614 |
0.0422901 |
0.027065664 |
13 |
| 2028 |
0.0730772928 |
0.05074812 |
0.0416134584 |
35 |
| 2029 |
0.071818739424 |
0.0619127064 |
0.031575480264 |
65 |
| 2030 |
0.08893141147296 |
0.066865722912 |
0.04279406266368 |
79 |
| 2031 |
0.086467409583652 |
0.07789856719248 |
0.052192040018961 |
108 |
DOT:
| Year |
Predicted High Price |
Predicted Average Price |
Predicted Low Price |
Price Change |
| 2026 |
2.49774 |
1.878 |
1.80288 |
0 |
| 2027 |
2.4285357 |
2.18787 |
1.969083 |
16 |
| 2028 |
3.0699097905 |
2.30820285 |
1.477249824 |
22 |
| 2029 |
2.90418082587 |
2.68905632025 |
2.527712941035 |
43 |
| 2030 |
3.0483142446354 |
2.79661857306 |
1.8457682582196 |
48 |
| 2031 |
3.623858346971148 |
2.9224664088477 |
2.688669096139884 |
55 |
IV. Investment Strategy Comparison: TA vs DOT
Long-term vs Short-term Investment Strategies
- TA: May appeal to investors interested in emerging AI-identity infrastructure projects with tolerance for higher volatility, given its relatively recent market entry and developing ecosystem.
- DOT: May suit investors seeking exposure to established multi-chain interoperability platforms with longer operational track records in the cryptocurrency market.
Risk Management and Asset Allocation
- Conservative Investors: A balanced approach might consider limited exposure to both assets as part of a diversified portfolio, with smaller allocations given the inherent volatility of cryptocurrency markets.
- Aggressive Investors: Those with higher risk tolerance may explore varied allocation strategies based on individual research and risk assessment.
- Hedging Tools: Portfolio diversification techniques may include stablecoin positions, options strategies where available, and cross-asset combinations to manage volatility exposure.
V. Potential Risk Comparison
Market Risks
- TA: The asset has demonstrated considerable price fluctuations within its trading history, ranging from $0.01652 to $0.3854, which reflects substantial volatility characteristics common to newer market entrants.
- DOT: Has experienced significant price movements across market cycles, declining from its 2021 peak of $54.98 to lower levels, indicating sensitivity to broader cryptocurrency market conditions.
Technical Risks
- TA: As with emerging cryptocurrency projects, considerations around network scalability, infrastructure maturity, and ecosystem development apply.
- DOT: Technical considerations for established platforms include ongoing development requirements, network maintenance, and ecosystem evolution challenges.
Regulatory Risks
- Cryptocurrency assets face evolving regulatory frameworks across different jurisdictions, which may impact both TA and DOT differently depending on their specific use cases, geographic presence, and regulatory classifications. Regulatory developments remain an important consideration for cryptocurrency investments broadly.
VI. Conclusion: Which Is the Better Buy?
📌 Investment Value Summary:
- TA Characteristics: Represents exposure to AI-identity infrastructure development with a relatively short market history and significant price volatility patterns.
- DOT Characteristics: Offers participation in an established multi-chain interoperability platform with longer operational history and broader market recognition.
✅ Investment Considerations:
- Novice Investors: Should prioritize comprehensive research, understand cryptocurrency market volatility, and consider starting with limited exposure while building knowledge of market dynamics.
- Experienced Investors: May evaluate both assets based on individual investment theses, risk tolerance, and portfolio diversification strategies, informed by thorough technical and fundamental analysis.
- Institutional Investors: Should conduct extensive due diligence aligned with institutional risk management frameworks and regulatory compliance requirements.
⚠️ Risk Disclosure: Cryptocurrency markets exhibit extreme volatility. This content does not constitute investment advice. Investors should conduct independent research and consult qualified financial advisors before making investment decisions.
VII. FAQ
Q1: What are the key differences between TA and DOT in terms of market positioning?
TA (Trusta.AI) focuses on creating a trusted identity network for AI and crypto, establishing a universal credit system for all forms of intelligence since its 2025 launch. DOT (Polkadot), launched in 2019, positions itself as a multi-chain interoperability platform with established global trading presence. The fundamental difference lies in TA's specialized AI-identity infrastructure versus DOT's broad multi-chain connectivity framework, reflecting divergent technological priorities and use case applications.
Q2: How do the price volatility patterns compare between TA and DOT?
TA has demonstrated substantial volatility within its short trading history, ranging from an all-time low of $0.01652 (October 10, 2025) to an all-time high of $0.3854 (September 2, 2025). DOT exhibits volatility across a longer timeframe, declining from its peak of $54.98 (November 4, 2021) to a low of $1.66 (December 26, 2025). TA's price movements show higher percentage fluctuations within compressed timeframes, characteristic of newer market entrants, while DOT's volatility reflects multi-year market cycle dynamics.
Q3: What is the current market sentiment affecting both TA and DOT?
As of January 28, 2026, the market sentiment index (Fear & Greed Index) stands at 29, indicating a "Fear" environment. Under these conditions, TA trades at $0.03735 with 24-hour volume of $437,131.53, while DOT trades at $1.877 with volume of $462,274.28. This fearful sentiment typically influences both assets, though their responses may differ based on their respective market capitalizations, liquidity profiles, and investor bases.
Q4: What are the projected price ranges for TA and DOT through 2031?
For TA, short-term 2026 forecasts range from $0.019-$0.037 (conservative) to $0.037-$0.047 (optimistic), with long-term 2031 projections between $0.052-$0.089 in optimistic scenarios. DOT's 2026 forecasts span $1.80-$2.43 (conservative) to $1.88-$2.50 (optimistic), with 2031 optimistic projections reaching $2.69-$3.62. These forecasts reflect different growth trajectories, with TA showing higher percentage growth potential from its lower base, while DOT demonstrates more moderate expansion from established levels.
Q5: Which asset is more suitable for conservative versus aggressive investors?
Conservative investors may consider limited exposure to DOT given its longer operational track record and established multi-chain platform status, though cryptocurrency volatility remains inherent. Aggressive investors with higher risk tolerance might explore TA for exposure to emerging AI-identity infrastructure, accepting greater volatility in exchange for potential growth opportunities. Both approaches should incorporate proper portfolio diversification, including stablecoin positions and risk management strategies appropriate to individual circumstances.
Q6: What are the primary risk factors investors should consider for each asset?
TA's primary risks include substantial price volatility (ranging 95.7% from low to high), limited trading history, and challenges associated with emerging ecosystem development. DOT's risks encompass significant historical price corrections (down 97% from peak), exposure to multi-year market cycles, and ongoing technical development requirements. Both assets face regulatory uncertainty as cryptocurrency frameworks evolve globally, though impacts may vary based on their specific use cases and jurisdictions of operation.
Q7: How should novice investors approach the TA versus DOT decision?
Novice investors should prioritize comprehensive research and education over immediate investment decisions. Beginning with understanding cryptocurrency market fundamentals, blockchain technology basics, and volatility characteristics is essential. Starting with limited capital exposure while building knowledge, utilizing educational resources, and potentially consulting qualified financial advisors represents a prudent approach. Neither TA nor DOT should constitute a significant portfolio allocation until investors thoroughly understand the risks, technology, and market dynamics underlying each asset.
* The information is not intended to be and does not constitute financial advice or any other recommendation of any sort offered or endorsed by Gate.