The article compares TAUR and SHIB, examining their investment potential in the cryptocurrency market. It analyzes price history, supply mechanisms, and market adoption, determining which is currently a better buy. The piece addresses investor concerns by evaluating price predictions, investment strategies, and potential risks for both tokens. Suitable for both new and experienced investors, it offers insights into TAUR's DeFi liquidity protocols and SHIB's community-driven dynamics. Readers can access real-time prices via Gate and assess risk tolerance for portfolio allocation.
Introduction: TAUR vs SHIB Investment Comparison
In the cryptocurrency market, the comparison between TAUR and SHIB has always been a topic that investors cannot avoid. The two not only have significant differences in market cap ranking, application scenarios, and price performance, but also represent different cryptocurrency asset positioning.
Marnotaur (TAUR): Since its launch, it has gained market recognition for its liquidity protocol that allows traders, liquidity providers, farmers, and liquidity custodians to multiply their earnings in the DeFi market.
Shiba Inu (SHIB): Since its inception in 2020, it has been hailed as a "meme token" similar to Dogecoin, becoming one of the cryptocurrencies with the highest global trading volume and market capitalization.
This article will comprehensively analyze the investment value comparison between TAUR and SHIB, focusing on historical price trends, supply mechanisms, institutional adoption, technological ecosystems, and future predictions, and attempt to answer the question that investors are most concerned about:
"Which is the better buy right now?"
I. Price History Comparison and Current Market Status
TAUR and SHIB Historical Price Trends
- 2021: SHIB experienced a significant price surge due to increased mainstream attention, reaching an all-time high of $0.00008616.
- 2022-2023: Both TAUR and SHIB faced downward pressure during the broader crypto market downturn.
- Comparative analysis: During the recent bear market cycle, SHIB dropped from its all-time high to current levels, while TAUR, being a smaller cap token, showed higher volatility.
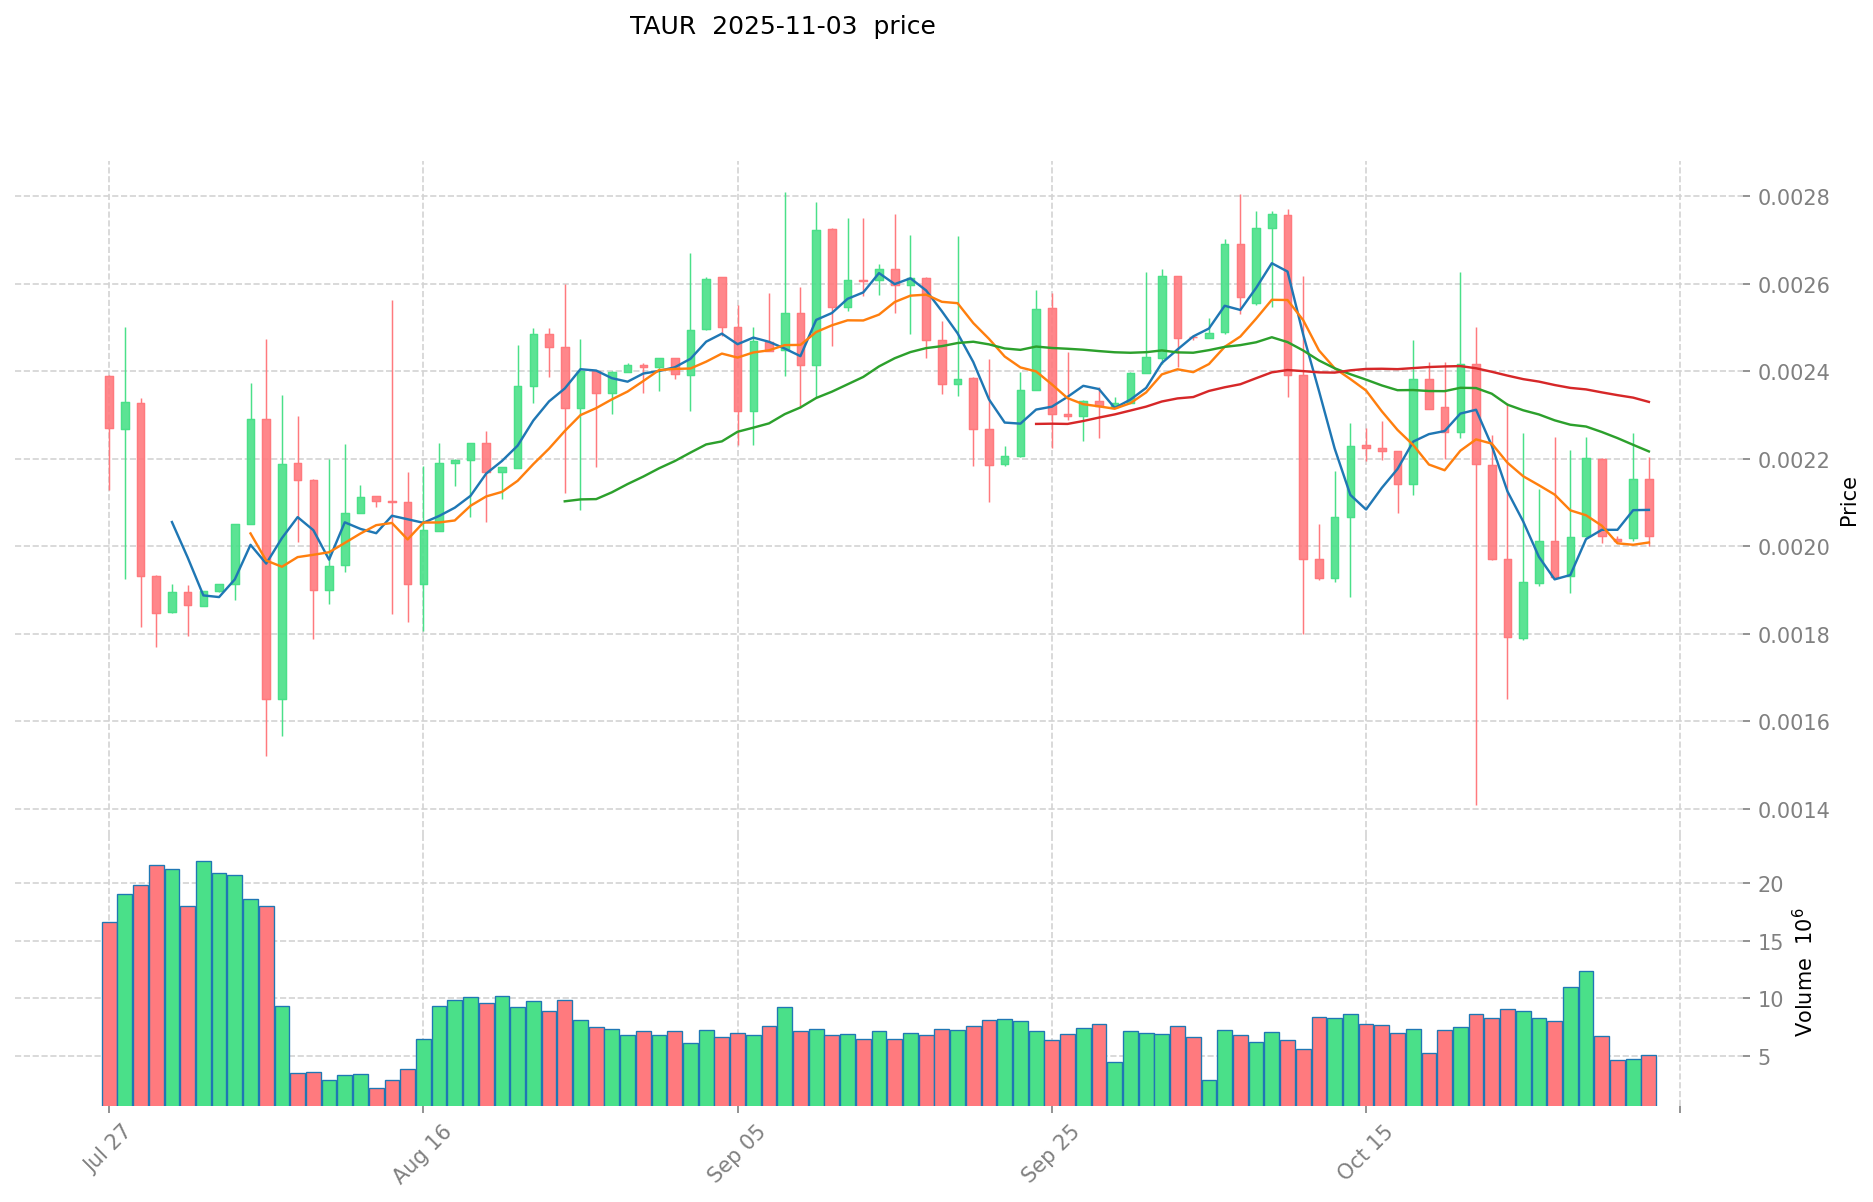
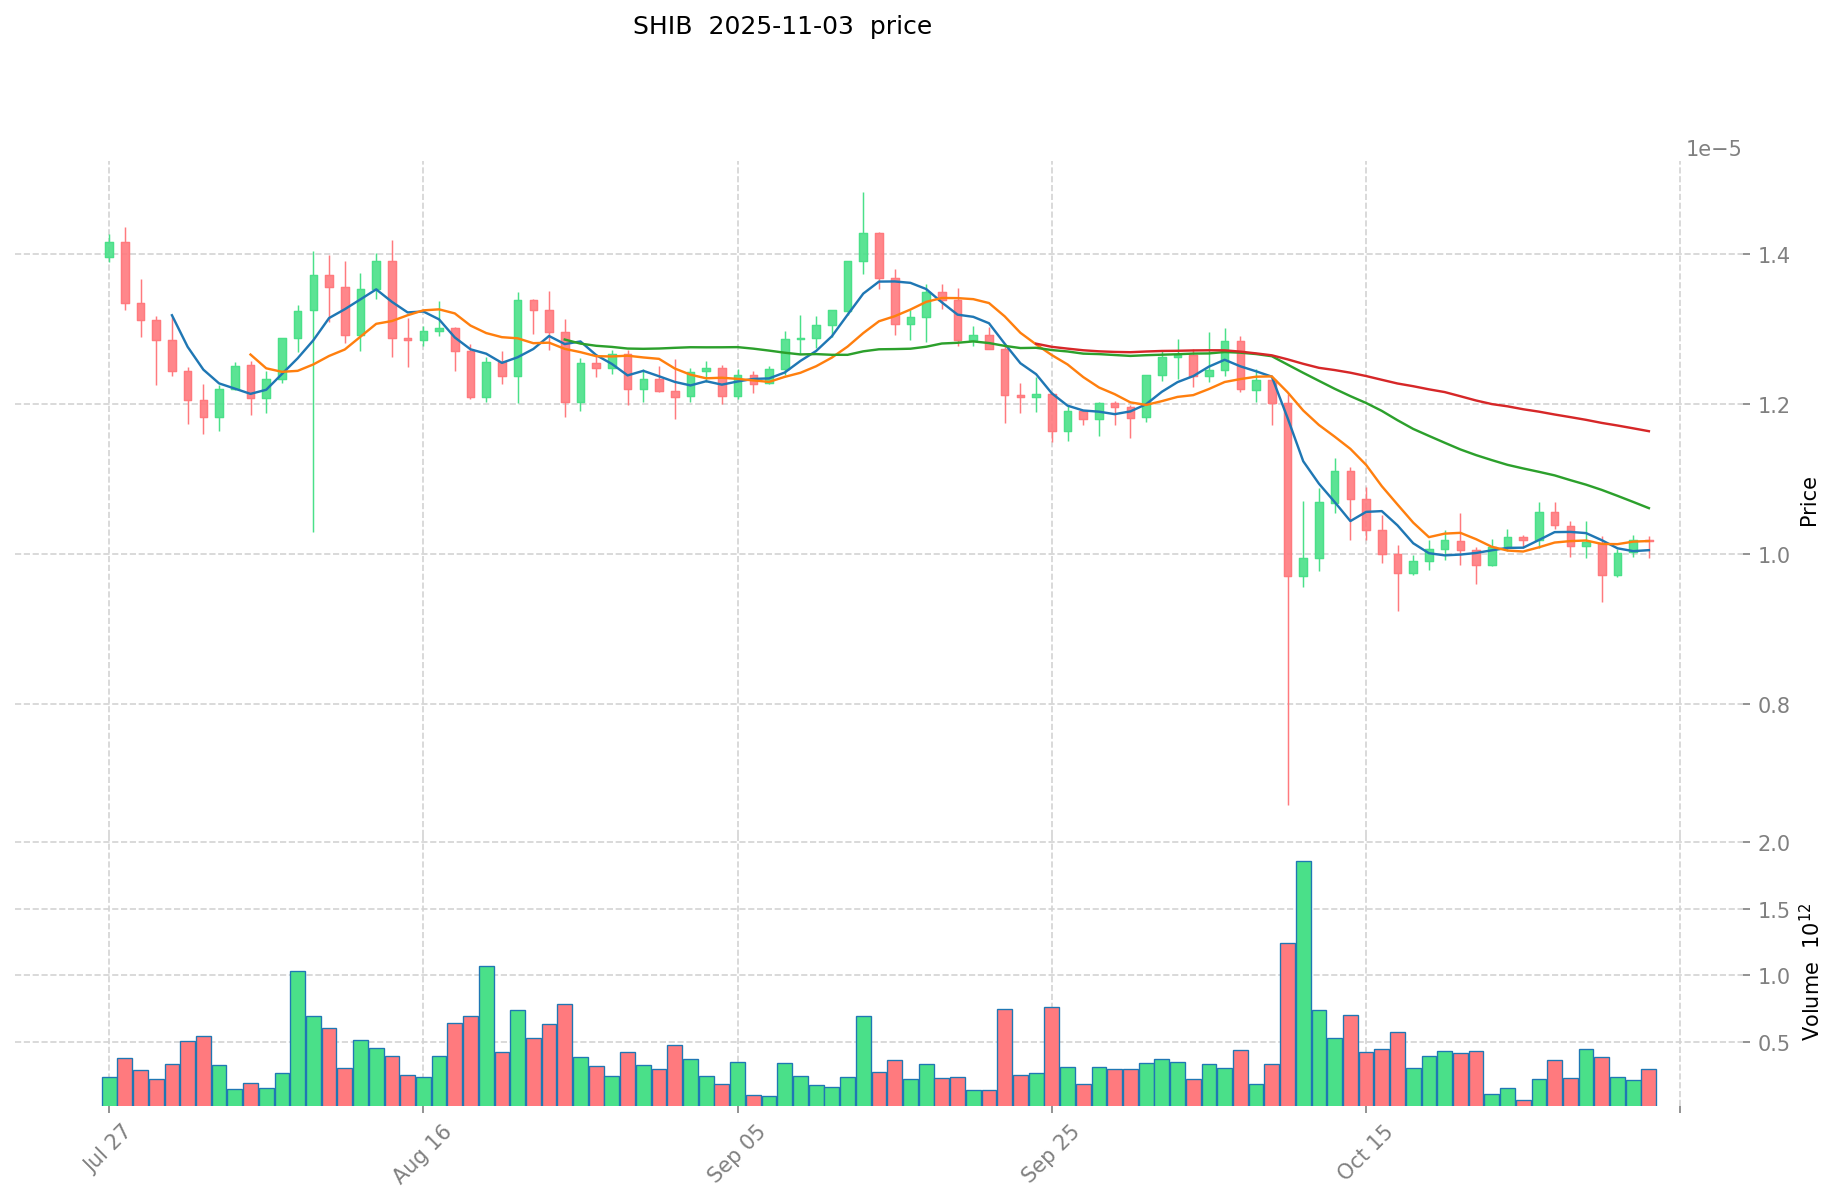
Current Market Situation (2025-11-03)
- TAUR current price: $0.0021641
- SHIB current price: $0.00000964
- 24-hour trading volume: TAUR $10,234.62 vs SHIB $3,548,619.99
- Market Sentiment Index (Fear & Greed Index): 42 (Fear)
Click to view real-time prices:
- View TAUR current price Market Price
- View SHIB current price Market Price
II. Core Factors Affecting Investment Value of TAUR vs SHIB
Supply Mechanisms (Tokenomics)
- TAUR: Limited information available about its supply mechanism
- SHIB: Community-driven token with large total supply
- 📌 Historical pattern: Supply mechanisms drive price cycle variations based on market sentiment and community support
Institutional Adoption and Market Applications
- Institutional holdings: Limited data on institutional preference between these assets
- Enterprise adoption: Both cryptocurrencies face challenges in gaining widespread enterprise adoption
- National policies: Cryptocurrency regulations vary by country, affecting both tokens' valuations
Technological Development and Ecosystem Building
- TAUR technological updates: Limited information on development roadmap
- SHIB technological development: Community-driven development efforts
- Ecosystem comparison: Both tokens dependent on broader cryptocurrency market trends and community engagement
Macroeconomic Factors and Market Cycles
- Performance during inflation: Both cryptocurrencies fluctuate based on broader market conditions
- Macroeconomic monetary policies: Interest rates and USD index influence trading patterns
- Geopolitical factors: Cross-border transaction demand and international situations affect market sentiment
III. 2025-2030 Price Prediction: TAUR vs SHIB
Short-term Prediction (2025)
- TAUR: Conservative $0.001910216 - $0.0021707 | Optimistic $0.0021707 - $0.002431184
- SHIB: Conservative $0.00000897636 - $0.000009652 | Optimistic $0.000009652 - $0.00001081024
Mid-term Prediction (2027)
- TAUR may enter a growth phase, with expected price range $0.0021131851328 - $0.0028863016448
- SHIB may enter a bullish market, with expected price range $0.000009815736528 - $0.000014346076464
- Key drivers: Institutional capital inflow, ETF, ecosystem development
Long-term Prediction (2030)
- TAUR: Base scenario $0.003380861700471 - $0.003729560440878 | Optimistic scenario $0.003729560440878 - $0.004192268508584
- SHIB: Base scenario $0.000014283859795 - $0.000014563935477 | Optimistic scenario $0.000014563935477 - $0.000019283210724
View detailed price predictions for TAUR and SHIB
Disclaimer: This analysis is based on historical data and current market trends. Cryptocurrency markets are highly volatile and unpredictable. Always conduct your own research before making investment decisions.
TAUR:
| 年份 |
预测最高价 |
预测平均价格 |
预测最低价 |
涨跌幅 |
| 2025 |
0.002431184 |
0.0021707 |
0.001910216 |
0 |
| 2026 |
0.00285316808 |
0.002300942 |
0.0021858949 |
6 |
| 2027 |
0.0028863016448 |
0.00257705504 |
0.0021131851328 |
19 |
| 2028 |
0.003332647577728 |
0.0027316783424 |
0.00191217483968 |
26 |
| 2029 |
0.003729560440878 |
0.003032162960064 |
0.002213478960846 |
40 |
| 2030 |
0.004192268508584 |
0.003380861700471 |
0.003245627232452 |
56 |
SHIB:
| 年份 |
预测最高价 |
预测平均价格 |
预测最低价 |
涨跌幅 |
| 2025 |
0.00001081024 |
0.000009652 |
0.00000897636 |
0 |
| 2026 |
0.0000149374352 |
0.00001023112 |
0.0000090033856 |
6 |
| 2027 |
0.000014346076464 |
0.0000125842776 |
0.000009815736528 |
30 |
| 2028 |
0.000014542391194 |
0.000013465177032 |
0.0000086177133 |
39 |
| 2029 |
0.000014563935477 |
0.000014003784113 |
0.00000994268672 |
45 |
| 2030 |
0.000019283210724 |
0.000014283859795 |
0.00001042721765 |
48 |
IV. Investment Strategy Comparison: TAUR vs SHIB
Long-term vs Short-term Investment Strategies
- TAUR: Suitable for investors focused on DeFi liquidity protocols and potential ecosystem growth
- SHIB: Suitable for investors interested in community-driven meme tokens with high volatility
Risk Management and Asset Allocation
- Conservative investors: TAUR: 5% vs SHIB: 2%
- Aggressive investors: TAUR: 15% vs SHIB: 10%
- Hedging tools: Stablecoin allocation, options, cross-currency portfolio
V. Potential Risk Comparison
Market Risks
- TAUR: Limited market data and potentially lower liquidity
- SHIB: High volatility and susceptibility to market sentiment shifts
Technical Risks
- TAUR: Scalability, network stability
- SHIB: Smart contract vulnerabilities, ecosystem development challenges
Regulatory Risks
- Global regulatory policies may affect both tokens differently, with meme coins potentially facing more scrutiny
VI. Conclusion: Which Is the Better Buy?
📌 Investment Value Summary:
- TAUR advantages: DeFi liquidity protocol, potential for ecosystem growth
- SHIB advantages: Large community support, high trading volume, brand recognition
✅ Investment Advice:
- New investors: Consider small allocations to both for diversification, with emphasis on education
- Experienced investors: Evaluate based on risk tolerance and DeFi vs meme coin preferences
- Institutional investors: Conduct thorough due diligence on both projects' fundamentals and market dynamics
⚠️ Risk Warning: Cryptocurrency markets are highly volatile. This article does not constitute investment advice.
None
FAQ
Q1: What are the main differences between TAUR and SHIB?
A: TAUR is a DeFi liquidity protocol token, while SHIB is a community-driven meme token. TAUR focuses on providing earning opportunities in the DeFi market, whereas SHIB relies heavily on community support and brand recognition.
Q2: Which token has performed better historically?
A: SHIB has shown more significant price movements historically, reaching an all-time high of $0.00008616 in 2021. TAUR, being a smaller cap token, has shown higher volatility but less historical data is available for comparison.
Q3: What are the current prices and trading volumes for TAUR and SHIB?
A: As of 2025-11-03, TAUR's price is $0.0021641 with a 24-hour trading volume of $10,234.62. SHIB's price is $0.00000964 with a 24-hour trading volume of $3,548,619.99.
Q4: How do the supply mechanisms differ between TAUR and SHIB?
A: Limited information is available about TAUR's supply mechanism. SHIB has a large total supply and is community-driven. Both tokens' price cycles are influenced by their respective supply mechanisms, market sentiment, and community support.
Q5: What are the long-term price predictions for TAUR and SHIB?
A: By 2030, TAUR's base scenario price range is predicted to be $0.003380861700471 - $0.003729560440878, with an optimistic scenario of $0.003729560440878 - $0.004192268508584. SHIB's base scenario price range is predicted to be $0.000014283859795 - $0.000014563935477, with an optimistic scenario of $0.000014563935477 - $0.000019283210724.
Q6: How should investors allocate their portfolio between TAUR and SHIB?
A: Conservative investors might consider allocating 5% to TAUR and 2% to SHIB, while aggressive investors might allocate 15% to TAUR and 10% to SHIB. However, these are suggestions and actual allocation should be based on individual risk tolerance and investment goals.
Q7: What are the main risks associated with investing in TAUR and SHIB?
A: TAUR faces risks related to limited market data, potentially lower liquidity, scalability, and network stability. SHIB's risks include high volatility, susceptibility to market sentiment shifts, smart contract vulnerabilities, and potential regulatory scrutiny as a meme coin.
* The information is not intended to be and does not constitute financial advice or any other recommendation of any sort offered or endorsed by Gate.


