This comprehensive analysis compares TBC and DYDX, two distinct digital assets serving different market functions. TBC, a Bitcoin Virtual Machine infrastructure project launched in February 2024, offers Bitcoin scalability solutions with historical price volatility ranging from $2 to $19.8. DYDX, an established decentralized derivatives trading protocol since August 2021, provides governance utility with controlled tokenomics featuring 2% inflation cap and fee-based buybacks. The article evaluates both assets across multiple dimensions including historical price performance, supply mechanisms, institutional adoption, technical development, and 2026-2031 price forecasts. DYDX demonstrates greater operational maturity through partnerships with StarkWare and daily trading volumes exceeding $200 million, while TBC represents emerging infrastructure with higher volatility potential. The analysis provides tailored allocation strategies for conservative, aggressive, and institutional investors, comprehensive risk as
Introduction: Investment Comparison Between TBC and DYDX
In the cryptocurrency market, the comparison between TBC vs DYDX remains a topic of continuous interest among investors. The two assets exhibit notable differences in market capitalization ranking, application scenarios, and price performance, representing distinct positions within the crypto asset landscape.
TBC (TuringBitChain): Launched in February 2024, TBC has gained market recognition as a pioneer of the Bitcoin Virtual Machine (BVM), positioning itself as a scalable BTC smart contract layer solution aimed at unlocking Bitcoin's full potential.
DYDX (dYdX): Since its launch in August 2021, DYDX has established itself as a governance token for a decentralized derivatives trading protocol, operating on Layer 2 infrastructure while providing spot, leverage, and lending services.
This article will comprehensively analyze the investment value comparison between TBC vs DYDX across historical price trends, supply mechanisms, institutional adoption, technical ecosystem, and future projections, attempting to address the question most relevant to investors:
"Which is the better buy right now?"
I. Historical Price Comparison and Current Market Status
TBC and DYDX Historical Price Trends
- September 2025: TBC reached a notable price point of $19.8, representing a significant milestone in its trading history.
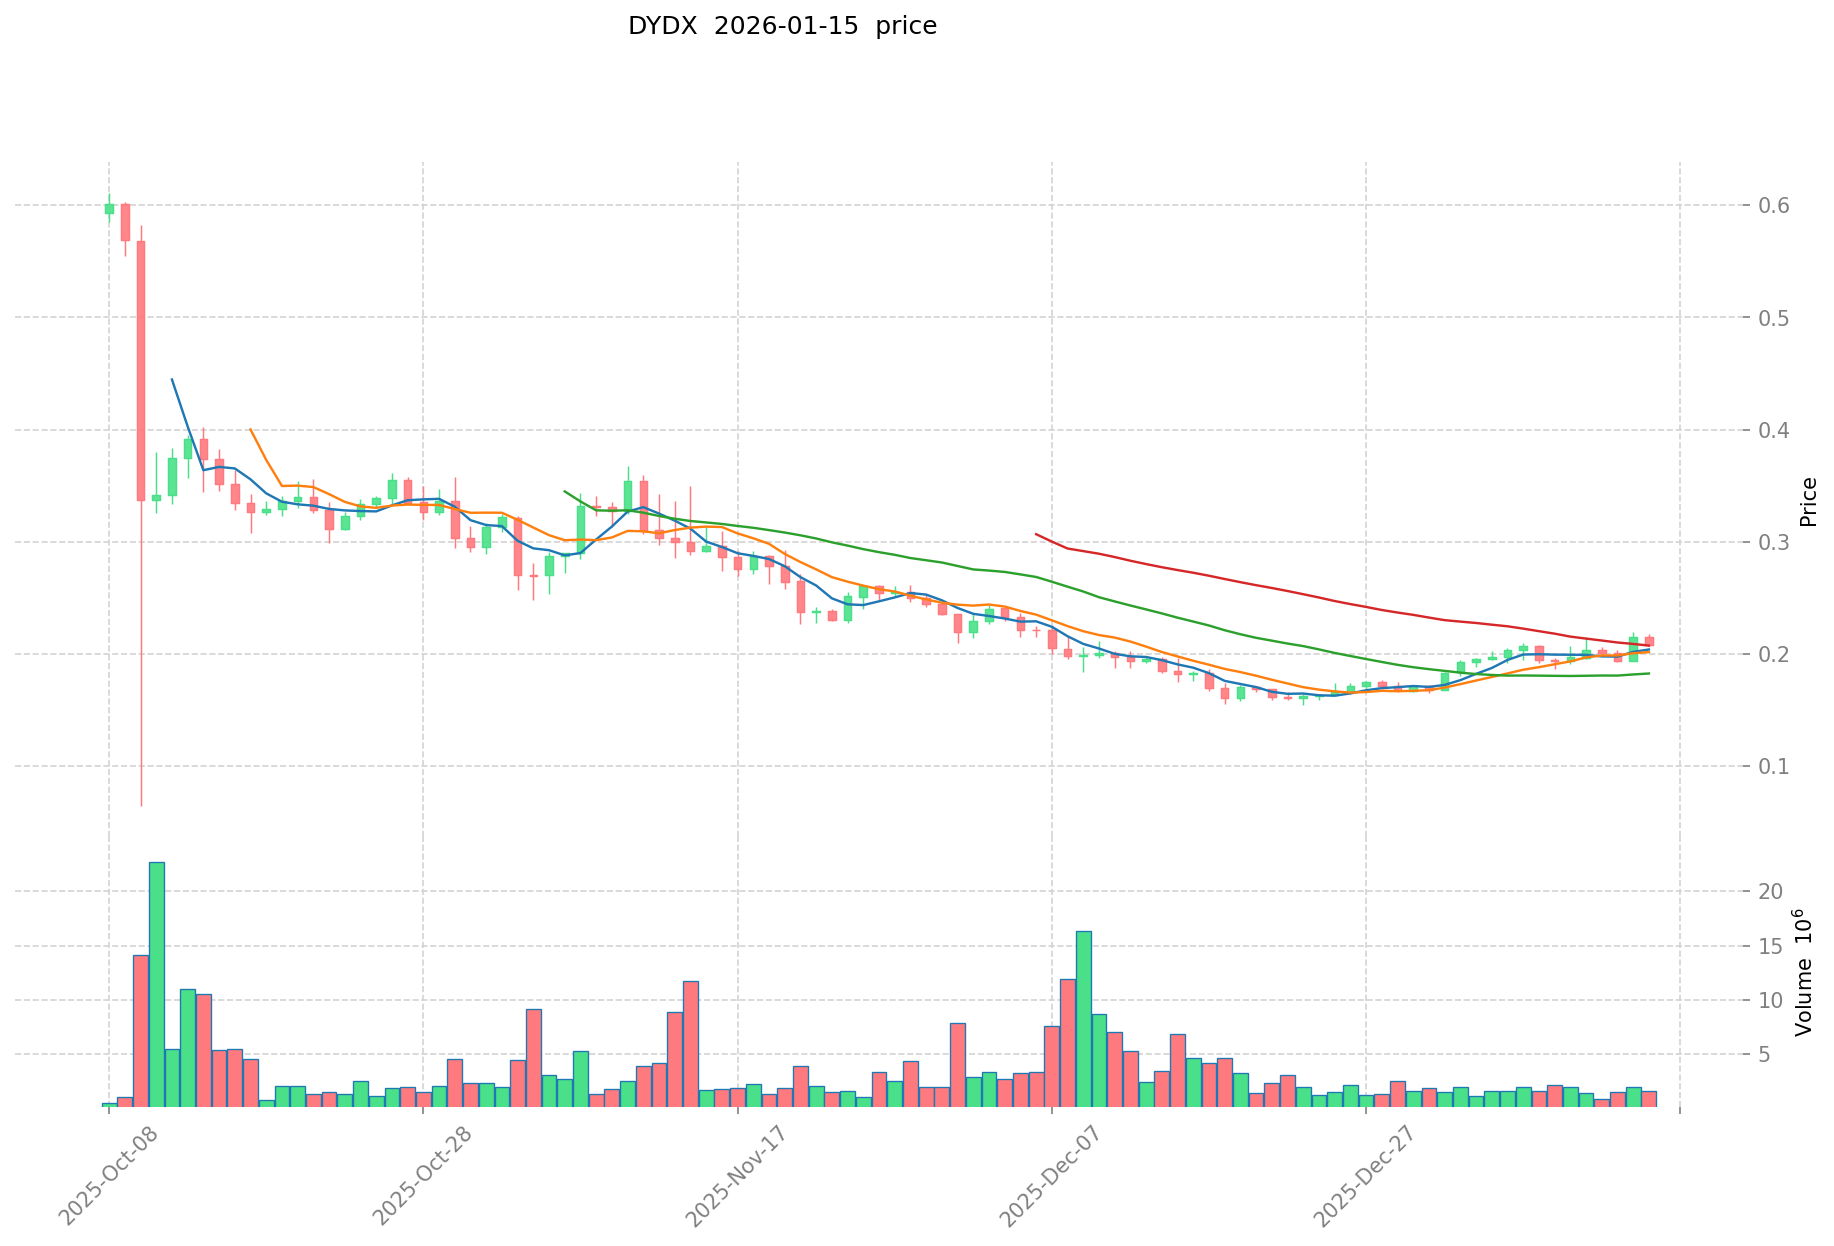
- March 2024: DYDX experienced a price peak at $4.52, marking an important phase in its market performance.
- July 2025: TBC recorded its historical low at $2, while DYDX reached its historical low at $0.126201 in October 2025.
- Comparative analysis: During the recent market cycle, TBC has shown considerable volatility with prices ranging from $2 to $19.8, while DYDX has fluctuated between $0.126201 and $4.52, demonstrating different market dynamics and investor sentiment patterns.
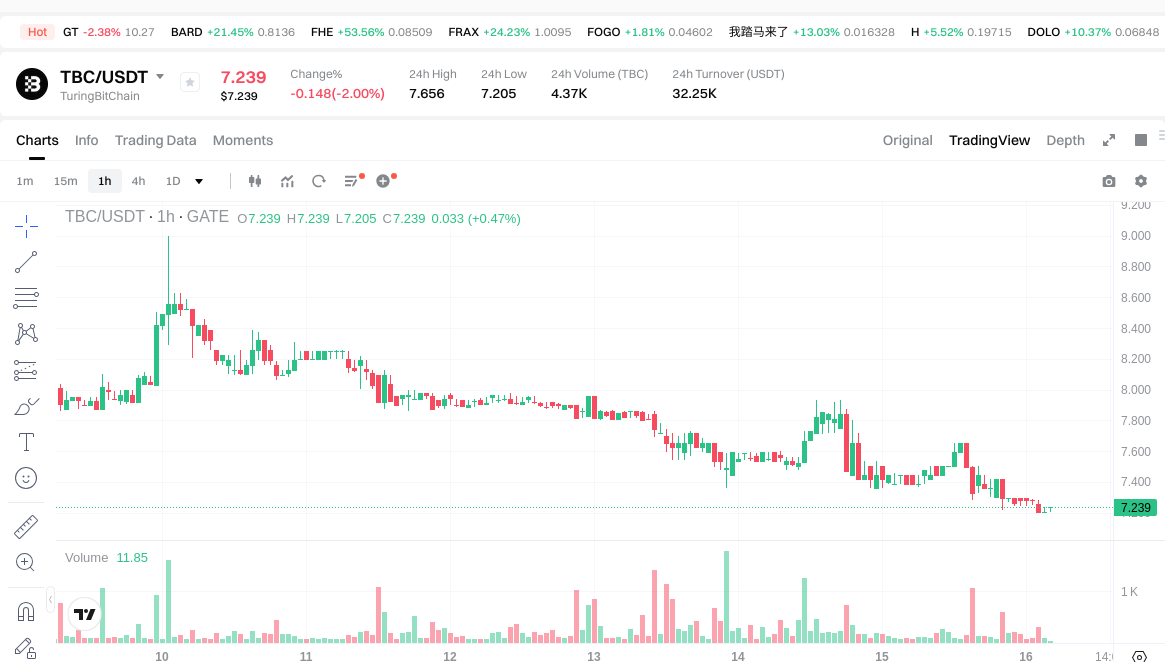
Current Market Status (January 16, 2026)
- TBC current price: $7.205
- DYDX current price: $0.1942
- 24-hour trading volume: TBC $32,276.69 vs DYDX $376,915.33
- 24-hour price change: TBC -2% vs DYDX -7.68%
- Market capitalization: TBC $200.30 million vs DYDX $159.29 million
- Market sentiment index (Fear & Greed Index): 61 (Greed)
View real-time prices:
II. Core Factors Influencing TBC vs DYDX Investment Value
Supply Mechanism Comparison (Tokenomics)
-
DYDX: Operates with a maximum supply of 1 billion tokens and maintains a permanent inflation cap of 2%, which helps mitigate dilution risks. The circulating supply stands at approximately 820 million tokens, representing an 82% circulation ratio. The protocol implements a buyback mechanism utilizing 25-75% of fees to repurchase tokens, potentially reducing supply during periods of volatility.
-
TBC: Information regarding supply mechanisms was not available in the provided materials.
-
📌 Historical Pattern: DYDX's supply management framework, combined with its buyback program, has contributed to supply discipline during market fluctuations. The token experienced notable volatility, reaching a peak of $4.52 in March 2024 before declining.
Institutional Adoption and Market Application
-
Institutional Holdings: DYDX has demonstrated institutional appeal through partnerships with StarkWare and support mechanisms that facilitated capital efficiency improvements. The platform's open interest reached approximately $175-200 million by Q3 2025.
-
Enterprise Adoption: DYDX functions as a decentralized exchange (DEX) specializing in perpetual futures and margin trading, with daily on-chain trading volumes exceeding $200 million. The platform is accessible across over 20 trading platforms, facilitating institutional and retail participation. TBC operates in infrastructure development, though specific enterprise applications in the financial sector were not detailed in available materials.
-
Regulatory Environment: DYDX operates within the DeFi regulatory landscape, emphasizing non-custodial trading and decentralized governance. Specific regulatory positions toward TBC were not addressed in the materials.
Technology Development and Ecosystem Building
-
DYDX Technology Upgrades: The platform launched dYdX Chain v4 in 2023, built on Cosmos SDK with CometBFT consensus for enhanced scalability. This evolution from Ethereum Layer 2 (StarkEx ZK-rollups) addresses gas fee concerns and speed limitations. The infrastructure combines Layer 1 sovereignty with off-chain order books for efficiency while maintaining on-chain settlement security.
-
TBC Technology Development: Information regarding specific technology upgrades and development roadmap was not provided in the materials.
-
Ecosystem Comparison: DYDX demonstrates development across DeFi applications, with governance mechanisms enabling DYDX holders to influence protocol upgrades, fee structures, and risk parameters. The platform features staking pools for security and liquidity provision, with rewards distributed in USDC and DYDX. A community treasury (5% of initial supply) funds governance initiatives, hackathons, and NFT projects. Recent initiatives include spot trading expansion and Telegram integration. Information regarding TBC's position in DeFi, NFT, payment systems, or smart contract deployment was not available.
Macroeconomic Environment and Market Cycles
-
Performance in Inflationary Environment: DYDX's controlled supply mechanism with its 2% inflation cap and buyback program may provide certain structural characteristics during inflationary periods. Comparative analysis with TBC regarding inflation-resistant properties cannot be conducted due to insufficient data.
-
Macroeconomic Monetary Policy: DYDX's performance has been influenced by broader market pressures, experiencing a 91.33% decline in 2024 amid DeFi sector challenges. Current metrics show the token trading between $0.167-$0.186, with market capitalization of approximately $137-174 million. The impact of interest rates, dollar index movements, and monetary policy on TBC was not addressed in available materials.
-
Geopolitical Factors: DYDX's decentralized architecture and cross-border trading capabilities position it within the context of international financial flows and permissionless custody. Specific geopolitical considerations regarding TBC's operations were not detailed in the materials.
III. 2026-2031 Price Forecast: TBC vs DYDX
Short-term Forecast (2026)
- TBC: Conservative $6.59-$7.24 | Optimistic $7.24-$7.46
- DYDX: Conservative $0.13-$0.20 | Optimistic $0.20-$0.22
Medium-term Forecast (2028-2029)
- TBC may enter a consolidation phase, with estimated prices ranging from $5.45 to $9.85 in 2028, and $6.43 to $9.64 in 2029
- DYDX may experience gradual growth, with projected prices between $0.17 and $0.29 in 2028, and $0.22 to $0.30 in 2029
- Key drivers: institutional capital flows, ETF developments, ecosystem expansion
Long-term Forecast (2030-2031)
- TBC: Baseline scenario $8.64-$9.29 (2030), $6.46-$11.33 (2031) | Optimistic scenario $13.37 (2030), $13.82 (2031)
- DYDX: Baseline scenario $0.20-$0.29 (2030), $0.32-$0.33 (2031) | Optimistic scenario $0.38 (2030), $0.43 (2031)
View detailed price predictions for TBC and DYDX
Disclaimer
TBC:
| Year |
Predicted High Price |
Predicted Average Price |
Predicted Low Price |
Price Change |
| 2026 |
7.45617 |
7.239 |
6.58749 |
0 |
| 2027 |
8.6701503 |
7.347585 |
7.0536816 |
1 |
| 2028 |
9.8509072095 |
8.00886765 |
5.446030002 |
11 |
| 2029 |
9.64427842413 |
8.92988742975 |
6.42951894942 |
23 |
| 2030 |
13.3733994147936 |
9.28708292694 |
8.6369871220542 |
28 |
| 2031 |
13.822894228457496 |
11.3302411708668 |
6.458237467394076 |
57 |
DYDX:
| Year |
Predicted High Price |
Predicted Average Price |
Predicted Low Price |
Price Change |
| 2026 |
0.21645 |
0.195 |
0.13065 |
0 |
| 2027 |
0.2839005 |
0.205725 |
0.115206 |
5 |
| 2028 |
0.2937753 |
0.24481275 |
0.171368925 |
26 |
| 2029 |
0.30430224825 |
0.269294025 |
0.22351404075 |
38 |
| 2030 |
0.378573540345 |
0.286798136625 |
0.19789071427125 |
47 |
| 2031 |
0.42916473164565 |
0.332685838485 |
0.32270526333045 |
71 |
IV. Investment Strategy Comparison: TBC vs DYDX
Long-term vs Short-term Investment Strategies
-
TBC: May appeal to investors focused on Bitcoin infrastructure innovation and scalability solutions. The asset's historical volatility (ranging from $2 to $19.8) suggests potential for significant price movements, though such patterns involve elevated risk. Investors interested in emerging blockchain infrastructure projects may consider TBC within a diversified portfolio approach.
-
DYDX: May suit investors seeking exposure to decentralized derivatives trading infrastructure and DeFi governance mechanisms. The token's established ecosystem, featuring institutional partnerships and protocol utility through trading fee revenues and governance participation, presents characteristics associated with operational platforms. The controlled supply mechanism with a 2% inflation cap and buyback program represents structured tokenomics.
Risk Management and Asset Allocation
-
Conservative Investors: A balanced allocation approach might involve TBC: 30-40% vs DYDX: 60-70%, reflecting DYDX's more established market presence, operational ecosystem, and governance utility. Conservative positioning emphasizes assets with demonstrated use cases and institutional engagement.
-
Aggressive Investors: A growth-oriented allocation could consider TBC: 60-70% vs DYDX: 30-40%, reflecting higher exposure to emerging infrastructure projects with potential for significant price appreciation, balanced against DYDX's established protocol operations. This approach accepts elevated volatility in pursuit of potential returns.
-
Hedging Tools: Portfolio risk management may incorporate stablecoin allocations (USDT, USDC) for liquidity preservation, derivatives instruments including options for downside protection, and cross-asset diversification across different blockchain infrastructure categories to mitigate sector-specific risks.
V. Potential Risk Comparison
Market Risks
-
TBC: The asset demonstrates substantial price volatility, with historical ranges from $2 to $19.8. Current 24-hour trading volume of $32,276.69 indicates moderate liquidity conditions. Market capitalization of $200.30 million positions TBC in the mid-cap category, where price movements may be influenced by relatively smaller capital flows. Limited historical data (launched February 2024) presents challenges in assessing long-term stability patterns.
-
DYDX: The token experienced significant price compression, declining 91.33% during 2024 amid broader DeFi sector pressures. Historical price range from $0.126201 to $4.52 reflects considerable volatility. Current 24-hour trading volume of $376,915.33 and market capitalization of $159.29 million indicate moderate market depth. The token's correlation with DeFi sector performance and derivatives trading volumes creates exposure to trading activity fluctuations and competitive dynamics within decentralized exchange markets.
Technical Risks
-
TBC: As a Bitcoin Virtual Machine infrastructure project, technical risks may include network scalability challenges, smart contract security vulnerabilities, and integration complexities with Bitcoin's base layer. Information regarding specific technical audits, network uptime metrics, and developer activity was not available in provided materials, limiting comprehensive technical risk assessment.
-
DYDX: The platform's migration to dYdX Chain v4 (Cosmos SDK with CometBFT consensus) introduces technical considerations including network security maintenance, validator coordination, and cross-chain bridge vulnerabilities. The shift from Ethereum Layer 2 (StarkEx) to an independent blockchain creates dependencies on validator participation and consensus mechanism stability. Off-chain order book architecture, while providing efficiency benefits, requires robust infrastructure maintenance. Security considerations include smart contract risks in perpetual futures settlement and oracle dependencies for price feeds.
Regulatory Risks
-
TBC: Regulatory positioning remains uncertain given limited information regarding compliance frameworks and jurisdictional operations. Infrastructure projects focusing on Bitcoin scalability may face evolving regulatory scrutiny regarding securities classification, particularly if governance or staking mechanisms are implemented.
-
DYDX: As a decentralized derivatives trading protocol, DYDX operates within a complex regulatory environment. Derivatives trading platforms face regulatory considerations across multiple jurisdictions, including potential classification under securities regulations, commodity trading oversight, and anti-money laundering requirements. The platform's non-custodial architecture and governance token structure may attract regulatory attention regarding decentralized autonomous organization (DAO) frameworks. Evolving global regulations regarding DeFi platforms, particularly concerning perpetual futures and leverage products, represent ongoing compliance considerations.
VI. Conclusion: Which Is the Better Buy?
📌 Investment Value Summary:
-
TBC Characteristics: Positioning in Bitcoin infrastructure development through Bitcoin Virtual Machine technology. Price trajectory shows significant historical volatility ($2-$19.8 range). Market capitalization of $200.30 million indicates mid-cap status. Forecasts suggest potential price ranges of $6.46-$13.82 by 2031 under various scenarios. Limited information regarding supply mechanisms, institutional adoption, and ecosystem development presents challenges in comprehensive valuation assessment.
-
DYDX Characteristics: Established decentralized derivatives trading protocol with operational infrastructure since August 2021. Governance utility through protocol participation, fee revenue distribution, and staking mechanisms. Technology migration to dYdX Chain v4 demonstrates ongoing development. Controlled supply mechanism with 2% inflation cap and fee-based buyback program. Market capitalization of $159.29 million with institutional partnerships including StarkWare. Forecasts suggest potential price ranges of $0.32-$0.43 by 2031 under various scenarios.
✅ Investment Considerations:
-
Novice Investors: May consider focusing on assets with established operational frameworks and demonstrable utility. DYDX's governance functions, operational trading platform, and structured tokenomics provide more accessible evaluation criteria. Starting with smaller allocations while developing understanding of market dynamics and technical fundamentals represents a measured approach. Portfolio diversification across multiple asset categories helps mitigate concentration risk.
-
Experienced Investors: May evaluate allocation based on risk tolerance and portfolio objectives. TBC represents exposure to emerging Bitcoin infrastructure with higher volatility characteristics. DYDX provides exposure to decentralized derivatives trading with established metrics for assessment including trading volumes, protocol revenues, and governance participation. Balancing positions across different blockchain infrastructure categories and market capitalizations may align with diversification strategies.
-
Institutional Investors: May conduct comprehensive due diligence regarding technical architecture, compliance frameworks, governance structures, and operational sustainability. DYDX's institutional partnerships, protocol revenues, and governance mechanisms provide evaluation criteria consistent with institutional investment processes. TBC's positioning in Bitcoin infrastructure may align with thematic allocation strategies, though limited operational history and transparency regarding tokenomics require careful assessment. Risk management frameworks should incorporate liquidity analysis, custody solutions, and regulatory compliance considerations.
⚠️ Risk Disclosure: Cryptocurrency markets exhibit significant volatility and involve substantial risk of capital loss. This analysis does not constitute investment advice, financial guidance, or recommendations for asset purchase or sale. Investors should conduct independent research, assess personal risk tolerance, and consult qualified financial professionals before making investment decisions. Past performance does not indicate future results. Regulatory environments remain subject to change across jurisdictions.
VII. FAQ
Q1: What is the main difference between TBC and DYDX in terms of use cases?
TBC focuses on Bitcoin infrastructure development through Bitcoin Virtual Machine (BVM) technology aimed at enabling smart contract functionality on Bitcoin, while DYDX operates as an established decentralized derivatives trading protocol offering perpetual futures and margin trading services. TBC launched in February 2024 as a scalability solution for Bitcoin's base layer, positioning itself in the infrastructure development category. DYDX, operational since August 2021, serves as both a governance token and utility asset within a functioning derivatives trading platform, with daily on-chain trading volumes exceeding $200 million and institutional partnerships including StarkWare.
Q2: How do the supply mechanisms of TBC and DYDX compare?
DYDX implements a structured supply mechanism with a maximum cap of 1 billion tokens, a permanent 2% inflation limit, and approximately 820 million tokens in circulation (82% circulation ratio). The protocol utilizes 25-75% of trading fees for token buybacks, creating potential supply reduction during market volatility. Information regarding TBC's supply mechanism, including maximum supply, circulation ratio, and inflation management, was not available in the provided materials, limiting comprehensive comparison of tokenomics structures between the two assets.
Q3: Which asset demonstrates greater price volatility historically?
TBC exhibits more substantial historical price volatility with a range of $2 to $19.8 (approximately 890% variation from low to high), while DYDX shows volatility ranging from $0.126201 to $4.52 (approximately 3,480% variation). However, considering the percentage decline from peak, DYDX experienced a 91.33% drawdown during 2024, while TBC's current price of $7.205 represents approximately 64% below its September 2025 peak of $19.8. Both assets demonstrate significant volatility characteristics, though DYDX's longer operational history provides more extensive price pattern data for analysis.
Q4: What are the key technical developments distinguishing these projects?
DYDX completed migration to dYdX Chain v4 in 2023, transitioning from Ethereum Layer 2 (StarkEx ZK-rollups) to an independent blockchain built on Cosmos SDK with CometBFT consensus. This architectural evolution addresses gas fee concerns and scalability limitations while maintaining decentralized governance and non-custodial trading. The platform combines Layer 1 sovereignty with off-chain order books for efficiency. Information regarding TBC's specific technical developments, network architecture, upgrade roadmap, and smart contract implementation details was not provided in available materials, limiting technical comparison capabilities.
Q5: How do institutional adoption patterns differ between TBC and DYDX?
DYDX demonstrates measurable institutional engagement through partnerships with StarkWare, platform accessibility across over 20 trading venues, and open interest reaching approximately $175-200 million by Q3 2025. The protocol's governance structure enables institutional participation in protocol upgrades, fee structures, and risk parameters. A community treasury (5% of initial supply) funds development initiatives. Information regarding TBC's institutional partnerships, enterprise adoption metrics, or verified institutional holdings was not available in provided materials, presenting challenges in assessing comparative institutional engagement levels.
Q6: What allocation strategies might suit different investor profiles?
Conservative investors may consider higher DYDX allocation (60-70%) relative to TBC (30-40%), reflecting DYDX's operational platform status, established governance utility, and institutional partnerships. Aggressive investors seeking exposure to emerging infrastructure may consider higher TBC allocation (60-70%) relative to DYDX (30-40%), accepting elevated volatility for potential appreciation in Bitcoin infrastructure development. Both approaches should incorporate risk management tools including stablecoin allocations for liquidity, derivatives instruments for downside protection, and cross-asset diversification across blockchain infrastructure categories to mitigate sector-specific concentrations.
Q7: What are the primary regulatory considerations for these assets?
DYDX operates within decentralized derivatives trading regulations, facing considerations including securities classification across jurisdictions, commodity trading oversight, anti-money laundering requirements, and evolving DeFi platform regulations. The protocol's perpetual futures products and leverage mechanisms may attract regulatory scrutiny. Its non-custodial architecture and DAO governance structure present additional compliance considerations. TBC's regulatory positioning remains less defined in available materials, though infrastructure projects focusing on Bitcoin scalability may face evolving regulatory examination regarding securities classification, particularly if governance or staking mechanisms are implemented. Both assets operate in jurisdictions with developing regulatory frameworks for digital assets.
Q8: How do the 2026-2031 price forecasts compare between TBC and DYDX?
TBC forecasts suggest potential ranges from $6.46-$13.82 by 2031 under baseline and optimistic scenarios, representing possible appreciation from current levels of $7.205. DYDX forecasts indicate potential ranges from $0.32-$0.43 by 2031, representing possible appreciation from current levels of $0.1942. TBC demonstrates higher absolute price projections but operates at higher current valuation, while DYDX shows percentage appreciation potential of 65-121% over the forecast period. These projections incorporate considerations including institutional capital flows, ecosystem expansion, and macroeconomic conditions. Past performance and forecasting models do not guarantee future results, and actual prices may vary significantly from projections.
* The information is not intended to be and does not constitute financial advice or any other recommendation of any sort offered or endorsed by Gate.