This comprehensive comparison analyzes TCOM and SAND as two distinct digital asset platforms competing in the modern cryptocurrency landscape. TCOM, a 2025-launched decentralized IP governance protocol featuring 65 Osamu Tezuka classic properties, contrasts sharply with SAND, an established metaverse gaming platform operating since 2020. The article examines critical investment dimensions: historical price performance revealing SAND's 98.6% decline versus TCOM's 62.3% drop, current market valuations, 24-hour trading volumes favoring SAND at $715,614.34, tokenomics, institutional adoption patterns, and technological ecosystem development. Detailed price projections through 2031 accompany tailored investment strategies for conservative, aggressive, and institutional investors. Risk analysis addresses market volatility, technical sustainability concerns, and evolving regulatory frameworks affecting both platforms. This guide enables investors to evaluate which asset aligns with their risk tolerance and investmen
In the cryptocurrency market, the comparison between TCOM vs SAND remains a topic of ongoing interest among investors. Both assets exhibit notable differences in market capitalization ranking, application scenarios, and price performance, representing distinct positioning within the crypto asset landscape.
TCOM: Launched in 2025, this asset positions itself as the world's first decentralized IP governance protocol, starting with 65 classic intellectual properties from Japanese manga creator Osamu Tezuka, aiming to redefine the creation, licensing, and value distribution of intellectual properties.
SAND (Sandbox): Active since 2020, SAND has established itself as a virtual gaming world platform. Through Ethereum-based functional tokens, players can create, own, and benefit from different gaming experiences, with the ability to generate digital assets and upload them to the marketplace.
This article will provide a comprehensive analysis of TCOM vs SAND investment value comparison, examining historical price trends, supply mechanisms, institutional adoption, technological ecosystem, and future outlook, while addressing investors' key question:
"Which is the better buy right now?"
I. Historical Price Comparison and Current Market Status
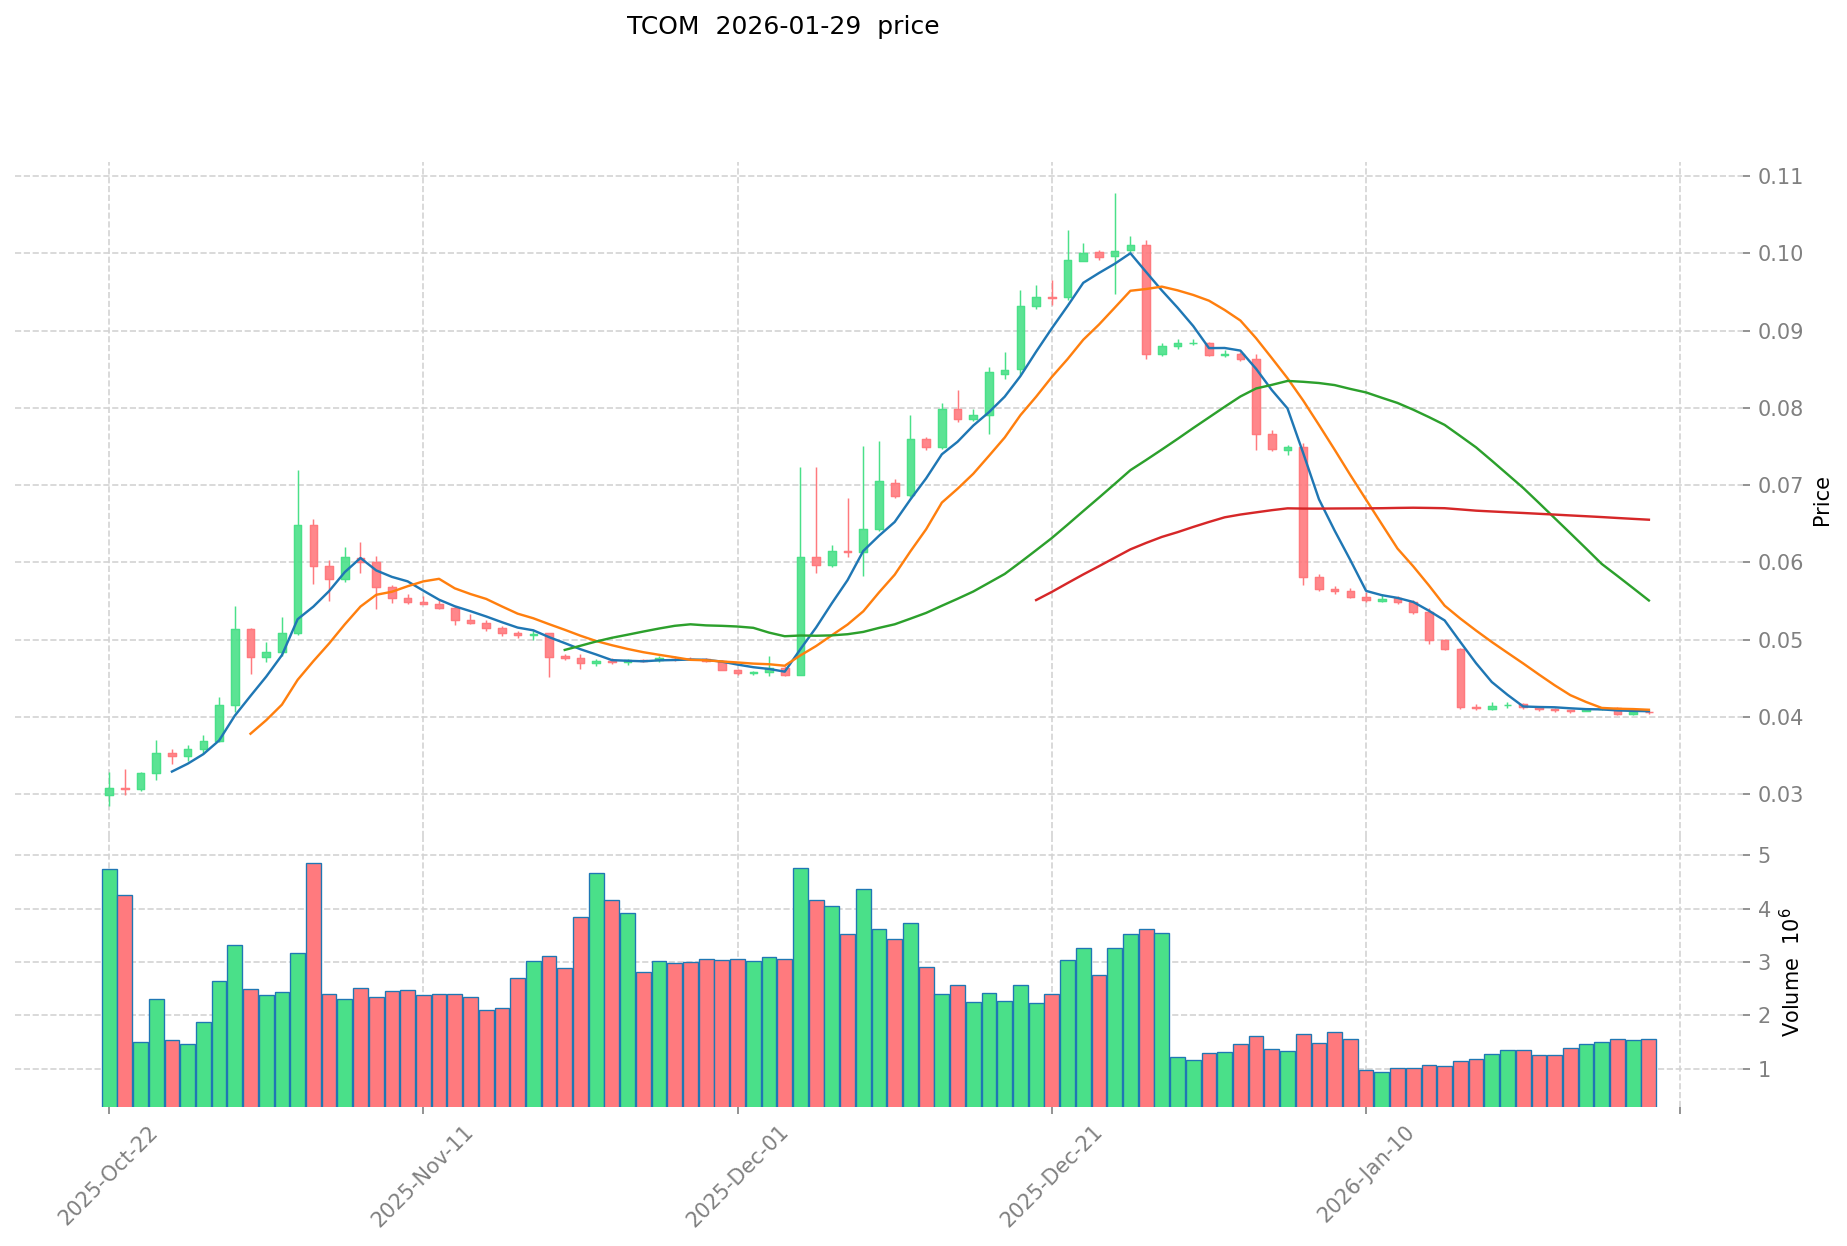
- 2025: TCOM experienced significant price volatility, reaching an all-time high of $0.10785 in December 2025 before entering a downward trajectory.
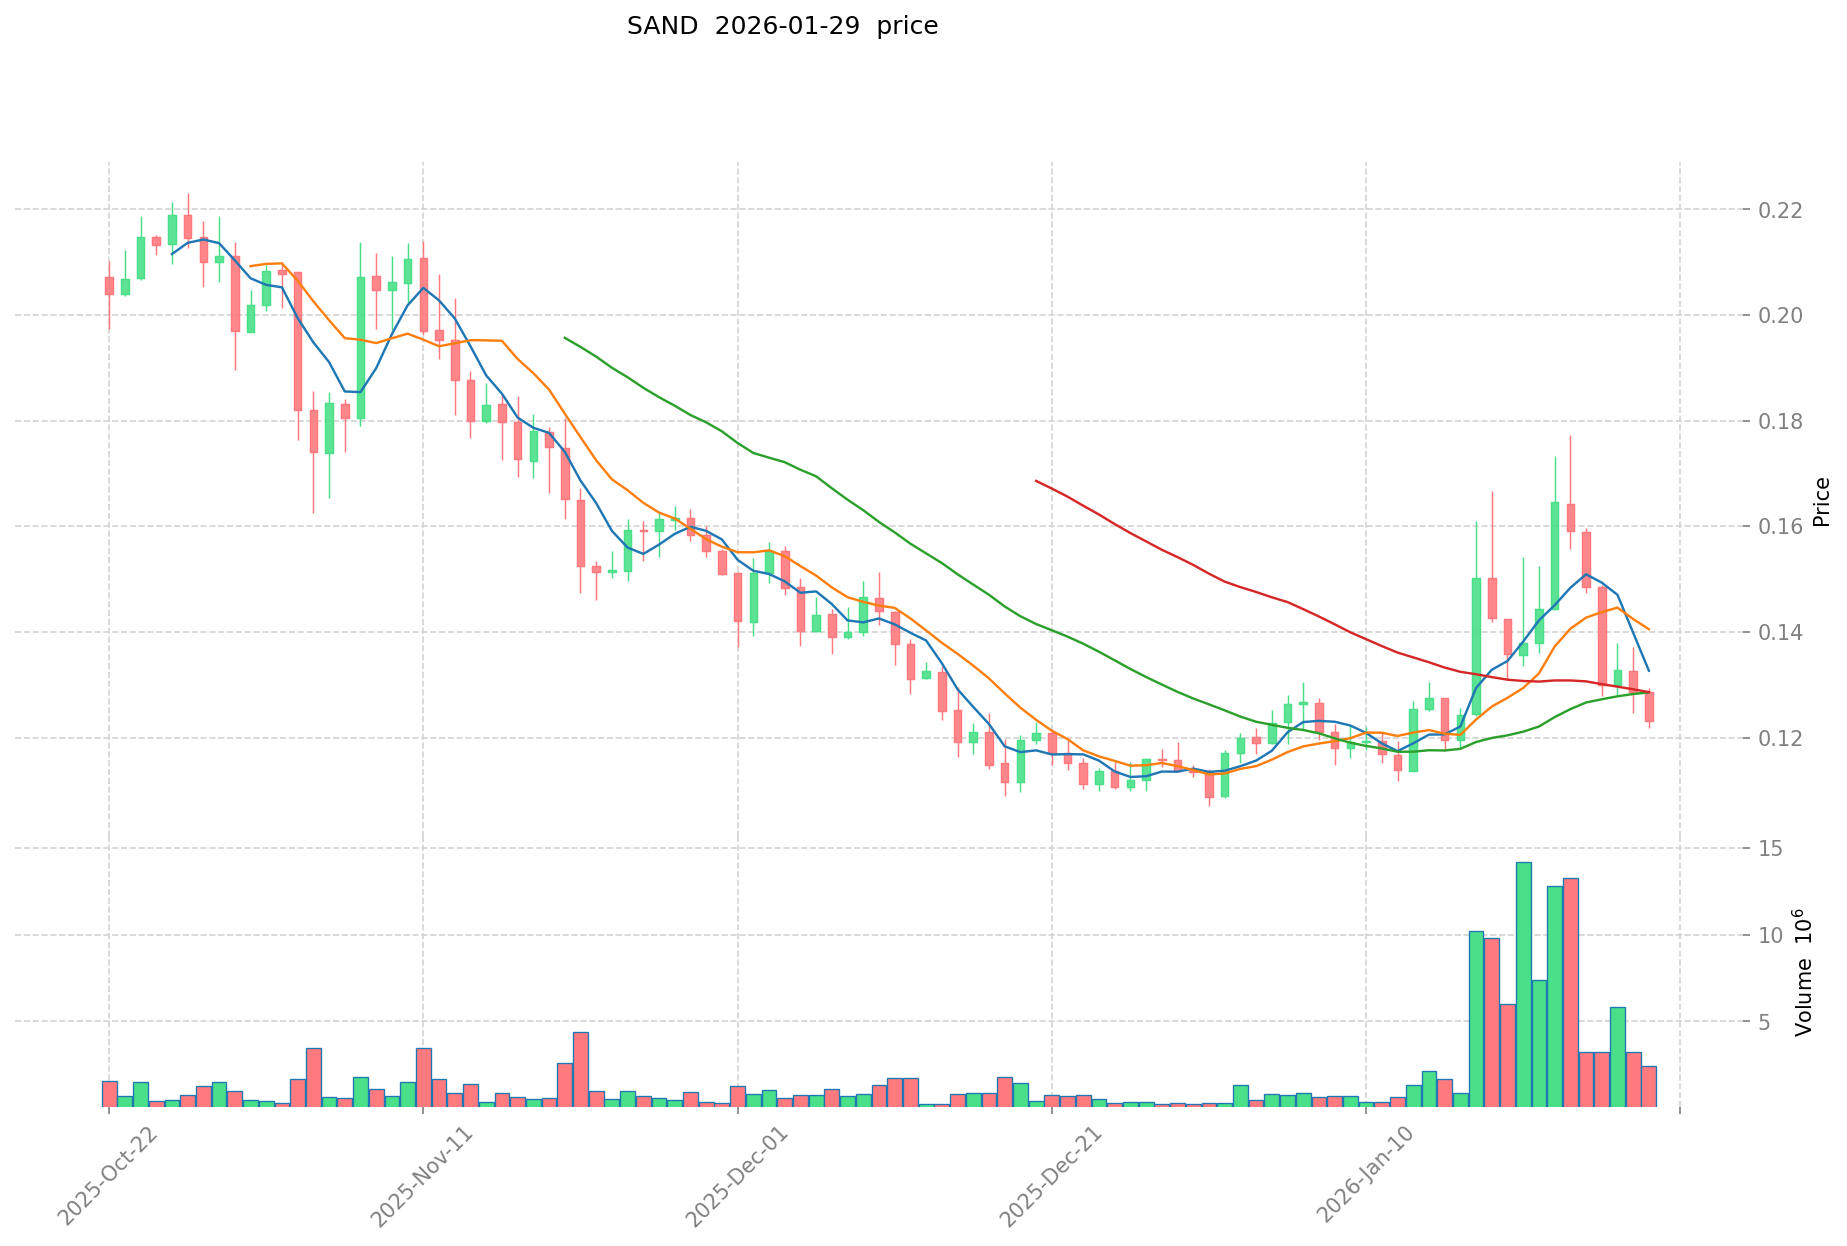
- 2021: SAND reached its historical peak of $8.4 in November 2021 during the NFT and metaverse market expansion, followed by a substantial correction.
- Comparative Analysis: During recent market cycles, TCOM declined from its peak of $0.10785 to $0.04062, representing a decline of approximately 62.3%, while SAND decreased from $8.4 to $0.1153, reflecting an approximately 98.6% decline from its historical high.
Current Market Status (2026-01-30)
- TCOM Current Price: $0.04062
- SAND Current Price: $0.1153
- 24-Hour Trading Volume: TCOM $65,670.27 vs SAND $715,614.34
- Market Sentiment Index (Fear & Greed Index): 26 (Fear)
View real-time prices:
Supply Mechanism Comparison (Tokenomics)
- TCOM: Information regarding the supply mechanism is not available in the provided materials.
- SAND: Information regarding the supply mechanism is not available in the provided materials.
Institutional Adoption and Market Application
- Institutional Holdings: The provided materials do not contain specific information about institutional preference between TCOM and SAND.
- Enterprise Adoption: Information regarding the application of TCOM or SAND in cross-border payments, settlements, or investment portfolios is not available in the provided materials.
- National Policies: The provided materials do not contain information about different countries' regulatory attitudes toward these assets.
Technological Development and Ecosystem Building
- TCOM Technical Upgrades: Information regarding technical upgrades and their potential impact is not available in the provided materials.
- SAND Technical Development: Information regarding technical development and its potential impact is not available in the provided materials.
- Ecosystem Comparison: Information regarding the implementation status in DeFi, NFT, payments, and smart contracts is not available in the provided materials.
Macroeconomic Environment and Market Cycles
- Performance in Inflationary Environments: The provided materials do not contain specific information about anti-inflation properties of either asset.
- Macroeconomic Monetary Policy: The materials mention that investors have been flowing into swap contracts, options, and direct long positions in U.S. Treasury bonds, betting that slowing inflation will allow the Federal Reserve to lower borrowing costs in the coming months, but do not specifically address the impact of interest rates or the U.S. dollar index on TCOM or SAND.
- Geopolitical Factors: Information regarding cross-border transaction demand and international situations affecting these assets is not available in the provided materials.
Short-term Prediction (2026)
- TCOM: Conservative $0.026416 - $0.04064 | Optimistic $0.04064 - $0.0422656
- SAND: Conservative $0.079212 - $0.1148 | Optimistic $0.1148 - $0.125132
Mid-term Prediction (2028-2029)
- TCOM may enter a development phase with estimated price range of $0.02918069856 - $0.07576742784 in 2028, potentially reaching $0.0564979279488 - $0.0945864187008 by 2029
- SAND may enter a consolidation phase with estimated price range of $0.1020730711 - $0.1405161758 in 2028, potentially reaching $0.110596835349 - $0.187058844973 by 2029
- Key drivers: institutional capital inflows, ETF developments, ecosystem expansion
Long-term Prediction (2030-2031)
- TCOM: Base scenario $0.064017230831424 - $0.0790336183104 (2030) | Optimistic scenario $0.059571589801464 - $0.103138871895072 (2031)
- SAND: Base scenario $0.15532711097904 - $0.1617990739365 (2030) | Optimistic scenario $0.099991827692757 - $0.239980386462616 (2031)
View detailed price predictions for TCOM and SAND
Disclaimer
TCOM:
| Year |
Predicted High Price |
Predicted Average Price |
Predicted Low Price |
Price Change |
| 2026 |
0.0422656 |
0.04064 |
0.026416 |
0 |
| 2027 |
0.060935616 |
0.0414528 |
0.028187904 |
2 |
| 2028 |
0.07576742784 |
0.051194208 |
0.02918069856 |
26 |
| 2029 |
0.0945864187008 |
0.06348081792 |
0.0564979279488 |
56 |
| 2030 |
0.098792022888 |
0.0790336183104 |
0.064017230831424 |
94 |
| 2031 |
0.103138871895072 |
0.0889128205992 |
0.059571589801464 |
118 |
SAND:
| Year |
Predicted High Price |
Predicted Average Price |
Predicted Low Price |
Price Change |
| 2026 |
0.125132 |
0.1148 |
0.079212 |
0 |
| 2027 |
0.14515886 |
0.119966 |
0.07077994 |
4 |
| 2028 |
0.1405161758 |
0.13256243 |
0.1020730711 |
14 |
| 2029 |
0.187058844973 |
0.1365393029 |
0.110596835349 |
18 |
| 2030 |
0.17150701837269 |
0.1617990739365 |
0.15532711097904 |
40 |
| 2031 |
0.239980386462616 |
0.166653046154595 |
0.099991827692757 |
44 |
Long-term vs Short-term Investment Strategies
- TCOM: Suitable for investors interested in intellectual property governance protocols and emerging decentralized IP ecosystems, with a focus on early-stage project development potential
- SAND: Suitable for investors seeking exposure to established metaverse and gaming platforms with demonstrated market presence since 2020
Risk Management and Asset Allocation
- Conservative Investors: TCOM 30% vs SAND 70%
- Aggressive Investors: TCOM 60% vs SAND 40%
- Hedging Tools: Stablecoin allocation, options contracts, cross-asset portfolio diversification
V. Potential Risk Comparison
Market Risks
- TCOM: Recently launched asset experiencing notable volatility with a decline of approximately 62.3% from its December 2025 peak of $0.10785 to current levels, indicating heightened price sensitivity in early market cycles
- SAND: Demonstrated significant historical volatility with an approximately 98.6% decline from its November 2021 peak of $8.4, reflecting vulnerability to broader metaverse and NFT market sentiment shifts
Technical Risks
- TCOM: Limited historical operational data as a 2025 launch may present uncertainties regarding protocol stability and long-term technical sustainability
- SAND: Platform maturity considerations including scalability challenges and network performance under varying user loads
Regulatory Risks
- Global regulatory frameworks continue evolving for both intellectual property tokenization platforms and metaverse gaming assets, potentially impacting operational models and market accessibility across different jurisdictions
VI. Conclusion: Which Is the Better Buy?
📌 Investment Value Summary:
- TCOM Advantages: Early-stage positioning in the decentralized intellectual property governance sector with growth potential from initial development phases
- SAND Advantages: Established market presence since 2020 with demonstrated community engagement in metaverse gaming applications
✅ Investment Recommendations:
- Novice Investors: Consider SAND for its longer operational history and established market position, with smaller allocations to TCOM for portfolio diversification
- Experienced Investors: Balanced approach incorporating both assets based on risk tolerance, with attention to technical developments and ecosystem expansion milestones
- Institutional Investors: Conduct comprehensive due diligence on protocol fundamentals, market positioning, and regulatory compliance frameworks before allocation decisions
⚠️ Risk Disclaimer: Cryptocurrency markets exhibit extreme volatility. This content does not constitute investment advice.
VII. FAQ
Q1: What is the primary difference between TCOM and SAND in terms of use cases?
TCOM focuses on decentralized intellectual property (IP) governance, while SAND operates as a metaverse gaming platform. TCOM, launched in 2025, aims to redefine IP creation, licensing, and value distribution starting with 65 classic properties from Japanese manga creator Osamu Tezuka. In contrast, SAND has been active since 2020 as an Ethereum-based virtual gaming world where players create, own, and monetize digital assets and gaming experiences through marketplace interactions.
Q2: Which asset has experienced greater price volatility from its historical peak?
SAND has experienced significantly greater price volatility, declining approximately 98.6% from its all-time high. SAND reached its peak of $8.4 in November 2021 during the NFT and metaverse boom and has since fallen to $0.1153 as of January 30, 2026. TCOM, by comparison, declined approximately 62.3% from its December 2025 peak of $0.10785 to the current price of $0.04062, representing substantial but comparatively lower volatility than SAND's historical drawdown.
Q3: What is the current market sentiment for cryptocurrency investments?
The current market sentiment stands at 26 on the Fear & Greed Index, indicating a "Fear" environment. This cautious market atmosphere reflects broader uncertainty in cryptocurrency markets and suggests investors should approach both TCOM and SAND with careful risk assessment and appropriate position sizing based on individual risk tolerance levels.
Q4: How do the 24-hour trading volumes compare between TCOM and SAND?
SAND demonstrates significantly higher trading volume than TCOM. As of January 30, 2026, SAND recorded a 24-hour trading volume of $715,614.34, while TCOM's volume stood at $65,670.27. This approximately 11-fold difference reflects SAND's more established market presence and greater liquidity, which may be an important consideration for investors concerned about entry and exit flexibility.
Q5: What are the projected price ranges for both assets by 2030?
By 2030, TCOM is projected to trade between $0.064 (base scenario low) and $0.098 (optimistic scenario high), while SAND is projected to range between $0.155 (base scenario low) and $0.171 (optimistic scenario high). These projections assume continued ecosystem development, institutional adoption, and favorable macroeconomic conditions. However, investors should note that cryptocurrency price predictions carry substantial uncertainty and should not be relied upon as guaranteed outcomes.
Q6: Which asset is more suitable for conservative investors?
For conservative investors, a portfolio allocation of 70% SAND and 30% TCOM is recommended. SAND's longer operational history since 2020, established community engagement, and demonstrated market presence provide a relatively more stable foundation compared to TCOM's early-stage positioning. Conservative investors should also consider incorporating hedging tools such as stablecoin allocations and diversification across multiple asset classes to manage downside risk exposure.
Q7: What are the key regulatory risks affecting both TCOM and SAND?
Both assets face evolving global regulatory frameworks that could impact their operational models and market accessibility. TCOM's intellectual property tokenization platform may encounter jurisdiction-specific IP law compliance requirements, while SAND's metaverse gaming applications could face scrutiny under varying digital asset and gaming regulations across different countries. Investors should monitor regulatory developments and assess potential impacts on protocol functionality and market access before making allocation decisions.
Q8: How should experienced investors approach portfolio allocation between these assets?
Experienced investors should adopt a balanced approach incorporating both assets based on individual risk tolerance and investment objectives. A moderate allocation might range from 40-60% in each asset, with regular rebalancing based on technical developments, ecosystem expansion milestones, and market cycle positioning. Experienced investors should conduct ongoing fundamental analysis of protocol developments, track community engagement metrics, and monitor macroeconomic factors such as Federal Reserve monetary policy and institutional capital flows that may influence cryptocurrency market dynamics.
* The information is not intended to be and does not constitute financial advice or any other recommendation of any sort offered or endorsed by Gate.