Master the long wick candlestick reversal strategy, a powerful technical analysis pattern that signals potential trend exhaustion through distinctive extended shadows and small bodies. This comprehensive guide reveals how to identify bullish hammers and bearish shooting stars at critical support and resistance levels, transforming dramatic price rejections into profitable trading opportunities. Learn the psychological dynamics driving market sentiment shifts, systematic entry and exit protocols using stop-loss and take-profit placement, and why confirmation from volume analysis and momentum indicators is essential for success. Discover optimal timeframe selection—from 5-minute day trading to daily charts—and practical rules distinguishing significant wicks from market noise. While long wick candlesticks offer high-probability reversal signals, understand their limitations in low-liquidity environments and choppy markets, ensuring disciplined risk management remains paramount in your trading strategy.
Key Points
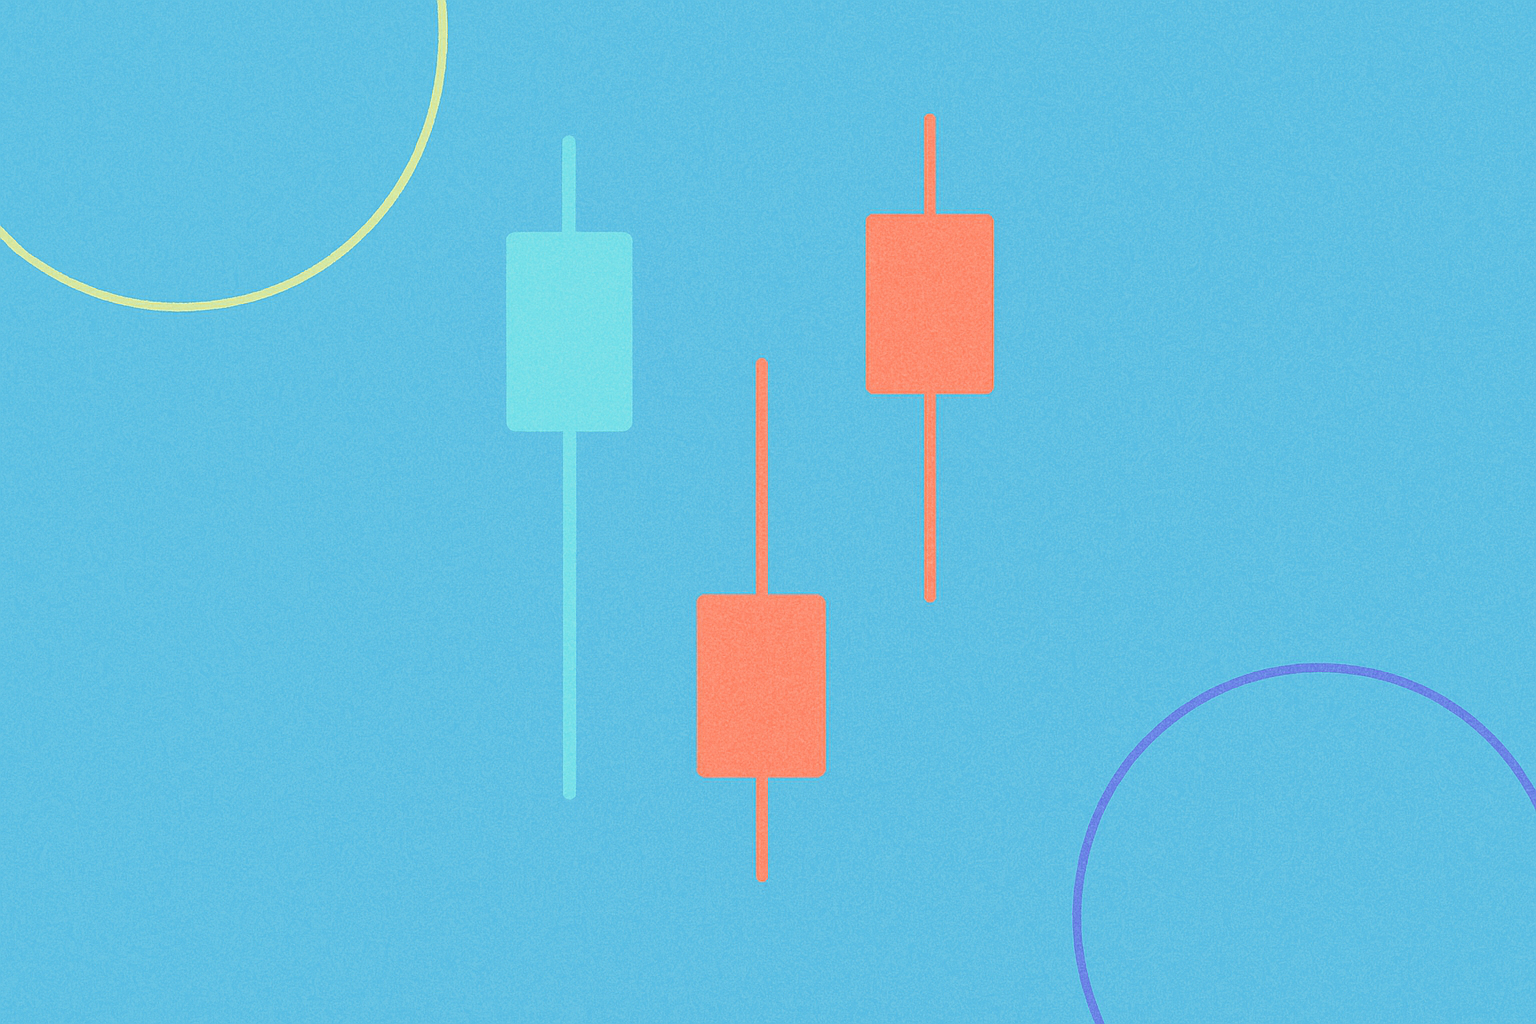
The "John Wick" candle represents one of the most dramatic and visually striking patterns in technical analysis. This distinctive candlestick formation features a small body attached to an exceptionally long wick, signifying a fierce and decisive rejection of the prevailing price direction. When traders spot this pattern, it often hints at the exhaustion of the current trend—whether it's the end of an uptrend (bearish reversal signal) or the conclusion of a downtrend (bullish reversal signal).
The true power of this pattern lies in its ability to capture a decisive shift in market sentiment. Within a single trading session, either buyers or sellers mount a swift, overwhelming counterattack that completely reverses the initial price movement. This dramatic rejection creates the characteristic long wick that gives the pattern its memorable nickname.
Effective long wick candlestick trading requires a disciplined approach to risk management. Traders should place stop-loss orders strategically near the candle's closing price to limit potential losses if the reversal signal proves false. Take-profit targets should be set at relevant support or resistance levels identified through technical analysis. Additionally, successful traders always confirm the long wick signal with supplementary indicators such as volume analysis or trend-following tools before committing capital to a position.
However, it's crucial to understand that long wick effectiveness falls sharply under certain market conditions. In low-liquidity environments, choppy sideways markets, or during major news-driven events, these patterns can generate false signals. Professional traders never rely on this candlestick pattern alone for entry or exit decisions—it should always be part of a comprehensive trading strategy that incorporates multiple confirmation signals.
What Is a Long Wick Candle?
A long wick candlestick pattern is widely regarded as a powerful reversal signal in technical analysis. This formation tends to resolve in the opposite direction of the current prevailing trend, making it a valuable tool for identifying potential turning points in price action. The defining characteristic of this pattern is its dramatically extended wick (also called a shadow) attached to a relatively small candle body.
A bullish reversal signal featuring a long wick typically appears at the end of a prolonged downtrend. This particular candle formation, commonly known as a Hammer, displays several distinctive features: a small body positioned at the top of the candle, a minimal (or completely absent) upper shadow, and a long lower shadow that extends significantly below the body. The formation tells a compelling story of market dynamics—sellers initially dominated the session and pushed the price substantially lower, but buyers stepped in with overwhelming force during the latter part of the session, driving the price back up to close near its high. This dramatic intraday reversal demonstrates that buying pressure has overcome selling pressure, suggesting the downtrend may be exhausted.
Conversely, a bearish reversal signal with a long wick manifests at the end of an uptrend. This candle, frequently called a Shooting Star, exhibits the inverse characteristics: a small body at the bottom of the candle, a small (or non-existent) lower shadow, and a long upper shadow extending well above the body. This formation reveals that buyers attempted to push the price significantly higher during the session but ultimately failed as sellers seized control and drove the price back down to close near the opening level. The rejection of higher prices signals that selling pressure has overwhelmed buying pressure, indicating the uptrend may be losing momentum.
Why Is It Called the "John Wick" Candle?
The "John Wick" nickname for this candlestick pattern draws a vivid analogy to the legendary fictional character known for his precision, efficiency, and devastating effectiveness. The candle captures a moment of extreme conflict in the market that culminates in a swift and merciless rejection of the prevailing trend, much like the character's approach to his targets.
The Long Wick = The Weapon of Rejection: Just as the character wields his weapons with deadly precision, the extended wick of this candlestick represents a total and complete rejection of the prevailing trend's advance. The length of the wick demonstrates the magnitude of the failed attempt to continue in the original direction, showing that one side of the market (buyers or sellers) made a strong push but was utterly defeated by the opposing force.
The Small Body = The Professional Efficiency: The compact body of the candle mirrors the character's trademark efficiency and precision. Despite massive intraday price volatility—evidenced by the long wick—the opening and closing prices remain very close together. This tight clustering shows that the reversal was executed with surgical precision, leaving no room for ambiguity about which side ultimately won the battle.
The Result = A Brutal and Decisive Reversal: Like the character's definitive approach to his missions, this candlestick pattern signals a potential high-probability reversal with no ambiguity. The dramatic rejection captured in the pattern suggests that the previous trend has been dealt a potentially fatal blow, and traders should prepare for a potential change in direction.
Psychology Behind Long Wick Candles
Understanding the market psychology behind long wick candlesticks is essential for interpreting their significance and trading them effectively. Each type of long wick pattern tells a unique story about the battle between buyers and sellers.
Bullish Long Wick (Long Lower Shadow): This pattern typically occurs within an established downtrend when sellers appear to be in complete control. During the trading session, sellers aggressively drive the price down sharply, often reaching new lows and creating a sense of panic among bulls. However, at some point during the session—often near the lows—buyers recognize the price as an attractive value and step in with substantial buying pressure. This buying surge is strong enough to push the price back up significantly, often closing near or above the opening price. The resulting long lower shadow demonstrates a decisive rejection of lower prices, suggesting that sellers have exhausted their ammunition and buyers are ready to take control. This shift in sentiment from fear to confidence forms the psychological foundation for a potential bullish reversal.
Bearish Long Wick (Long Upper Shadow): This formation appears in the context of an uptrend when buyers seem dominant. During the session, buyers enthusiastically push prices upward, sometimes reaching new highs and creating euphoria among bulls. However, at the peak of this advance, sellers enter the market with overwhelming force, recognizing the price level as overextended or meeting resistance. The selling pressure is strong enough to drive the price back down to close near the opening level, creating the characteristic long upper shadow. This price action indicates that buyers have lost momentum and sellers are now in control. The rejection of higher prices reveals a shift in market psychology from greed and optimism to caution and profit-taking, laying the groundwork for a potential bearish reversal.
Spinning Top Candles (Both Wicks Long): When a candlestick features long wicks on both the upper and lower ends with a small body in the middle, it creates what traders call a Spinning Top. This pattern signifies profound indecision and equilibrium between buyers and sellers. During the session, both sides made aggressive attempts to control the price—buyers pushing it higher and sellers driving it lower—but neither side could maintain control, resulting in a close near the opening price. The long shadows on both ends indicate an absence of meaningful net price change despite significant intraday volatility. This indecision often precedes significant trend changes, as it suggests the current trend is losing conviction and the market is searching for a new direction. Traders should watch for subsequent candles to determine which side will ultimately gain control.
What If a Candlestick Has Two Long Wicks?
A Spinning Top
A spinning top represents a unique and significant candlestick formation that demands special attention from traders. This pattern is characterized by very long upper and lower shadows (wicks) with a small body positioned between them. The visual appearance resembles a spinning top toy, hence the name.
The appearance of a spinning top signifies profound indecision in the market, as both buyers and sellers have made strong attempts to control price direction but neither has succeeded in establishing dominance. The long shadows on both ends indicate that significant price movement occurred in both directions during the session, yet the opening and closing prices remain very close together. This lack of meaningful net price change despite high volatility suggests that the current trend is losing momentum and conviction.
Spinning tops are particularly significant when they appear after extended trends. They hint that the prevailing market trend is likely to change, either by reversing completely in the opposite direction or by transitioning into a sideways consolidation phase. Experienced traders view spinning tops as warning signals that the current trend may be exhausted, prompting them to tighten stop-losses, take partial profits, or prepare for a potential trend change. The subsequent candles following a spinning top often provide crucial confirmation about which direction the market will ultimately choose.
How To Recognize the Long Wick Candlestick?
How Long is "Long Enough"? A Rule of Thumb
One of the most common questions traders ask when learning about long wick candlesticks is: "How long must the wick be to qualify as 'long'?" While there's no universally rigid standard, experienced traders have developed practical guidelines based on the relationship between the wick length and the candle body size.
A widely accepted guideline in the trading community is that the wick should be at least two to three times the length of the candle's body to be considered significant. This ratio ensures that the rejection was substantial enough to represent a meaningful shift in market sentiment rather than just normal intraday volatility.
Strong Signal: When the wick measures approximately three times the size of the body or more, it represents a strong rejection signal. This extreme ratio indicates that one side of the market made a very aggressive attempt to push prices in their favor, only to be completely overwhelmed by the opposing force. Such dramatic rejections often lead to powerful reversals, making them high-probability trading opportunities when confirmed with other technical factors.
Weak Signal: Conversely, if the wick is only slightly longer than the body—perhaps 1.5 times or less—its significance as a reversal signal is considerably diminished. Such modest wicks may simply represent normal intraday fluctuations rather than a decisive rejection of a price level. Traders should exercise caution and seek additional confirmation before acting on these weaker formations.
Additionally, traders should consider the context in which the long wick appears. A long wick that forms at a significant support or resistance level, or that coincides with other technical signals, carries more weight than one appearing in the middle of a trading range without clear technical context.
How to Trade the "John Wick" (Long Wick) Candle Strategy
Trading the long wick candlestick pattern requires a systematic approach that incorporates proper risk management and strategic placement of orders. The foundation of this strategy lies in understanding where to place your stop-loss and take-profit orders to maximize the probability of success while minimizing potential losses.
The Stop Loss order is typically placed strategically near the closing price of the long wick candle. This placement protects your position if the reversal signal proves to be false. For a bullish long wick (hammer), the stop-loss is placed just below the low of the wick; for a bearish long wick (shooting star), it's placed just above the high of the wick. This ensures that if the market continues in the original trend direction and invalidates the reversal signal, your loss is limited to a predetermined amount.
The location of Take Profit orders for bullish or bearish long wick candlesticks depends critically on identifying relevant support and resistance levels through technical analysis:
Resistance level: This represents the price level where an uptrend typically pauses temporarily due to increased selling pressure. When trading bullish long wick candlesticks (expecting prices to rise), traders should place Take Profit orders around the next significant resistance level above the entry point. This ensures profits are captured before the price potentially encounters selling pressure that could halt the advance.
Support level: This represents the price level where a downtrend typically pauses temporarily due to increased buying pressure. When trading bearish long wick candlesticks (expecting prices to fall), traders should place Take Profit orders around the next significant support level below the entry point. This captures profits before the price potentially encounters buying pressure that could halt the decline.
When is the Best Time to Trade on a Long Wick Candle?
Timing is crucial when trading long wick candlesticks. While the pattern itself provides a valuable signal, experienced traders understand that patience and confirmation are essential for success.
Traders should wait for further confirmation from technical indicators, oscillators, or other trading tools before entering a position based solely on a long wick candle. Confirmation might come from:
- Volume analysis showing increased participation in the reversal direction
- Momentum oscillators like RSI or MACD showing divergence or reversal signals
- The next candle closing in the direction of the expected reversal
- The pattern forming at a significant support or resistance level
This confirmation approach helps avoid unnecessary losses from false signals and increases the probability of successful trades.
Regarding timeframe selection, different trading styles require different approaches. Day traders who seek to capitalize on short-term price movements can choose shorter timeframes of 5 or 15 minutes to identify and trade long wick patterns. However, these shorter timeframes tend to generate more false signals due to increased market noise.
For most traders, particularly swing traders and position traders, longer timeframes of at least 1 hour are recommended. These longer timeframes filter out much of the market noise and tend to produce more reliable reversal signals. Many professional traders prefer 4-hour or daily timeframes for long wick pattern analysis, as these provide the most significant and actionable signals.
Trading on a Bullish Long Wick Candlestick
Executing a trade based on a bullish long wick candlestick (hammer pattern) requires following a systematic process:
Step 1: Pattern Identification
Carefully identify a bullish long wick candle appearing at the end of a bearish trend. The pattern should be characterized by its long bottom shadow (at least 2-3 times the body length), a small body near the top of the candle, and little to no upper shadow. Ideally, this pattern should form at or near a significant support level to increase its reliability.
Step 2: Entry Order Placement
Place your entry order around the closing price of the identified long wick candlestick and prepare to go long (buy). Some traders prefer to wait for the next candle to open and confirm the reversal by moving higher before entering, which provides additional confirmation but may result in a slightly less favorable entry price.
Step 3: Stop Loss Placement
Place a Stop Loss order at or slightly below the low end of the long wick candlestick. This level represents the point at which the bullish reversal signal would be invalidated. If the price breaks below this level, it suggests that sellers remain in control and the reversal has failed, making it prudent to exit the position with a small loss rather than risk a larger one.
Step 4: Take Profit Placement
Place a Take Profit order at a logical resistance level, such as the previous swing high, a significant Fibonacci retracement level, or the next major area of historical price resistance. This ensures you capture profits before the price potentially encounters selling pressure that could halt or reverse the advance.
Trading on a Bearish Long Wick Candlestick
Trading a bearish long wick candlestick (shooting star pattern) follows a similar systematic approach:
Step 1: Pattern Identification
Identify a bearish long wick candle appearing at the end of an uptrend. This pattern should feature a long upper shadow (at least 2-3 times the body length), a small body near the bottom of the candle, and little to no lower shadow. The pattern is most reliable when it forms at or near a significant resistance level.
Step 2: Entry Order Placement
Place your entry order around the closing price of the bearish long wick candlestick and prepare to go short (sell). Conservative traders may wait for the next candle to open and confirm the reversal by moving lower before entering the position.
Step 3: Stop Loss Placement
Place a Stop Loss order at or slightly above the high end of the long wick candlestick. This level marks the point where the bearish reversal signal is invalidated. If the price breaks above this level, it indicates that buyers remain in control and the reversal has failed.
Step 4: Take Profit Placement
Place a Take Profit order around the next significant support level below your entry point. This might be a previous swing low, a key Fibonacci level, or a major area of historical price support where buying pressure is likely to emerge.
Limitations of the Long Wick Candle Strategy
While long wick candlesticks can provide powerful reversal signals, traders must understand their limitations to avoid costly mistakes. No trading pattern is infallible, and the long wick strategy has several important weaknesses that require careful consideration.
Low Liquidity & Erratic Markets: In thinly traded assets or during periods of low market participation, long wicks may represent random price noise rather than true reversal signals. Low liquidity can cause exaggerated price movements from relatively small orders, creating misleading wick formations that don't reflect genuine changes in market sentiment. Always verify that the asset you're trading has sufficient liquidity before relying on long wick patterns.
Lack of Trend Context: The significance of long wick patterns diminishes substantially in choppy or range-bound markets. When prices are oscillating sideways without a clear trend, long wicks appear frequently in both directions and rarely lead to sustained moves. The pattern is most effective when it appears after an extended trend, signaling potential exhaustion of that trend.
No Confirmation: Acting solely on the appearance of a long wick candle without waiting for confirmation can be extremely risky. Many long wick patterns prove to be false signals, with the price continuing in the original trend direction despite the apparent rejection. Professional traders always wait for additional confirmation—such as a follow-through candle, volume confirmation, or supporting signals from other technical indicators—before committing capital to a position.
Near Major News Events: Exercise extreme caution if long wicks form around the time of significant news announcements, economic data releases, or central bank decisions. These events can create volatile, erratic price action that produces long wicks unrelated to genuine technical reversals. News-driven volatility often subsides quickly, causing the price to resume its previous trend and invalidating the apparent reversal signal.
Ignoring Other Indicators: One of the most common mistakes traders make is relying exclusively on long wick patterns without considering other technical indicators and broader market context. Successful trading requires a comprehensive approach that incorporates multiple forms of analysis—trend indicators, momentum oscillators, volume analysis, and support/resistance levels—to validate the signal provided by the long wick pattern.
Extreme Volatility: During periods of extreme market volatility, multiple long wicks may form in both directions within a short timeframe, making it difficult to identify genuine reversal signals. In such conditions, the market is experiencing high uncertainty and rapid sentiment shifts, reducing the reliability of any single candlestick pattern.
Not a Guaranteed Reversal: Perhaps most importantly, traders must understand that long wick candlesticks indicate potential reversals, not certainties. While these patterns suggest a shift in market dynamics, they cannot guarantee that a reversal will occur or be sustained. Risk management through proper position sizing and stop-loss placement remains essential regardless of how convincing the pattern appears.
Conclusion
Trading based on long wick candlestick patterns can be a profitable component of a comprehensive trading strategy when traders can reliably identify and interpret these formations within the proper context. By learning to recognize bullish long wicks (hammers) that signal potential upward reversals and bearish long wicks (shooting stars) that indicate possible downward reversals, you can anticipate potential trend changes with greater confidence and precision.
The key to success with this pattern lies in understanding that it should never be used in isolation. The most effective approach combines long wick pattern recognition with confirmation from volume analysis, momentum indicators, and identification of key support and resistance levels. Additionally, always consider the broader market context, including trend strength, liquidity conditions, and upcoming news events that might affect price action.
However, traders must remain cognizant that long wick candlestick trading involves inherent risk, just like any trading strategy. No pattern provides guaranteed results, and false signals are inevitable. Therefore, this approach should always be combined with proper risk management techniques, including appropriate position sizing, strategic stop-loss placement, and realistic profit targets. By maintaining discipline, seeking confirmation, and managing risk effectively, traders can harness the power of long wick patterns while protecting their capital from the inevitable losing trades that occur in any trading methodology.
FAQ
What is a Long Wick Candlestick and what does it represent in technical analysis?
A long wick candlestick features an extended shadow extending from the candle body, indicating price rejection at certain levels. It signals indecision between buyers and sellers, representing potential trend reversals or support/resistance zones where traders aggressively defended prices.
How to identify and distinguish upper and lower wicks? What market signals do they represent respectively?
Upper wicks form when price rises then retreats, signaling seller rejection and potential reversal. Lower wicks occur when price dips then recovers, indicating buyer support and possible uptrend continuation. Long upper wicks suggest bearish pressure; long lower wicks suggest bullish strength and bounce opportunities.
When do long wick candlesticks typically appear in market conditions? Are they reversal or continuation signals?
Long wick candlesticks appear during high volatility and market indecision, often at support or resistance levels. They signal potential reversals when occurring at price extremes, but can also indicate continuation if volume remains strong. Context and surrounding price action determine their true significance.
How to utilize long wick candlesticks to formulate trading strategies in actual trading? What are the entry and exit methods?
Long wick candlesticks signal rejection of prices. Entry: buy near support when upper wick appears, indicating reversal potential. Exit: take profit at resistance or when wick closes below key levels. Use volume confirmation for strategy validation and set stop-loss beyond the wick extremes for risk management.
Which technical indicators work best when combined with long wick candlesticks?
Long wick candlesticks pair effectively with RSI for overbought/oversold signals, moving averages for trend confirmation, and volume analysis for reversal strength. Support/resistance levels enhance accuracy when aligned with long wicks, identifying potential breakouts or pullbacks in trading volume.
What are the risks when trading long wick candlesticks? How to set stop loss to manage risk?
Long wick candlesticks carry risks of false breakouts and sudden reversals. Set stop loss 5-10% beyond the wick's extreme point to protect capital. Place orders above resistance to catch upside moves while limiting downside exposure effectively.
What are the differences in signal strength of long wick candlesticks across different timeframes (daily, 4-hour, 1-hour)?
Daily timeframes provide stronger signals due to higher trading volume and greater institutional participation. 4-hour charts show moderate reliability, while 1-hour charts are more volatile with frequent false signals. Longer timeframes filter noise better, making long wick patterns more significant for trend reversal and support/resistance identification.
What is the difference between long wick candlesticks and other common candlestick patterns such as hammer and hanging man?
Long wick candlesticks differ by having extended shadows on one or both ends with small bodies. Hammers show bullish reversal with lower wicks, hanging men show bearish reversal with lower wicks, while long wicks indicate volatility and indecision without directional bias.
* The information is not intended to be and does not constitute financial advice or any other recommendation of any sort offered or endorsed by Gate.