Master long wick candlestick patterns to identify high-probability crypto trend reversals on Gate and other platforms. This comprehensive guide explains how 'John Wick' candles—featuring small bodies with dramatic wicks—signal market sentiment shifts when buyers or sellers mount swift counterattacks. Learn to distinguish bullish hammers from bearish shooting stars, recognize valid patterns using the 2-3x wick-to-body ratio rule, and understand the psychology driving these reversals. Discover practical trading strategies including optimal entry points, stop-loss placement near candle closes, and profit targets at support/resistance levels. The guide covers essential context requirements—confirming signals with volume and indicators, avoiding low-liquidity conditions, and managing risks through proper position sizing. Perfect for traders seeking reliable technical analysis tools to enhance cryptocurrency trading performance on Gate with structured risk management.
Key Points
Spotting a "John Wick" (long wick) candle on a crypto chart can give traders a critical early signal for high-probability trend reversals—but only when applied with context and confirmation. The "John Wick" candle features a small body and a dramatic wick, signifying a fierce rejection of the prevailing price direction, often hinting at the end of an uptrend (bearish signal) or downtrend (bullish signal).
Its power lies in capturing a decisive shift in market sentiment where buyers or sellers mount a swift, overwhelming counterattack within one session. This pattern reflects a moment when the balance of power in the market suddenly shifts, creating opportunities for traders who can recognize and act on these signals effectively.
Effective long wick trading hinges on placing stop-loss orders near the candle close, taking profits at relevant support or resistance levels, and always confirming the signal with volume or trend indicators. Long wick effectiveness falls sharply in low-liquidity, choppy, or news-driven conditions—never rely on this pattern alone for entry or exit decisions.
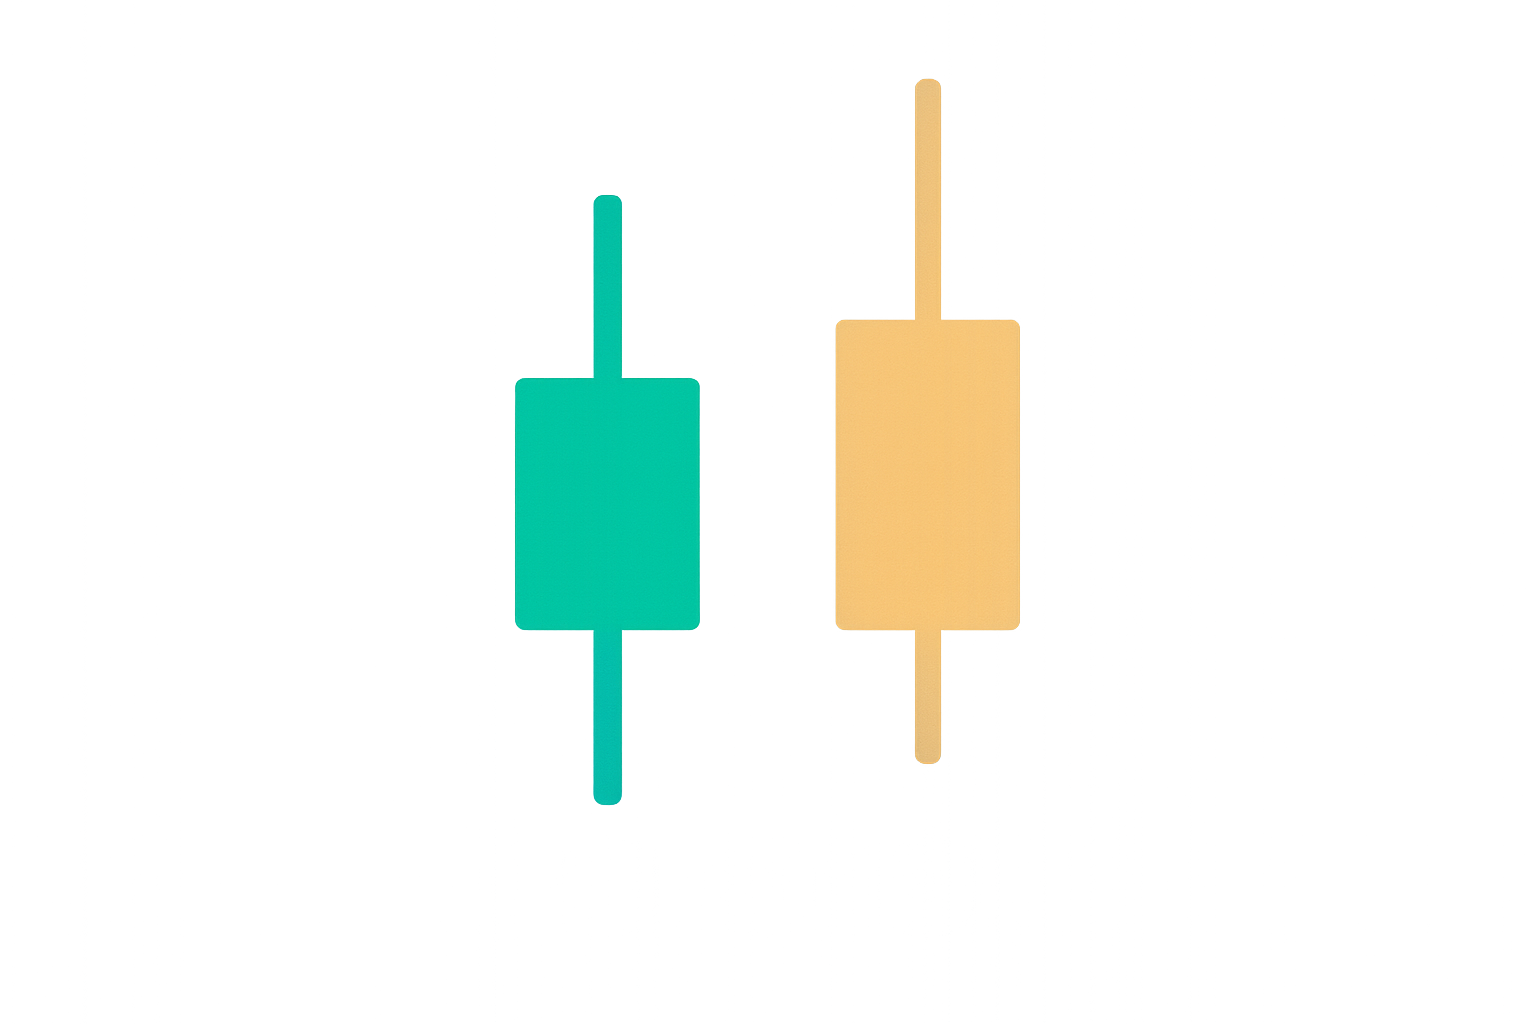
What Is a Long Wick Candle?
Traders regard the long wick candlestick pattern as a reversal signal which tends to resolve in the opposite direction of the current prevailing trend. The candle's location plays a significant role in determining whether the candlestick represents a potential bullish or bearish reversal. Understanding the context in which these patterns appear is crucial for accurate interpretation and successful trading.
A bullish reversal signal with a long wick is often found at the end of a downtrend. This candle, commonly known as a Hammer, is characterized by a small body at the top, a small (or non-existent) upper shadow, and a long lower shadow. It signifies that sellers pushed the price down during the trading session, but buyers stepped in forcefully to close the price near its high. This rejection of lower prices suggests that the selling pressure has been exhausted and buyers are beginning to take control.
In contrast, a bearish reversal signal with a long wick appears at the end of an uptrend. This candle, often called a Shooting Star, has a small body at the bottom, a small (or non-existent) lower shadow, and a long upper shadow. It indicates that buyers tried to push the price higher during the session but failed as sellers took control and drove the price back down. This pattern suggests that buying momentum has weakened and sellers are gaining strength.
Why Is It Called the "John Wick" Candle?
The "John Wick" candle captures a moment of extreme conflict in the market, culminating in a swift and merciless rejection. The analogy to the famous action movie character is particularly apt, as it reflects the sudden, decisive, and powerful nature of the price reversal. The name has gained popularity among traders for its vivid representation of market dynamics.
1. The Long Wick = The Weapon of Rejection
-
In an uptrend (Bearish "John Wick" / Shooting Star): The long upper wick shows that the bulls pushed the price aggressively higher during the session, but then hit a wall of overwhelming force. The bears not only stopped their advance but brutally drove them all the way back down. This dramatic reversal within a single session demonstrates the strength of the selling pressure and often signals that the uptrend is losing momentum.
-
In a downtrend (Bullish "John Wick" / Hammer): The long lower wick tells the opposite story. The bears were in complete command, driving prices lower, but suddenly an immense wave of buying power entered the market. The bulls launched a ferocious counter-attack, driving the price all the way back up. This shows that sellers have exhausted their strength and buyers are ready to push prices higher.
2. The Small Body = Professional Efficiency
A classic John Wick candle has a relatively small real body compared to its wick. This shows that despite the massive price volatility during the session, the opening and closing prices were very close together. It represents the efficiency and precision of the reversal, much like the protagonist's calculated and effective actions. The small body indicates that after all the intraday volatility, the market settled near where it started, but with a clear message about rejected price levels.
3. The Result = A Brutal and Decisive Reversal
The psychology created is powerful: traders confidently riding the trend are now trapped in losing positions, while traders waiting on the sidelines see a clear signal that the balance of power has shifted. This creates a cascade effect where trapped traders exit their positions and new traders enter in the opposite direction, reinforcing the reversal momentum.
Psychology Behind Long Wick Candles
Understanding the market psychology behind long wick candles is essential for traders to interpret these patterns correctly and make informed trading decisions. These patterns reflect the emotional battle between bulls and bears, providing insights into potential trend changes.
-
Bullish Long Wick (Long Lower Shadow): This occurs in a downtrend when sellers initially drive the price down sharply, often triggering stop-loss orders and creating panic selling. However, buyers step in at these lower levels, viewing them as attractive entry points, and push the price back up by the close. This rejection of lower prices indicates that the selling pressure has been absorbed and buyers are willing to defend this price level. The shift suggests the end of the downtrend, signaling potential buying opportunities for traders who recognize the pattern.
-
Bearish Long Wick (Long Upper Shadow): In an uptrend, this pattern forms when buyers push prices up aggressively, possibly reaching resistance levels or triggering profit-taking. However, sellers retaliate with strong selling pressure, leading to a close near the open. This signifies that buyers lost momentum and sellers regained control, suggesting that the uptrend may be exhausting and a reversal or consolidation could be imminent.
-
Spinning Top Candles (Both Wicks Long): This pattern features long wicks on both ends with a small body, signifying indecision and equilibrium between buyers and sellers. Neither side could maintain control during the session, creating equal rejection of both higher and lower prices. Spinning tops often precede trend changes as they indicate that the current trend is losing conviction and the market is searching for direction.
What If a Candlestick Has Two Long Wicks?
A Spinning Top
Some candlesticks have both very long upper and bottom shadows, creating what appears to be a cross or plus sign. This candlestick pattern is called the "spinning top." Generally, the candle body is small relative to the length of both wicks. The appearance of a spinning top signifies indecision from buyers and sellers as the long upper and bottom shadows indicate an absence of meaningful price change from open to close.
Despite significant intraday volatility, with prices testing both higher and lower levels, the market ultimately settled near where it began. The spinning top hints that the market trend will change by either reversing in direction or moving into a sideways trend. This pattern is particularly significant when it appears after a strong trend, as it suggests that the trend's momentum is weakening and participants are uncertain about the next direction.
How To Recognize the Long Wick Candlestick?
Long wick candlestick patterns are very easy to spot due to their distinctive long candle wicks. However, the appearance of a long wick candlestick is not a guarantee that there will be a reversal. Traders must understand the criteria for identifying valid long wick patterns and distinguish them from less significant price action.
How Long is "Long Enough"? A Rule of Thumb
A widely accepted guideline among technical analysts is that the wick should be at least two to three times the length of the candle's body. This ratio ensures that the rejection was significant and not just normal price fluctuation.
-
Strong Signal: If the wick is 3x the size of the body or more, it's considered a strong rejection signal. This indicates that one side (buyers or sellers) made a substantial attempt to move the price but was decisively rejected, suggesting a high probability of reversal.
-
Weak Signal: If the wick is only slightly longer than the body, its significance is diminished. Such patterns may simply reflect normal market volatility rather than a meaningful rejection of price levels.
Additionally, the context matters significantly. A long wick appearing after a sustained trend carries more weight than one appearing in a choppy, range-bound market. Traders should also consider the timeframe—long wicks on higher timeframes (daily, weekly) are generally more significant than those on lower timeframes (5-minute, 15-minute).
How to Trade the "John Wick" (Long Wick) Candle Strategy
Once traders can regularly spot the long candlestick patterns, they should consider how to enter or exit the market and place their Stop Loss or Take Profit orders strategically. In long wick candlestick trading, proper risk management and position sizing are crucial for long-term success.
The location of the Stop Loss order is typically placed near the closing price of the candle, or more conservatively, just beyond the extreme of the wick. This placement ensures that if the pattern fails and the price moves against the position, losses are limited.
-
Resistance level: The level where an uptrend pauses temporarily due to a concentration of supply from sellers. This is often a previous high, a round number, or a significant technical level. Traders should place their Take Profit orders around the resistance level when trading bullish long wick candlesticks, as these levels often provide natural exit points where selling pressure may increase.
-
Support level: A level where a downtrend pauses temporarily due to a concentration of demand from buyers. This could be a previous low, a moving average, or a key Fibonacci level. Traders should place their Take Profit orders around the support level when trading bearish long wick candlesticks, as these levels represent areas where buying interest typically emerges.
When is the Best Time to Trade on a Long Wick Candle?
Traders should wait for further confirmation from technical indicators, oscillators, or other trading tools to confirm the trend reversal before entering positions. This helps avoid unnecessary losses from false signals. Confirmation can come from various sources: a subsequent candle closing in the direction of the reversal, volume spikes supporting the new direction, or momentum indicators showing divergence.
Day traders can choose shorter time frames of 5 minutes or 15 minutes to quickly trade the price changes and capitalize on intraday volatility. However, these shorter timeframes carry higher risk due to increased noise and false signals. For most traders, longer time frames of at least 1 hour are sufficient and provide more reliable signals with better risk-reward ratios.
Novice traders are strongly recommended to practice their trading techniques on simulation trading platforms first. This allows them to develop pattern recognition skills and test their strategies without risking real capital. Paper trading helps build confidence and refine entry and exit techniques before committing actual funds.
Trading on a Bullish Long Wick Candlestick
-
The trader identifies a bullish long wick candle at the end of a bearish trend, characterized by its long bottom shadow. This candle should appear after a clear downtrend, not in the middle of choppy price action.
-
The trader places an order around the closing price of the identified long wick candlestick and prepares to go long. Some traders prefer to wait for the next candle to confirm the reversal by closing higher before entering.
-
To limit losses, the trader places a Stop Loss order at the low end of the long wick candlestick, or slightly below it to account for potential retests. This ensures that if the pattern fails, the loss is contained.
-
The trader places a Take Profit order at a logical resistance level, such as the previous swing high in the downtrend, the next major area of historical price resistance, or a key Fibonacci retracement level. Multiple profit targets can be used to scale out of the position.
Trading on a Bearish Long Wick Candlestick
-
The trader identifies a bearish long wick candle at the end of an uptrend, characterized by its long upper shadow. The pattern should appear after a sustained upward move to be most effective.
-
The trader places an order around the closing price of the identified long wick candlestick and prepares to go short. Waiting for confirmation from the next candle can improve the success rate.
-
To limit losses, the trader places a Stop Loss order at the high end of the long wick candlestick, or slightly above it to allow for minor retracements. This protects the account if the uptrend continues.
-
The trader places a Take Profit order around the next significant support level, such as a previous swing low, a round number, or a key moving average. Risk-reward ratios should be favorable, ideally at least 1:2 or better.
Limitations of the Long Wick Candle Strategy
While long wick candles can be powerful reversal signals, traders must be aware of their limitations and the conditions under which they are less reliable. Understanding these limitations helps prevent costly mistakes and improves overall trading performance.
-
Low Liquidity & Erratic Markets: In thinly traded assets or during off-peak hours, long wicks may be mere noise rather than true reversal signals. They are often caused by single large orders or algorithmic trading rather than genuine shifts in market sentiment. In such conditions, the pattern's predictive power is significantly reduced.
-
Lack of Trend Context: The significance of a long wick diminishes in choppy or range-bound markets where there is no clear trend to reverse. Only consider long wicks as signals following a sustained trend of at least several sessions. Without a clear trend, these patterns lose their meaning.
-
No Confirmation: Acting solely on a long wick can be risky and lead to premature entries. It's advisable to wait for confirmation from the next candle, volume analysis, or supporting indicators before making a trade. Confirmation reduces the likelihood of false signals.
-
Near Major News Events: Be cautious if long wicks form around significant news releases or economic data announcements. Initial reactions can be misleading as markets often overreact and then correct. The volatility around news can create wicks that don't reflect true market sentiment.
-
Ignoring Other Indicators: Don't rely on wicks alone, as you should always consider other indicators and market contexts. Combining long wick analysis with trend indicators, momentum oscillators, and volume studies creates a more robust trading strategy.
-
Extreme Volatility: In highly volatile markets, multiple long wicks may appear in both directions within a short period, making it hard to identify genuine reversals. During such periods, it's often better to wait for the market to stabilize.
-
Not a Guaranteed Reversal: Remember that long wicks indicate potential reversals, not certainties. Even the most perfect-looking pattern can fail, which is why risk management and stop-loss orders are essential components of any trading strategy.
Conclusion
Trading on long wick candlesticks can be very profitable if traders can reliably identify them by adhering to the identification rules and understanding the market context in which they appear. A bullish long wick candle is usually found at the end of a downtrend, signaling potential buying opportunities, while a bearish long wick candle is typically located at the end of an uptrend, suggesting possible shorting opportunities.
By learning to recognize bullish long wicks (hammers) and bearish long wicks (shooting stars), and understanding the tug-of-war between bulls and bears that creates them, you can anticipate potential reversals with greater confidence. The "John Wick" analogy helps traders remember the decisive and powerful nature of these patterns.
However, like all trading strategies, long wick candlestick trading involves a certain degree of risk. A long wick candle is only a signal that indicates there is a possibility of a trend reversal and does not guarantee that the reversal will happen. Market conditions, liquidity, and external factors can all affect the pattern's reliability.
Thus, traders are advised to combine the pattern with other available trading tools such as volume analysis, momentum indicators, and trend confirmation methods. Practice with such tools on demo accounts or simulation platforms before utilizing them in live trades with real capital. Proper risk management, including appropriate position sizing and stop-loss placement, is essential for long-term success when trading long wick patterns.
FAQ
What is a Long Wick Candlestick? What does it mean in trading?
A Long Wick Candlestick shows significant price volatility within a trading period, with the price ultimately pulling back. The extended wick indicates strong market forces and signals potential reversals or powerful trend movements.
How to identify and interpret John Wick candlestick patterns? What market conditions do they typically appear in?
John Wick candlesticks feature long wicks with small real bodies, indicating rejected prices. They appear in strong trending markets after sharp price movements, signaling potential reversals or consolidation points for traders.
What is the trading strategy for long-wick candlesticks? How should I use them to make trading decisions?
Long-wick candles signal strong market sentiment and potential reversals. Use them to confirm trends, identify support and resistance levels, and set strategic stop-loss orders. Combine with other technical indicators for stronger trading signals and better decision-making.
What is the difference between long wick candlesticks and other common candlestick patterns such as hammer and hanging man?
Long wick candlesticks feature extended wicks on both ends with small bodies, indicating strong rejection at both price levels. Hammer and hanging man have small bodies positioned at the top with long lower wicks only, signaling potential reversals from specific directions.
What are the risks of trading with long wick candlesticks? What pitfalls should I watch out for?
Long wick candlesticks carry higher trading risks. Key pitfalls include misinterpreting trend direction, false signals from fake wicks, and sudden market reversals. Always combine long wick analysis with other technical indicators to avoid over-reliance on a single strategy.
Yes, long wick candlesticks show different characteristics across timeframes. On shorter timeframes (1-hour, 4-hour), they indicate intraday volatility and reversals. On daily timeframes, they reflect stronger support/resistance levels and more significant trend shifts. Shorter timeframes capture local fluctuations, while longer timeframes reveal macro trend confirmations.
* The information is not intended to be and does not constitute financial advice or any other recommendation of any sort offered or endorsed by Gate.