Master the Long Wick candlestick strategy to identify powerful market reversals and improve your trading on Gate. This comprehensive guide covers everything from pattern recognition to risk management. Learn how bullish Long Wicks (Hammers) form at downtrend bottoms and bearish Long Wicks (Shooting Stars) appear at uptrend tops, signaling decisive shifts in market sentiment. Discover the psychological dynamics behind these patterns, practical entry and exit strategies, and critical limitations to avoid false signals. The guide emphasizes combining Long Wick analysis with volume confirmation, technical indicators, and proper stop-loss placement for consistent profitability. Whether you're a beginner or experienced trader, understanding when and how to trade these rejection patterns transforms your ability to capitalize on major market turning points while managing risk effectively.
Key Points
-
The "John Wick" candle features a small body and a dramatic wick, signifying a fierce rejection of the prevailing price direction. This distinctive pattern often hints at the end of an uptrend (bearish signal) or downtrend (bullish signal), making it a crucial tool for traders seeking reversal opportunities.
-
Its power lies in capturing a decisive shift in market sentiment where buyers or sellers mount a swift, overwhelming counterattack within a single trading session. This rapid change demonstrates the strength of the opposing force and the potential exhaustion of the previous trend.
-
Effective Long Wick trading hinges on placing stop-loss orders near the candle close, taking profits at relevant support or resistance levels, and always confirming the signal with volume analysis or trend indicators. Proper risk management is essential for consistent profitability.
-
Long Wick effectiveness falls sharply in low-liquidity environments, choppy markets, or news-driven conditions. Traders should never rely on this pattern alone for entry or exit decisions, as false signals are common in these scenarios.
What Is a Long Wick Candle?
The Long Wick candlestick pattern is regarded as a powerful reversal signal which tends to resolve in the opposite direction of the current prevailing trend. It receives its name due to the distinctive long wick (or shadow) attached to a relatively small candle body, creating a visual representation of market rejection.
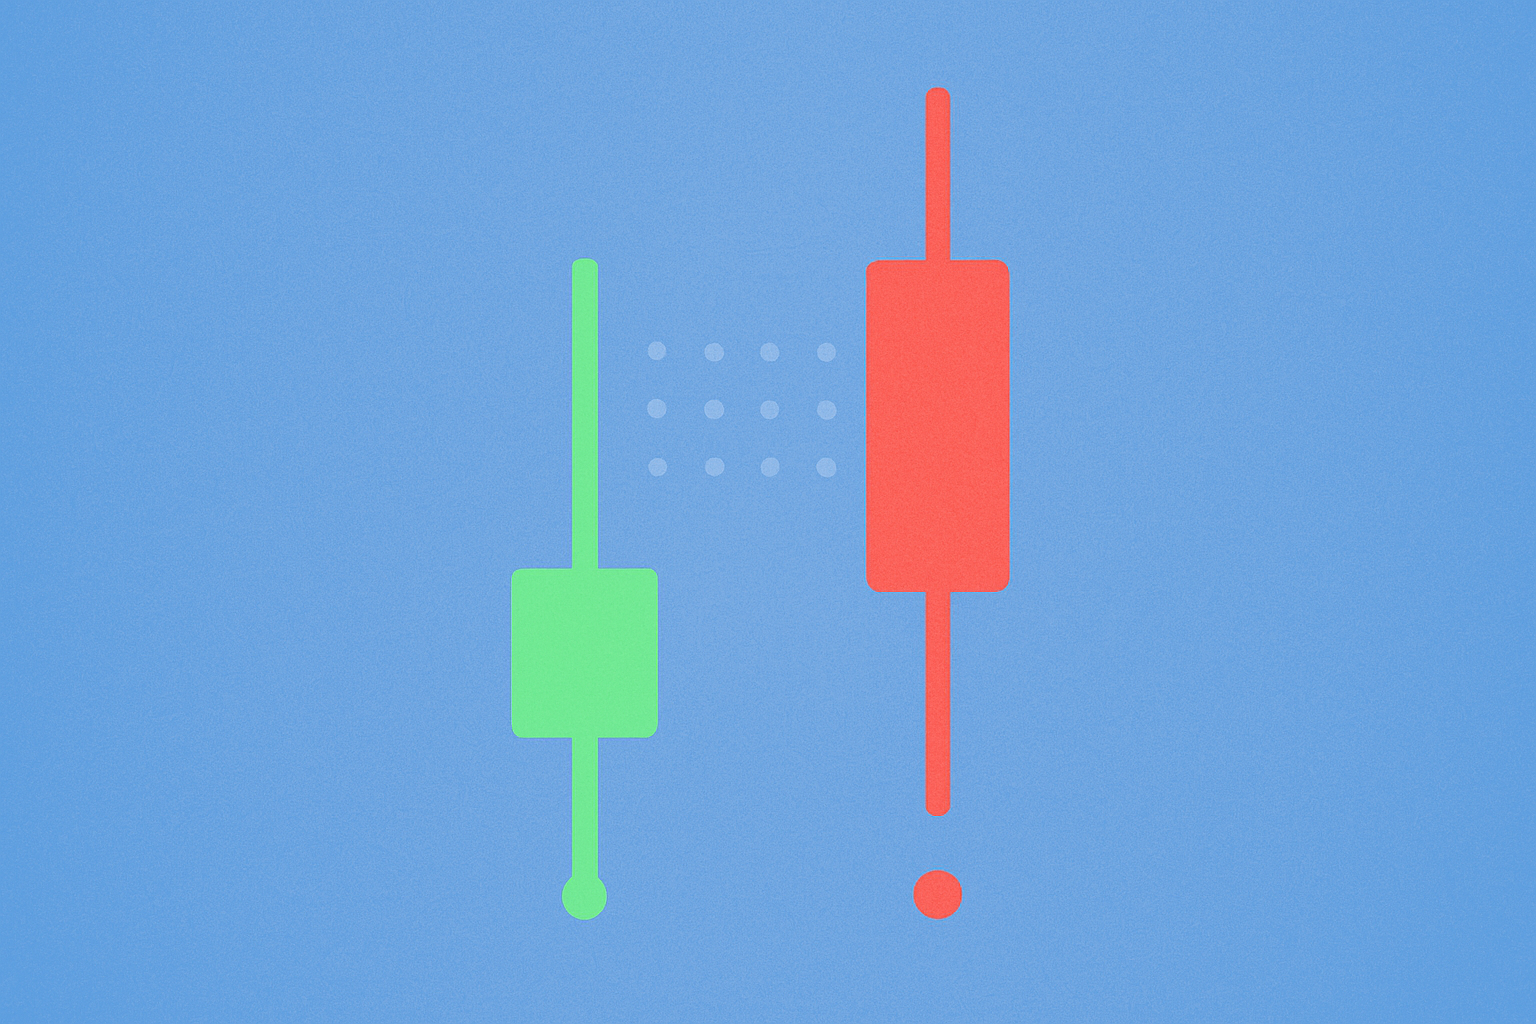
A bullish reversal signal with a Long Wick is often found at the end of a downtrend, commonly known as a Hammer. This pattern is characterized by a small body positioned at the top of the candle, a minimal or non-existent upper shadow, and a long lower shadow that extends significantly below the body. The formation signifies that sellers initially pushed the price down aggressively during the trading session, but buyers stepped in forcefully to drive the price back up, closing near the session high. This demonstrates strong buying pressure and potential trend exhaustion on the downside.
A bearish reversal signal with a Long Wick appears at the end of an uptrend, often called a Shooting Star. This pattern features a small body at the bottom of the candle, a minimal lower shadow, and a long upper shadow extending well above the body. It indicates that buyers attempted to push the price significantly higher during the session but ultimately failed as sellers took control and drove the price back down. The close near the opening price suggests that bullish momentum has been rejected and bearish forces are gaining strength.
Understanding these patterns requires recognizing that the length of the wick represents the distance between the extreme price (high or low) and the closing price, while the body shows the relationship between opening and closing prices. The longer the wick relative to the body, the more significant the rejection and potential reversal signal.
Why Is It Called the "John Wick" Candle?
The "John Wick" candle captures a moment of extreme conflict in the market, culminating in a swift and merciless rejection of the prevailing trend. The name references the iconic film character known for his brutal efficiency, unwavering determination, and uncanny ability to turn an impossible situation completely around in a matter of moments. Just as the character John Wick executes precise counterattacks against overwhelming odds, this candlestick pattern represents the market's decisive counterattack against the dominant trend.
The Long Wick = The Weapon of Rejection
The Long Wick serves as a visual record of a brutal battle between buyers and sellers, showing total and complete rejection of the prevailing trend's advance. Like John Wick's signature combat style, the wick demonstrates that despite the initial momentum in one direction, a powerful opposing force emerged to reverse the situation entirely. The length of the wick represents the magnitude of this rejection—the longer the wick, the more emphatic the reversal signal.
The Small Body = Professional Efficiency
A classic John Wick candle has a relatively small real body compared to its wick, showing that despite massive price volatility during the trading session, the opening and closing prices were very close together. This represents the efficiency and precision of the reversal, similar to how the character accomplishes his objectives with minimal wasted effort. The small body indicates that the counterattack was not only powerful but also controlled, with the opposing force successfully neutralizing the initial momentum without creating excessive volatility in the final settlement price.
The Result = A Brutal and Decisive Reversal
The psychology it creates is powerful, signaling that the balance of power has shifted decisively from one group of market participants to another. Just as John Wick's actions leave no doubt about the outcome of a confrontation, this candlestick pattern sends a clear message to traders: the previous trend has been rejected, and a potential reversal is underway. The dramatic visual impact of the pattern reinforces this psychological shift, making it one of the most recognizable and respected reversal signals in technical analysis.
Psychology Behind Long Wick Candles
Understanding the market psychology behind Long Wick candles is essential for interpreting their significance and trading them effectively. These patterns reveal the emotional dynamics and power struggles between buyers and sellers during a trading session.
-
Bullish Long Wick (Long Lower Shadow): This pattern occurs in a downtrend when sellers initially drive the price down sharply, creating fear and pessimism among market participants. However, at some point during the session, buyers recognize the price as attractive or oversold and step in aggressively, pushing the price back up significantly by the close. This action indicates a strong rejection of lower prices and suggests that selling pressure may be exhausted. The psychology shifts from fear to confidence as buyers demonstrate their willingness to absorb selling pressure and defend a price level. This often marks a potential bottom or support area where the downtrend may reverse.
-
Bearish Long Wick (Long Upper Shadow): In an uptrend, buyers initially push prices up enthusiastically, driven by optimism and greed. However, sellers retaliate with force, overwhelming the buying pressure and driving the price back down, leading to a close near the opening price. This signifies that buyers have lost momentum and sellers have regained control of the market. The psychology shifts from euphoria to caution or fear as the rejection of higher prices suggests that the uptrend may be overextended. This pattern often appears at resistance levels or market tops where profit-taking and short-selling intensify.
-
Spinning Top Candles (Both Wicks Long): This pattern features long wicks on both ends with a small body positioned in the middle, signifying extreme indecision and equilibrium between buyers and sellers. During the session, both sides attempted to push the price in their favor but neither could maintain control, resulting in a close near the open. This indecision often precedes significant trend changes as the market consolidates before breaking out in a new direction. Spinning tops are particularly significant when they appear after extended trends, suggesting that the prevailing momentum is weakening and a reversal or consolidation phase may be imminent.
The key psychological insight from Long Wick patterns is that they represent failed attempts to extend the current trend, revealing underlying weakness and potential exhaustion of the dominant force in the market.
What If a Candlestick Has Two Long Wicks?
A Spinning Top
A candlestick with both very long upper and bottom shadows is called a "Spinning Top." This distinctive pattern features a small candle body positioned between two extended wicks, and the lengths of the upper and bottom shadows are typically not equal, though both are significantly longer than the body itself.
The appearance of a Spinning Top signifies profound indecision from both buyers and sellers, indicating that neither side could establish clear dominance during the trading session. The long upper wick shows that buyers attempted to push prices higher but were rejected, while the long lower wick demonstrates that sellers tried to drive prices lower but were also rejected. The small body indicates that despite this volatility, the closing price ended up very close to the opening price.
The Spinning Top hints that the current market trend will change by either reversing in direction or moving into a sideways consolidation trend. When this pattern appears after a strong uptrend or downtrend, it often signals that the momentum driving the trend is weakening and that a period of uncertainty or reversal may be approaching. Traders should pay particular attention to Spinning Tops that form at key support or resistance levels, as these locations often mark significant turning points in market sentiment.
It's important to note that while Spinning Tops indicate indecision, they don't specify which direction the market will ultimately move. Therefore, traders should wait for confirmation from subsequent price action or other technical indicators before making trading decisions based on this pattern.
How to Recognize the Long Wick Candlestick?
The Long Wick candlestick patterns are very easy to spot due to their distinctive long candle wicks that extend significantly beyond the small body. However, the appearance of a Long Wick candlestick is not a guarantee that there will be a reversal, and traders must learn to distinguish between significant patterns and insignificant price noise.
How Long Is "Long Enough"? A Rule of Thumb
A widely accepted guideline among professional traders is that the wick should be at least two to three times the length of the candle's body to be considered a significant Long Wick pattern. This ratio ensures that the rejection represented by the wick is substantial enough to indicate a meaningful shift in market sentiment.
-
Strong Signal: If the wick is three times or more the size of the body, it represents a strong rejection signal that should not be ignored. This extreme ratio indicates that one side of the market completely overwhelmed the other, suggesting a high probability of trend reversal or significant support/resistance at that price level.
-
Weak Signal: If the wick is only slightly longer than the body (less than 2:1 ratio), its significance is diminished and may simply represent normal price fluctuation rather than a decisive rejection. In such cases, traders should be cautious about interpreting the pattern as a reversal signal.
Additional factors to consider when recognizing Long Wick patterns include:
-
Context: The pattern's location within the broader trend matters significantly. Long Wicks appearing at the end of extended trends carry more weight than those forming in the middle of trends.
-
Volume: Higher trading volume accompanying the Long Wick formation strengthens the signal, indicating that the rejection was backed by substantial market participation.
-
Time Frame: Long Wick patterns on higher time frames (4-hour, daily, weekly) are generally more reliable than those on lower time frames (1-minute, 5-minute), as they represent more significant market movements.
-
Support and Resistance: Long Wicks that form at established support or resistance levels are more significant, as they confirm the validity of these key price zones.
How to Trade the "John Wick" (Long Wick) Candle Strategy
Trading the Long Wick candle strategy requires a systematic approach that combines pattern recognition with proper risk management and strategic order placement. The following guidelines provide a comprehensive framework for executing trades based on this powerful reversal pattern.
The Stop Loss order is typically placed near the closing price of the candle to protect against false signals while giving the trade room to develop. However, more conservative traders may place stops just beyond the extreme of the wick to ensure they exit if the rejection is invalidated. The Take Profit orders depend on resistance and support levels, which represent logical price targets where the new trend may encounter obstacles:
-
The resistance level is a price zone where an uptrend pauses temporarily due to a concentration of supply from sellers who view the price as attractive for taking profits or initiating short positions. When trading bullish Long Wick candlesticks, place Take Profit orders around the nearest significant resistance level, as the price may struggle to break through this barrier on the first attempt.
-
The support level is a price zone where a downtrend pauses temporarily due to a concentration of demand from buyers who perceive the price as undervalued or attractive for long positions. When trading bearish Long Wick candlesticks, place Take Profit orders around the nearest significant support level, as this is where buying pressure may emerge to halt the decline.
When Is the Best Time to Trade on a Long Wick Candle?
Traders should exercise patience and wait for further confirmation from technical indicators, oscillators, or other trading tools to confirm the trend reversal before entering positions. This confirmation helps avoid unnecessary losses from false signals or premature entries. Longer time frames of at least 1 hour are recommended for most traders, as these provide more reliable signals and filter out much of the noise present in shorter time frames. Day traders and scalpers may use shorter time frames, but they should be aware of the increased risk of false signals.
Ideal conditions for trading Long Wick patterns include:
- Clear established trends (either up or down) that show signs of exhaustion
- High trading volume during the Long Wick formation
- Confluence with other technical indicators (RSI divergence, MACD crossover, etc.)
- Formation at key support or resistance levels
- Absence of major news events that could cause erratic price action
Trading on a Bullish Long Wick Candlestick
-
Identify the Pattern: Locate a bullish Long Wick candle at the end of a bearish trend, characterized by its long bottom shadow (at least 2-3 times the body length) and small body near the top of the candle. Ensure the pattern appears after a clear downtrend and preferably at a support level.
-
Entry Point: Place a buy order around the closing price of the identified Long Wick candlestick and prepare to go long. Some traders prefer to wait for the next candle to confirm the reversal by closing higher than the Long Wick candle's close. This confirmation reduces false signals but may result in a less favorable entry price.
-
Stop Loss Placement: Place a Stop Loss order at or slightly below the low end of the Long Wick candlestick to limit losses if the reversal fails. This level represents the point where the bullish rejection would be invalidated, suggesting that sellers remain in control.
-
Take Profit Strategy: Place a Take Profit order at a logical resistance level, such as the previous swing high, a significant Fibonacci retracement level, or the next major area of historical price resistance. Consider using a trailing stop to capture additional gains if the reversal proves stronger than anticipated.
Trading on a Bearish Long Wick Candlestick
-
Identify the Pattern: Locate a bearish Long Wick candle at the end of an uptrend, characterized by its long upper shadow (at least 2-3 times the body length) and small body near the bottom of the candle. Confirm that the pattern appears after a clear uptrend and ideally at a resistance level.
-
Entry Point: Place a sell order around the closing price of the identified Long Wick candlestick and prepare to go short. Conservative traders may wait for the next candle to close lower than the Long Wick candle's close to confirm the bearish reversal.
-
Stop Loss Placement: Place a Stop Loss order at or slightly above the high end of the Long Wick candlestick to protect against losses if the pattern fails. This level marks the point where the bearish rejection would be negated, indicating that buyers have regained control.
-
Take Profit Strategy: Place a Take Profit order around the nearest support level, such as the previous swing low, a key Fibonacci level, or a historically significant support zone. Consider scaling out of the position at multiple levels to optimize risk-reward ratios.
Limitations of the Long Wick Candle Strategy
While the Long Wick candle strategy can be highly effective, traders must understand its limitations and the conditions under which it may fail or produce unreliable signals. Awareness of these limitations is crucial for developing a robust trading approach and avoiding costly mistakes.
-
Low Liquidity and Erratic Markets: In markets with low trading volume or during off-peak hours, Long Wicks may represent mere noise rather than true reversal signals. These patterns are often caused by single large orders or algorithmic trading rather than genuine shifts in market sentiment. The thin order books in low-liquidity conditions mean that relatively small trades can create dramatic price swings that appear as Long Wicks but lack the underlying conviction to sustain a reversal.
-
Lack of Trend Context: The significance of Long Wick patterns diminishes considerably in choppy or range-bound markets where no clear trend exists. In these conditions, Long Wicks may simply represent normal price oscillation between support and resistance rather than meaningful reversals. Traders should avoid trading Long Wick patterns when the market lacks directional bias.
-
No Confirmation: Acting solely on a Long Wick without waiting for confirmation is risky and often leads to premature entries and stopped-out positions. Confirmation can come from various sources: the next candle closing in the direction of the reversal, volume analysis supporting the move, or technical indicators aligning with the signal. Patience in waiting for confirmation significantly improves the success rate of Long Wick trades.
-
Near Major News Events: Exercise extreme caution if Long Wicks form around significant news releases, earnings announcements, or economic data publications. These events can create volatile and unpredictable price action that produces Long Wick patterns without reliable follow-through. The initial market reaction to news is often reversed as participants digest the information more thoroughly.
-
Ignoring Other Indicators: Relying exclusively on Long Wick patterns without considering other technical indicators, fundamental factors, or market contexts is a recipe for inconsistent results. Always integrate Long Wick analysis with other tools such as moving averages, RSI, MACD, volume analysis, and support/resistance levels to create a comprehensive trading strategy.
-
Extreme Volatility: During periods of extreme market volatility, multiple Long Wicks may appear in both directions within a short time frame, making it exceedingly difficult to identify genuine reversals from false signals. In such conditions, it's often better to stay on the sidelines until volatility subsides and clearer patterns emerge.
-
Not a Guaranteed Reversal: Perhaps most importantly, Long Wicks indicate potential reversals, not certainties. Even the most perfect-looking Long Wick pattern can fail if market conditions change or if the underlying trend remains strong enough to overcome the rejection. Always maintain proper position sizing and risk management regardless of how confident you are in the signal.
-
Time Frame Dependency: Long Wick patterns on very short time frames (1-minute, 5-minute charts) are significantly less reliable than those on longer time frames. The noise-to-signal ratio increases dramatically on lower time frames, leading to more false signals.
Conclusion
Trading on Long Wick candlesticks can be very profitable if traders can reliably identify them and understand the market context in which they appear. By learning to recognize bullish Long Wicks (Hammers) and bearish Long Wicks (Shooting Stars), you can anticipate potential reversals with greater confidence and position yourself to capitalize on significant market turning points.
However, it's crucial to remember that a Long Wick candle is only a signal that indicates there is a possibility of a trend reversal and does not guarantee that the reversal will actually materialize. The pattern represents a rejection of price levels and a shift in market sentiment, but many factors can influence whether this shift leads to a sustained trend change or merely a temporary pause.
Traders are strongly advised to combine the Long Wick pattern with other available trading tools, including volume analysis, momentum indicators, support and resistance levels, and broader market context. Developing a comprehensive trading strategy that integrates multiple confirmation signals will significantly improve your success rate and help you avoid the common pitfalls associated with relying on any single indicator.
Additionally, practice is essential before utilizing Long Wick patterns in live trading with real capital. Use demo accounts or paper trading to develop your pattern recognition skills, test your entry and exit strategies, and build confidence in your ability to interpret these powerful reversal signals. Through disciplined practice and continuous learning, you can master the "John Wick" candle strategy and add a valuable tool to your trading arsenal.
FAQ
What is a Long Wick Candlestick? What does it represent in technical analysis?
A long wick candlestick shows price volatility and rejection. Upper wicks indicate sellers pushed price down after buyers rallied it higher. Lower wicks show buyers recovered after initial selling pressure. Long wicks signal potential reversals or support/resistance levels.
How to identify and trade the 'John Wick' candlestick pattern?
Identify 'John Wick' by a long lower wick with small body, indicating rejected lows. Trade by entering long positions when the wick forms near support, as price typically reverses upward. Confirm with volume surge and resistance levels for optimal entry points and profit targets.
What trading strategy should be adopted when long wick candlesticks appear?
When long wick candlesticks appear, identify potential reversals by analyzing the wick direction. Long upper wicks signal bearish reversals in uptrends; long lower wicks suggest bullish reversals in downtrends. Combine with volume and support/resistance levels, then enter positions accordingly with proper risk management.
What are the risks of long wick candlesticks? How to set stop loss?
Long wick candlesticks indicate strong selling pressure and high volatility. Set stop loss below the low point formed after the long wick appears. Place orders carefully to avoid significant losses during sharp reversals.
What is the difference between long wick candlesticks and other candlestick patterns such as hammer and hanging man?
Long wick candlesticks differ from hammers and hanging men by their context and meaning. Hammers appear in downtrends signaling potential reversals upward, while hanging men appear in uptrends suggesting trend exhaustion. Long wick candlesticks specifically indicate strong rejection of prices, with wicks typically twice the body length, showing market indecision and potential trend reversal.
Long wicks on daily charts reflect overall trend reversals, while 4-hour and 1-hour charts show short-term price fluctuations. Longer wicks indicate larger price swings, whereas shorter wicks reveal finer price movements and details across different timeframes.
How to combine other technical indicators to confirm the trading signals of long wick candlesticks?
Combine long wick candlesticks with moving averages and RSI to confirm signals. Moving averages validate trend direction, while RSI measures momentum strength. Use trading volume confirmation to strengthen entry points and enhance signal reliability for better trading decisions.
In what market conditions do long wick candlesticks typically appear (trends, consolidation, support/resistance levels)?
Long wick candlesticks typically appear at trend reversals, especially near support or resistance levels. They indicate price rejection and shifting market sentiment, making them valuable signals for identifying potential turning points in volatile markets.
* The information is not intended to be and does not constitute financial advice or any other recommendation of any sort offered or endorsed by Gate.