This comprehensive guide explores Doji candlestick patterns, a fundamental technical analysis tool originating from 18th-century Japanese rice trading. The article examines five Doji types—Neutral, Long-Legged, Four-Price, Dragonfly, and Gravestone—each signaling distinct market conditions and indecision levels. It provides seven actionable trading strategies including waiting for confirmation, utilizing support and resistance levels, incorporating volume analysis, and implementing proper risk management through stop-loss orders. The guide emphasizes that while Doji patterns reveal market psychology and potential trend reversals, they require confirmation from subsequent price action and should be combined with technical indicators. Ideal for traders on platforms like Gate, this resource addresses both the psychological significance and practical limitations of Doji patterns, offering a balanced framework for integrating them into comprehensive trading strategies.
What Is a Doji Candlestick?
A Doji candlestick is a fundamental pattern in technical analysis that signals market neutrality and indecision. Market neutrality occurs when the forces of buyers and sellers balance each other out, resulting in virtually no net price movement during a specific trading period. This equilibrium creates a unique visual representation on price charts that experienced traders recognize as a potential turning point.
Candlestick patterns are constructed from four essential price points that tell the story of market activity:
- Opening price of the period (indicated by the line at the top of the body)
- Closing price of the period (indicated by the line at the bottom of the body)
- Highest price during the period (indicated by where the upper wick terminates at the top)
- Lowest price during the period (indicated by where the lower wick terminates at the bottom)
When the opening and closing prices are extremely close or identical, the candlestick displays with wicks but only a thin line indicating the open/close price, with no substantial body. This distinctive formation is known as a Doji candlestick. The absence of a body visually represents the market's inability to establish a clear directional bias, making it a powerful signal for traders to monitor closely.
History of Doji Candlesticks
The origins of candlestick patterns, including the Doji, trace back to 18th century Japan, where rice traders developed sophisticated charting techniques to track market psychology and price movements. This ancient wisdom was brought to modern Western trading by Steve Nison through his groundbreaking book "Japanese Candlestick Charting Techniques," which introduced these powerful visual tools to a global audience.
In the Japanese language, "Doji" translates to "mistake" or "error," reflecting the concept that this candlestick pattern represents a situation where neither buyers nor sellers achieved their intended objective. The name captures the essence of market indecision—a moment when the collective actions of market participants result in a stalemate, signaling that the previous momentum may be exhausting itself.
This historical context adds depth to understanding why Doji patterns carry such significance in technical analysis. The centuries-old recognition of these formations demonstrates their enduring relevance in capturing fundamental market psychology that transcends time and asset classes.
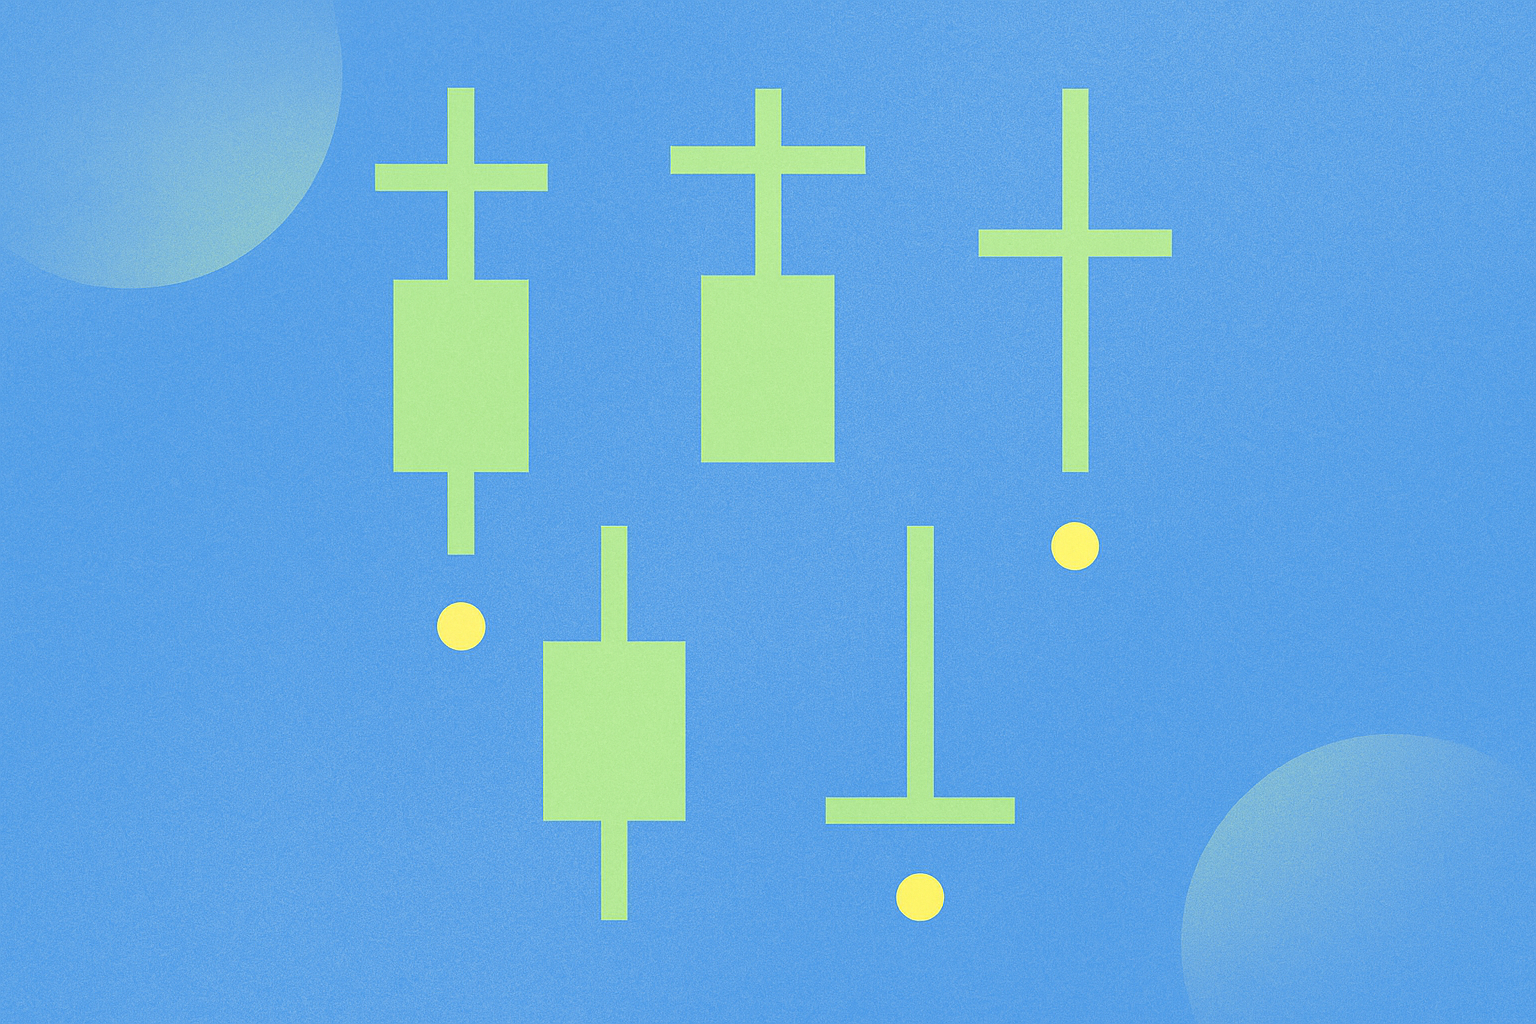
Types of Doji Candlesticks and What They Indicate
Neutral Doji
The Neutral Doji, also known as the Doji Star, represents perfect equilibrium where opening and closing prices are identical, and the upper and lower wicks are approximately equal in length. This symmetrical formation indicates complete market indecision, with neither bulls nor bears gaining any advantage during the trading session.
The equal-length wicks above and below demonstrate that price swings in both directions were balanced, suggesting that the market tested both higher and lower levels but ultimately returned to the starting point. Traders interpret this as a signal that the current trend may be losing momentum and a potential reversal or consolidation period could be approaching.
Long-Legged Doji
The Long-Legged Doji shares similarities with the Neutral Doji but features significantly longer wicks extending both above and below the opening/closing price line. This pattern indicates heightened volatility and intense battle between buyers and sellers during the trading session.
The extended wicks reveal that prices experienced substantial swings between the session's high and low, yet ultimately closed at or near the opening price. This increased volatility suggests strong disagreement about fair value and often appears at critical market junctures. When appearing after a sustained trend, the Long-Legged Doji can signal that the previous directional momentum is encountering significant resistance.
Four-Price Doji
The Four-Price Doji represents an extremely rare formation with no wicks whatsoever—just a single horizontal line where opening, closing, high, and low prices are all identical. This pattern indicates virtually no price movement occurred during the entire trading session.
While theoretically possible, Four-Price Dojis are exceptionally uncommon in high-volume markets, as they require absolute price stability throughout the period. When they do appear, they typically occur in very thin markets, extremely short timeframes, or during trading halts. Their rarity makes them less practically significant for most trading strategies.
Dragonfly Doji
A Dragonfly Doji displays the opening and closing prices at the same level as the session's high, with the wick concentrated entirely or almost entirely below this point. This formation resembles a "T" shape and carries important implications for market direction.
Dragonfly Dojis typically signal potential bullish reversals, especially when appearing after a downtrend. The pattern demonstrates that sellers pushed prices significantly lower during the session, but buyers stepped in with enough force to drive prices back up to the opening level by the close. This rejection of lower prices suggests that selling pressure may be exhausting and buyers are gaining confidence.
Gravestone Doji
The Gravestone Doji represents the opposite formation of the Dragonfly Doji, showing opening and closing prices at the session's low with a long upper wick extending above. This inverted "T" shape carries bearish implications for market direction.
When appearing after an uptrend, the Gravestone Doji can signal a potential bearish reversal. The pattern indicates that buyers pushed prices significantly higher during the session, but sellers emerged with sufficient strength to drive prices back down to the opening level by the close. This rejection of higher prices suggests that buying pressure may be weakening and sellers are gaining control.
How to Trade with Doji Candlesticks
1. Wait for Confirmation
A Doji signals indecision rather than a clear directional move, so avoid taking immediate action based solely on its appearance. The prudent approach involves waiting for the next candlestick to confirm which side—buyers or sellers—ultimately gains control. A bullish confirmation candle closing above the Doji's high suggests upward momentum, while a bearish candle closing below the Doji's low indicates downward pressure.
2. Use Dojis at Support and Resistance Levels
Doji patterns carry significantly more weight when appearing at key technical levels such as support zones, resistance areas, or major psychological price points. When a Doji forms at a support level, it may suggest that buyers are entering the market to defend that price. Conversely, a Doji at resistance might indicate sellers are preventing further upward movement. Context matters tremendously in interpreting Doji significance.
3. Incorporate Volume and Technical Indicators
Combine Doji patterns with volume analysis and complementary technical indicators to increase confidence in trading decisions. High volume accompanying a Doji suggests stronger conviction in the indecision, while low volume may indicate the pattern is less significant. Indicators like RSI, MACD, or moving averages can provide additional context about whether the Doji is likely to lead to continuation or reversal.
4. Trading Star Patterns
Doji candlesticks often form the central component of powerful reversal patterns like the Morning Star (bullish) and Evening Star (bearish). In these three-candle formations, the Doji represents the transition point between the previous trend and the new direction. Recognizing these complete patterns rather than isolated Dojis can significantly improve trading accuracy.
5. Day Trading Applications
For intraday trading, Dojis can signal potential entry and exit points for quick trades. However, traders should recognize that Dojis appearing on very short timeframes (1-minute or 5-minute charts) are generally less reliable than those on longer timeframes. The noise and random fluctuations in lower timeframes can create Doji-like patterns that lack the significance of those appearing on hourly, daily, or weekly charts.
6. Implement Stop-Loss Orders
Always use stop-loss orders when trading based on Doji patterns to manage risk effectively. A common approach places the stop just beyond the extreme of the Doji—below the low for long positions or above the high for short positions. This strategy limits potential losses if the anticipated reversal or continuation fails to materialize.
7. Consider Partial Positions and Trend Continuation
Recognize that a Doji may indicate merely a pause or consolidation within a strong trend rather than a complete reversal. In trending markets, consider taking partial positions or using the Doji as a signal to tighten stops rather than assuming an immediate directional change. Strong trends often experience brief periods of indecision before continuing in the original direction.
Psychology Behind Doji Candlesticks
The power of the Doji candlestick lies in the psychological equilibrium it reveals, signaling profound indecision among market participants. During the formation of a Doji, buyers attempt to push prices higher while sellers simultaneously pressure them lower, yet the session closes at or near the opening price. This tug-of-war reflects a critical moment when the market's collective opinion about fair value is uncertain.
The appearance of a Doji following a sustained trend typically suggests a shift in market sentiment. In an uptrend, a Doji may indicate that buyers' optimism has encountered significant resistance from sellers who believe prices have risen too far. The inability of bulls to close prices higher despite their efforts signals waning momentum. Conversely, in a downtrend, a Doji demonstrates that sellers may be losing conviction, allowing buyers to prevent further price declines.
Experienced traders understand that the Doji itself represents only the question—the next candlestick provides the answer. They don't act solely on the Doji's appearance but wait for subsequent price action to confirm which side gains control. This patience reflects an understanding that market psychology is dynamic, and the brief indecision captured by the Doji is merely a transitional state before a new directional bias emerges.
The emotional component of Doji interpretation cannot be overlooked. Traders who have been riding a trend may view a Doji as validation of their concerns about a reversal, while those waiting for an entry may see it as confirmation that their patience will be rewarded. This subjective interpretation is why combining Doji analysis with objective technical indicators and risk management is essential.
Limitations of Doji Patterns – When Not to Use Them
Not a Standalone Guarantee
A Doji candlestick does not guarantee a reversal or significant price movement. Many Dojis appear without leading to meaningful directional changes, particularly in ranging or consolidating markets. Treating every Doji as a high-probability signal can lead to overtrading and poor results.
False Signals in Low Liquidity
In thinly traded assets or very short timeframes, Dojis may represent market "noise" rather than genuine indecision. Low liquidity can cause erratic price behavior that creates Doji-like patterns lacking the psychological significance found in liquid markets. Always consider the trading volume and market context when evaluating Doji patterns.
Abundance in Consolidation
During sideways or consolidating markets, Doji patterns appear frequently as the natural reflection of ongoing indecision. In these conditions, Dojis lose their predictive value since they simply confirm what is already obvious—the market lacks clear direction. Focus on Dojis appearing after trends rather than within consolidation zones.
Timing Can Be Compromised
Waiting for confirmation after a Doji means you may enter positions at less favorable prices compared to acting on the Doji itself. This trade-off between confirmation and optimal entry is inherent in conservative trading approaches. Traders must balance the desire for confirmation against the risk of missing the best entry points.
Confusion with Similar Patterns
It's crucial to differentiate Doji patterns from other similar candlestick formations like spinning tops, which have small bodies rather than the virtually non-existent body of a true Doji. Misidentifying patterns can lead to incorrect interpretations and poor trading decisions. Develop clear criteria for what constitutes a Doji in your trading system.
Only One Piece of the Puzzle
Doji patterns should form part of a comprehensive analysis framework that considers trend direction, momentum indicators, volume, support and resistance levels, and fundamental news. Relying exclusively on Doji patterns ignores the multifaceted nature of market behavior and can result in incomplete analysis.
Emotional Bias Risk
Traders may project their own desires onto Doji patterns, seeing what they want to see rather than objectively interpreting the signal. A trader hoping for a reversal may overweight the significance of a Doji, while one committed to the current trend may dismiss it entirely. Maintain objectivity by following predetermined rules for Doji interpretation rather than making emotional decisions.
Conclusion
When considered in isolation, Doji candlesticks are not the most powerful signals for any specific market movement. However, when integrated into a broader reading of market conditions, technical indicators, and price action context, they become valuable tools for anticipating potential trend changes and periods of consolidation.
The Doji represents that delicate balance and hesitation in the market—a moment when the collective actions of buyers and sellers result in equilibrium. Though it appears as a small pattern on a price chart, it carries significant implications for understanding market psychology and potential directional shifts.
A Doji is not a clear buy or sell signal in itself, but rather an alert to pay close attention to what comes next. It's the market's way of communicating that the previous momentum has paused and a new movement may be about to occur. The key to successfully trading with Doji patterns lies in combining their appearance with confirmation signals, proper risk management, and a comprehensive understanding of the broader market context.
By respecting both the insights Doji patterns offer and their limitations, traders can incorporate these time-tested formations into robust trading strategies that account for the complex, dynamic nature of financial markets. The centuries-old wisdom captured in Doji candlesticks continues to provide value for modern traders who take the time to understand their proper application and interpretation.
FAQ
What is a Doji candlestick? What does it represent in technical analysis?
A Doji candlestick forms when opening and closing prices are identical, indicating market neutrality. It signals potential trend reversals, especially at price peaks or troughs, and typically appears in overbought or oversold conditions where buyer and seller forces are balanced.
How to identify and distinguish different types of Doji candlesticks (Long-legged Doji, Dragonfly Doji, Gravestone Doji, etc.)?
Long-legged Doji features extended upper and lower wicks with minimal body. Dragonfly Doji has a long lower wick and short upper wick. Gravestone Doji shows a long upper wick with minimal lower wick. All three have nearly invisible real bodies, distinguishing them by wick length and position differences.
How should you trade when Doji candlesticks appear? What are some reliable trading strategies?
When Doji appears, combine it with support/resistance levels and volume analysis. Use it as a reversal signal: sell at resistance with downtrend confirmation, buy at support with uptrend confirmation. Set stop losses beyond the Doji wicks. Confirm signals with moving averages or RSI indicators before entering positions.
How reliable is the Doji pattern? Is it safe to trade using Doji alone?
Doji patterns lack sufficient reliability for standalone trading. Combining Doji with other technical analysis tools, support/resistance levels, and trend indicators significantly improves trading safety and decision accuracy.
What are the differences in Doji trading signals across different timeframes (daily, 4-hour, 1-hour)?
Doji signals vary by timeframe. Daily Doji indicates longer-term trend reversals and stronger signals. 4-hour Doji reflects intermediate market sentiment shifts. 1-hour Doji suggests short-term volatility and quick trading opportunities. Shorter timeframes generate more frequent signals but with lower reliability.
How to combine support and resistance levels with other technical indicators to confirm Doji signals?
Combine Doji with support and resistance levels, then verify using RSI or Stochastic indicators. Wait for the next candle to break above or below the Doji's high or low to confirm the direction before trading.
Doji candlesticks play what role in trend reversal?
Doji candlesticks identify market indecision and confirm potential reversal points. They signal hesitation in price movement, often indicating an upcoming trend change. Combined with moving averages, Doji patterns help traders recognize when reversals may occur.
How should you set stop loss and take profit when trading with Doji?
Place stop loss between Doji high and previous candle high, take profit between Doji low and previous candle low. Use fixed levels or Doji's highest and lowest prices as exit points for flexible management.
* The information is not intended to be and does not constitute financial advice or any other recommendation of any sort offered or endorsed by Gate.